


The increased prevalence of overweight and obesity in the industrialized countries is an important public health issue( Reference Jørgensen, Capewell and Prescott 1 , Reference Pouliou and Elliott 2 ). Being overweight or obese constitutes one of the leading mortality risks around the globe, accounting for 0·7 million deaths equivalent to 8·4 % of the total deaths in the developed countries in 2004( 3 ). In Canada, between 8·2 and 12·5 % of the children aged 2–17 years were obese in 2004( 4 ). In Quebec, a quarter of children aged 2–17 years were overweight or obese in 2004( Reference Lamontagne and Hamel 5 ). The most recent data indicate that 21 % of youths aged 12–17 years are overweight or obese( Reference Camirand, Blanchet and Pica 6 ).
The food intake patterns of Canadian children have been considered partly responsible for the increase in the childhood obesity rates( Reference Taylor, Evers and McKenna 7 ). The volume of food sales from food stores as opposed to restaurants has decreased from 75 % of the average household food expenditure in 2002( 8 ) to 72 % in 2010( 9 ), and Canada’s fast-food restaurant average annual sales are estimated to continue to grow( 10 ). Therefore, Canadian children not only have more access to food in general, but they also increasingly tend to eat out, which is associated with greater energy intake( Reference Powell and Nguyen 11 ) and with larger portion sizes( Reference Rosenheck 12 ).
Also, the societal changes of the past 50 years have created risk factors associated with obesity( Reference Sallis, Floyd and Rodríguez 13 ), including individual-level factors, behavioural factors pertaining to lifestyle and environmental factors( Reference Bauman, Reis and Sallis 14 ). Among these factors, environmental factors (i.e. factors related to the natural and the built environment) constitute a promising target for public health interventions( Reference Bergeron and Reyburn 15 ). Consequently, environmental factors have been studied in relation to childhood obesity in the past decades. However, such studies focused mostly on the association of excess weight and neighbourhood environments. Moreover, school environments have recently garnered attention as environments that may influence the adoption and maintenance of healthy life habits( 4 ). In particular, school environments including built environments within and around schools may be responsible for the nutritional and physical activity opportunities offered to the students( 4 ). For instance, food environments around schools are associated with youths’ food consumption and purchasing during lunch( Reference Laxer and Janssen 16 , Reference He, Tucker and Irwin 17 ). One study( Reference Van Hulst, Barnett and Gauvin 18 ) found that eating at least five servings of fruits and vegetables daily was associated with a lower density of fast-food outlets and with a lower ratio of access to fast-food and convenience stores v. supermarkets and specialty food stores around 1000 m of school among students aged 8–10 years living in the Montreal region. Also, recent studies show a higher prevalence of junk food and sugary drinks consumption among children in Quebec; for instance, 11 % of boys and 7 % of girls eat junk food at least three times weekly, while 35 % of boys and 26 % of girls drink sugary soft drinks, eat snacks and sweets at least once daily( Reference Camirand, Blanchet and Pica 6 ).
More than half of Quebec’s public schools (58·9 %) are located within 750 m of a fast-food outlet, measured along the street networks( Reference Lalonde and Robitaille 19 ). Children spend a large part of their day on school sites and are, thus, subjected to the school environment’s influence( Reference Lalonde and Robitaille 19 , Reference Robitaille, Bergeron and Lasnier 20 ). Therefore, a better understanding of school food environments and their influence on children’s food consumption is warranted. However, no study has investigated the role that school contexts play in influencing children’s junk food consumption in a large sample collected across Quebec. Elucidating the school context’s role in relation to children’s junk food consumption will contribute to a better understanding of the determinants of youths’ health to guide interventions for ameliorating youths’ nutritional options in and around schools across Quebec.
Therefore the present study aimed to investigate the association between junk food consumption during lunchtime (JCL) in the previous week and school fast-food outlet access among secondary-school children in Quebec (aged 12–17 years), after accounting for several covariates such as selected student variables (sex, age and perceived heath), family variables (familial status and parental education), as well as school variables (school status and deprivation), which were consistent covariates of youths’ junk food consumption( Reference He, Tucker and Irwin 17 , Reference Buck, Börnhorst and Pohlabeln 21 – Reference Shields and Shooshtari 24 ). Junk food refers to foods of poor nutritional quality and rich in energy, which should not be consumed regularly nor should be readily/easily available in our food environments( 25 ).
Methods
Data sources
The study was approved by the Institute of Statistics of Quebec’s Ethics Committee. Four databases were used for the present study. The first database was the Quebec Health Survey of High School Students (QHSHSS) 2010–11 survey( 26 ), which provided data on students. It is a representative survey conducted by the Quebec Institute of Statistics (Institut de la statistique du Québec; ISQ) at the request of the Ministry of Health and Social Services (Ministère de la Santé et des Services Sociaux). It focuses on physical health and lifestyle habits, as well as on mental and psychosocial health. The target population consists of secondary-school students in public and private schools, both Francophone and Anglophone. The sampling of the participating schools was random, based on their health region and grade level, in proportion to their size, from all schools with students at each given grade level. Also, the sample was selected to be representative of the province as well as of each of the sixteen Quebec health regions participating in the self-administered computerized survey (two additional regions, Nunavik and Terres-Cries-de-la-Baie-James, were not included in this survey), with an additional sample being collected for eight of the selected health regions. Classes were then selected in each school for a given grade level based on a list for a standard social science course, resulting in a selection of multiple classes from the same school, in some instances. The sample consisted of 63 196 Quebec secondary-school students. The survey was administered in both French and English between November 2010 and May 2011 by more than forty ISQ interviewers in teams of two in 470 schools and 2651 classes. The participation of the students was on a voluntary basis. Confidentiality was ensured by the ISQ and data access was provided according to the ISQ confidentiality policy. Information on health (e.g. self-rated health, self-reported weight), lifestyle habits (e.g. physical activity, smoking, alcohol and drug use, sexual behaviour) and sociodemographics was collected for the participating students( Reference Pica, Traoré and Bernéche 27 ). A total of 32 000 (50·7 %) students provided responses regarding their lifestyle habits.
Two other databases were provided by the Quebec Ministry of Education, Recreation, and Sports (MELS), one containing the inventory and location of 374 public schools across Quebec in 2014 and another containing their level of socio-economic deprivation( Reference Pampalon, Hamel and Gamache 28 ) in 2009, based on the Canadian Census.
The fourth database was provided by the Quebec Ministry of Agriculture, Fisheries and Food (MAPAQ), containing data on functioning licences for each food establishment operating in the province of Quebec in 2009( Reference Lalonde and Robitaille 19 ). Three initial food categories described in the inventory were collapsed to create the fast-food outlet category: mobile food stands (i.e. food trucks that sell light food to be eaten at the location or to be taken away), take-out restaurants (i.e. establishments that prepare and sell food to be taken away or delivered) and quick-service restaurants (i.e. specialty-menu establishments with a service counter with or without tables, offering burgers, chicken, hot dogs). Data on the location of 4826 fast-food outlets were then extracted.
Procedures
We employed a sub-sample of 26 655 students enrolled in 374 public schools located across Quebec. We did not include students in private schools because data on the level of school socio-economic deprivation provided by the MELS were created for public schools only. We assembled a geographic information system (GIS) database in which we related individual-level information and built environment information characterizing the surroundings of each public school location. We also employed GIS to derive school access to fast-food outlets information, using the existing MAPAQ database of fast-food outlets in Quebec, as well as to derive information on the school urban/rural status, using Statistics Canada cartographic boundaries( 29 ) of population centres( 30 ), which represent urban concentrations with a population of ‘at least 1000 and a population density of 400 persons or more per square kilometre, based on the current census population count. All areas outside population centres are classified as rural areas’( 30 ).
Variables
Outcome variable
The outcome variable was frequency of JCL in the previous week, assessed using students’ responses to the following question: ‘During the previous week of school (Monday to Friday), how many times did you eat in a restaurant snack foods (such as French fries, poutine, burgers, pizza, pizza pockets, chicken wings, fried chicken, hot dogs, corn dogs) during lunchtime?’ Students’ responses were then dichotomized into: (i) ‘2 or more times’ (‘higher JCL’); and (ii) ‘0 or 1 time’ (‘lower JCL’). This cut-off was selected based on Laxer and Janssen’s work, building on previous research indicating that consuming junk food two or more times weekly is associated with a poorer health status among children( Reference Laxer and Janssen 16 , Reference Boutelle, Fulkerson and Neumark-Sztainer 31 – Reference Pereira, Kartashov and Ebbeling 33 ).
School-level variables
School environment variables included the school index of material deprivation, the school urban/rural status and the school index of access to fast-food outlets.
School deprivation
The school index of material deprivation provided by MELS is based on the Canadian Census, using information about families with children aged 0–18 years and about the students’ residential neighbourhoods. This index consists of two variables: mother’s low level of educational attainment and parental unemployment, which are strongly associated with children’s low educational achievement( Reference Baillargeon 34 ). The index was calculated for all public schools, ranging from 1 (low deprivation) to 10 (high deprivation). We then dichotomized the index into ‘less deprived’ (the three lowest deciles of deprivation) and ‘more deprived’ (the three highest deciles of deprivation).
School urban/rural status
The school urban/rural status was dichotomized into ‘rural’ and ‘urban’ schools. We considered all schools located inside population centres as urban schools and all schools located outside population centres as rural schools.
School access to fast-food outlets
School access to fast-food outlets was assessed as the number of fast-food outlets available within a street network distance buffer (i.e. a catchment area with a 750 m radius around the school location, based on the distance that approximates a 10 min walk for a secondary-school student) using the Network Analyst extension in ArcGIS 10.0 (ESRI, Redlands, CA, USA). A street network distance buffer is a surface delimited by distances measured along the available street networks in every direction from the location of the school (see Fig. 1). Students appear to conceptualize their schools’ surroundings( Reference Baillargeon 34 , Reference Gilliland, Rangel and Healy 35 ) based on a distance of approximately 750 m along street networks( Reference Seliske, Pickett and Rosu 36 , Reference Forsyth, Larson and Lytle 37 ), similar to a half-a-mile threshold used in other studies conducted in the USA( Reference Davis and Carpenter 22 , Reference Forsyth, Van Riper and Larson 38 , Reference Forsyth, Wall and Larson 39 ). School access to fast-food outlets was then dichotomized into ‘low access’ (‘access to 0 or 1 food outlets’) and ‘high access’ (‘access to 2 or more food outlets’).

Fig. 1 (colour online) Example of a 750 m street network distance buffer around a school
Individual-level variables
Sociodemographic variables included students’ sex and age (dichotomized into ‘13 years old or younger’ and ‘14 years old or older’), family status (categorized into ‘other’, ‘lone-parent’, ‘shared custody’, ‘reconstituted’ and ‘two-parent’), students’ perceived health status (categorized into ‘poor or fair’, ‘good’ and ‘very good or excellent’) and parental education (categorized into ‘less than high school’, ‘high school’ and ‘college- or university-level education’).
Analyses
We conducted a multilevel logistic regression analysis using the GLIMMIX procedure in the statistical software package SAS version 9.3 to investigate the association between school fast-food access and JCL, after controlling for covariates. We modelled the probability of students consuming junk food at lunch two or more times during the previous week, based on a binomial distribution, a logit link and on the Newton–Raphson optimization technique( 41 ), to account for the clustering of students within schools. The Newton–Raphson technique allows one to determine whether the variables included last have an additional contribution in explaining the outcome variable over and above the contribution of the variables already included in the model. The analysis consisted of four successive models. In Model A, we included only the random intercept (the null model), to account for any school-level effect. In Model B, we controlled for individual-level sociodemographic covariates (students’ sex, age, family status, students’ perceived health status and parental education), to investigate the extent to which school-level differences were explained by the characteristics of the students affiliated with each school. In Model C, we controlled for school-level covariates: we added the school index of material deprivation and the school urban/rural status in the analysis, to investigate whether the school-level differences were explained by differences in the school environment’s deprivation and urban/rural status. In Model D, we added the school access to fast food.
To partition the variance between the two levels of analysis (students and schools) and provide information on the role of the school clustering in a multilevel logistic regression analysis, we employed measures that assess clustering in the case of a binary outcome, such as the median odds ratio (MOR) index and the 80 % interval odds ratio (IOR) index( Reference Merlo, Yang and Chaix 42 , Reference Larsen and Merlo 43 ). To calculate the MOR, we first needed to consider all possible pairs of areas included in the sample and then perform calculations for each possible two students with similar covariates but attending two different schools. We then calculated the lowest and the highest odds of excess JCL for these two students and computed the odds ratios between the student with the higher odds of excess JCL and the student with the lower odds of excess JCL for this pair of students. After performing the calculations for all possible pairs of students attending different schools, we obtained a distribution of odds ratios and we further took the median value of this distribution, which represents the MOR index.
Therefore, the MOR index captures the change (in median) in the odds ratios for two students in two randomly selected schools, with all other covariates being maintained the same. Specifically, the MOR index was calculated using the formula:
 $${\rm MOR}\,{\rm =}\,{\rm exp}\left( {{\rm 0}{\rm \cdot 95{\times}}\sqrt {V_{{\rm s}} } } \right){\rm ,}$$
where V s is the school-level variance. A MOR of 1 indicates no variability in the probability of excess JCL (i.e. JCL of at least twice per week between schools) that can be attributed to the differences between schools. A large MOR value indicates a large difference in a student’s probability of excess JCL that can be attributed to the differences between schools( Reference Merlo, Yang and Chaix 42 , Reference Esser, Lack and Riedel 44 , Reference Halonen, Kivimäki and Pentti 45 ).
Proportional change in variance (PCV) was also calculated using the formula:
 $${\rm PCV}\,{\rm =}\,{{V_{{\rm s{\rm 1}}} {\rm {\hyphen}}V_{{\rm s{\rm 2}}} } \over {V_{{\rm s{\rm 1}}} }}{\rm {\times}100,}$$
where V s1 represents the school-level variance of the null model and V s2 represents the school-level variance of the model with all variables. A decrease in the school-level variance indicates that the model is explained in part by the variability in the JCL between the schools( Reference Esser, Lack and Riedel 44 ).
Results
Descriptive statistics
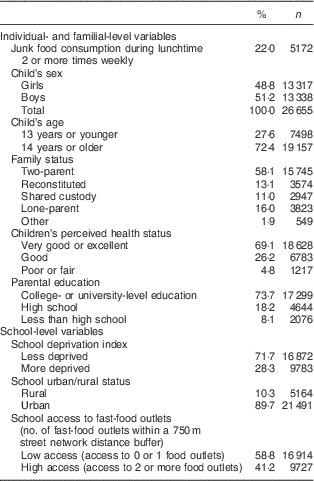
We found that 78 % of students reported lower JCL (0 or 1 times) and 22 % of students reported higher JCL (2 times or more) in the previous week. Table 1 illustrates the characteristics of the students, their families, as well as their school environments. The sample consisted of a similar proportion of boys (51·2 %) and girls (48·8 %), with a majority of the students being 14 years or older (72·4 %) and enjoying excellent self-rated health (69·1 %). More than half of the students had two-parent families (58·1 %) and only 8·1 % of the students had parents with educational attainment lower than high-school education. Almost one-third of the students attended a more deprived school (28·3 %) and the majority of the students (89·7 %) attended an urban school. Finally, about 40 % of the students had access to two or more fast-food outlets within 750 m of their school.
Table 1 Descriptive statistics (non-weighted variables) of the secondary-school students (n 26 655), their families, as well as their school environments, Quebec, Canada, 2010–2011
Results of the hierarchical analyses
Model A (Table 2) shows a high value of 2·31 for the MOR that indicates a significant between-school variability in student likelihood of excess JCL.
Table 2 Association between exposure to school fast-food outlet access and junk food consumption during lunchtime 2 or more times weekly among secondary-school students in Quebec, Canada, 2010–2011
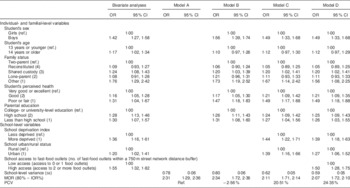
Ref., reference category; MOR, median odds ratio; IOR, interval for odds ratio; PCV, change in variance.
Model B shows a higher likelihood of JCL being associated with students’ individual characteristics, specifically with being a boy (OR=1·56; 95 % CI 1·39, 1·74), having a shared custody family (OR=1·20; 95 % CI 1·03, 1·39) or a family other than two-parent, reconstituted, shared custody and lone-parent (OR=1·73; 95 % CI 1·19, 2·52), being in good self-perceived health (OR=1·17; 95 % CI 1·05, 1·30), or poor or fair self-perceived health (OR=1·47; 95 % CI 1·18, 1·83). Also, Model B shows an association between a higher JCL and having parents with high-school education (OR=1·26; 95 % CI 1·11, 1·43) or with an educational attainment lower than high school (OR=1·31; 95 % CI 1·08, 1·60). The PCV in the odds of JCL across students (−2·56 %) and schools (100 %) can be attributed to the individual compositional covariates we included in Model B, suggesting that part of the clustering of JCL within schools is attributable the composition of the schools by students’ individual characteristics.
Model C shows that the school variables of urban/rural status and deprivation explained an important portion of the variability observed in the JCL between schools. The PCV coefficient was changed to 20·51 % between models A and C, indicating that school urban/rural status and deprivation explain 20 % of the variance in the JCL between schools. A higher likelihood of JCL of 2 times or more per week is associated with higher school deprivation (OR=1·44; 95 % CI 1·22, 1·71) and with urban school status (OR=1·39; 95 % CI 1·16, 1·66).
Model D shows that school fast-food exposure explained 3 % of the variance in the JCL between schools. The PCV coefficient changed to 24·35 % between models A and D, indicating that school urban/rural status, deprivation and fast-food exposure explain 24 % of the variance in JCL between schools. Students of schools with two or more fast-food outlets within 750 m (OR=1·50; 95 % CI 1·28, 1·75) have a higher likelihood of JCL of 2 times or more per week after controlling for student-, family- and school-level variables.
Discussion
The present study aimed to evaluate the association between school exposure to fast-food outlets within 750 m and JCL among secondary-school students attending public schools in the province of Quebec. We found that a higher access to fast-food outlets around school (of two or more outlets) within 750 m was associated with a higher JCL after controlling for variables characterizing the student (e.g. age, gender and perceived health), their families (family status and parental education) and their schools (school status and deprivation).
Other studies have also reported significant associations between the characteristics of the built environments around schools and youths’ nutrition; for instance, one study( Reference Smith, Cummins and Clark 46 ) found higher access to supermarkets to be associated with a healthier diet, while another study( Reference Seliske, Pickett and Rosu 36 ) found an association between the presence of food retailers near schools and the eating habits of young people during their lunch hour. Students aged 11–14 years in London, Ontario( Reference He, Tucker and Irwin 17 , Reference He, Tucker and Gilliland 47 ) were more likely to buy fast food and to have unhealthy diets if they attended schools with a higher access to fast-food outlets around schools.
Conversely, a systematic review( Reference Williams, Scarborough and Matthews 48 ) identified four studies finding no relationship between dietary outcomes and similar school food exposures in a similar age group as our sample( Reference Davis and Carpenter 22 , Reference Forsyth, Wall and Larson 39 , Reference An and Sturm 49 , Reference van der Horst, Timperio and Crawford 50 ). One US study( Reference Forsyth, Wall and Larson 39 ) looked at the frequency of eating from fast-food restaurants in the previous month in relation to outlet density within 800 m street network buffers with an extra 150 m buffer around the street network surrounding schools. Another US study( Reference An and Sturm 49 ) looked at the daily servings of fast food during the previous day in relation to the number of outlets within circular 800 m radius buffers. A third US study( Reference Davis and Carpenter 22 ) looked at fast-food consumption during the previous day in relation to school proximity within 800 m from at least one fast-food restaurant. The fourth study( Reference van der Horst, Timperio and Crawford 50 ), conducted in the Netherlands, looked at the daily soft drink and snack consumption in relation to the number of food outlets within a 500 m circular buffer around each school. These studies provided different results perhaps because the food environments differ between Canada and the USA and the Netherlands. Also, the use of different definitions and metrics for outcomes (i.e. the limitations surrounding the respondents’ subjective definition of a serving in one study, leaving room for interpretation( Reference An and Sturm 49 )) and food categories, as well as for exposures (the buffer construction; i.e. ‘sausage’( Reference Forsyth, Wall and Larson 39 ) v. circular( Reference An and Sturm 49 , Reference van der Horst, Timperio and Crawford 50 )), the potential inaccuracy in capturing exposures (e.g. presence of shortcuts/pathways that are usually not captured by GIS in assessing accessibility of locations), the different degrees of accuracy of databases (i.e. use of commercial databases more prone to error as opposed to use of a governmental listing), the likely differential lag between data collection and exposure data collection may explain differences in results.
Like other studies, we did not consider other food outlets (e.g. convenience stores, ethnic/specialty stores, supermarkets) where students may purchase sugar-sweetened beverages, potato crisps or other inexpensive junk foods. Presence of such outlets may have contributed to our findings, especially because 64 % of the public schools in Quebec have at least one convenience store within 750 m( Reference Lalonde and Robitaille 19 ). Future studies should consider more food sources to provide a better portrait of the food opportunities available around schools( Reference Lake, Burgoine and Greenhalgh 51 ).
Also, there may be other factors that could mitigate the effect of the food environment around schools, such as open/closed school policy (i.e. whether pupils are allowed to leave school premises during lunch breaks), safety of the school neighbourhood (i.e. presence of traffic-calming measures), school transportation models (i.e. whether students actively or passively commute to school) and school food environment policies (i.e. type of vending machine food, physical activity in schools). For instance, open/closed policy in schools is associated with higher fast-food consumption( Reference Forsyth, Wall and Larson 39 ). In Quebec, there are opportunities for children to acquire other types of food apart from the types of food available in their school’s immediate vicinity. Even though children may attend schools with higher access to unhealthy foods, they may engage in more walking and other physical activity if the school environment offers such opportunities or they may actively commute to school and/or to potentially healthier food outlets if such behaviours are encouraged. For instance, 51 % of public schools in Quebec have at least one recreational facility within 750 m, 35 % of the secondary schools have higher walkability surrounding environments within 750 m, and 43 % of public schools have at least one bike path within 750 m( Reference Lalonde and Robitaille 19 ). Also, because students in public schools in Quebec may leave school premises during lunch, it appears that using various transportation means may influence student’s dietary behaviours more than access to food outlets( Reference Williams, Scarborough and Matthews 48 , Reference An and Sturm 49 ). School boards offer school transportation services for students before, after school and at lunchtime to provide students with the opportunity to eat their meals at home( 52 ); eligibility includes children residing more than 1·4 km from the school for the English( 53 ) and 1·6 km for the French-language elementary schools( 54 ) in Montreal. In addition, the local and provincial governments in Quebec created partnerships for replacing actual travel modes with more active forms of transportation, such as the ‘On the Move to School’ programme or the BIXI bike-sharing programme in Montreal( 55 ).
Our results suggest that the food environments surrounding schools can be considered viable targets of intervention for improving nutrition among secondary-school students. We found a similar proportion for the fast-food outlets access of two or more outlets within 750 m around school (41·2 %) as recent studies, indicating a high level of exposure. Kestens and Daniel( Reference Kestens and Daniel 56 ) found a proportion of 50·4 % of schools having at least one fast-food outlet within 750 m in metropolitan Montreal, similar to the results of a study conducted in British Columbia which found 54 % of schools having at least one fast-food outlet within 800 m( Reference Black and Day 57 ). In Chicago, USA, 80 % of schools had at least one fast-food restaurant within 800 m( Reference Austin, Melly and Sanchez 58 ). Robitaille and colleagues( Reference Robitaille, Bergeron and Lasnier 20 ) found that 37 % of public schools in Quebec are located within 640 m from a fast-food outlet. In London, Ontario( Reference Gilliland, Rangel and Healy 35 ), 42 and 28 % of schools had two or more fast-food outlets within 500 m buffers, calculated based on Euclidean and street network distance, respectively. Another study( Reference Simon, Kwan and Angelescu 59 ) conducted in Los Angeles County, USA, found that 64·8 % of schools had at least one fast-food outlet within 800 m. In another US study( Reference Zenk and Powell 60 ) of more than 30 000 schools located in fifty states, 37·12 % of schools had at least one fast-food outlet within 805 m of the school.
Some potential directions of action are recommended. One direction involves using zoning to limit the presence of certain types of food outlets (e.g. fast-food outlets, convenience stores) around schools( 61 ); such zoning policies appear to improve availability of fruits and vegetables and favour healthy nutrition in communities( Reference Mayo, Pitts and Chriqui 62 ). Communities have limited power in taking such decisions in Quebec because the local legislation does not allow limiting the presence of certain commercial uses, even the ones that are deemed detrimental for health, such as certain chains of fast-food restaurants( Reference Bourdeau and LeChasseur 63 , Reference Paquin 64 ). However, the quality of the food options available around schools can be improved( Reference Paquin 64 ), because the urbanism legislation allows communities to limit the presence of certain commercial uses if they are considered incompatible with the local architectural context. Currently, there are three initiatives of the Public Health Agency of Quebec which aim to limit access to fast-food outlets around schools( Reference Allard 65 , 66 ).
Another direction would be improving the food options available around schools by limiting the menus available in restaurants to menus that provide healthier options only. In the USA, several interventions were implemented focusing on modifying food options of the existing fast-food establishments and convenience stores, by promoting food options with a higher nutritional value, while reducing the availability of food options with lower nutritional value. Such interventions indicated an increase in the offer, sale, promotion and knowledge about food with higher nutritional value( Reference Gittelsohn, Rowan and Gadhoke 67 ). However, banning certain types of restaurant on the basis of the menu offered( 68 ) is not allowed in Quebec, so even though municipalities and community organizations influence food environments in larger contexts (e.g. at the neighbourhood or at the city level), their influence on the school environments is limited( 68 ). Therefore, collaborative initiatives are necessary between schools and communities.
In addition to the built environment around schools, we found that students’ individual characteristics (sex, age and perceived health), familial characteristics (family status and parental education) and school characteristics (urban/rural status and deprivation) are associated with JCL. Thus, an integrative intersectoral approach focusing on individuals and environments, which cross-cuts sociocultural, economic and political dimensions, is necessary. Interventions could target individuals by offering cooking classes to improve the cooking and food preparation competencies of the youths and their families( Reference Day and Pearce 70 ). Also, because students of schools with higher deprivation appear to be more exposed to fast-food options( Reference Lalonde and Robitaille 19 , Reference Robitaille, Bergeron and Lasnier 20 , Reference Kestens and Daniel 56 , Reference Austin, Melly and Sanchez 58 , Reference Simon, Kwan and Angelescu 59 , Reference Day and Pearce 70 – Reference Walker, Block and Kawachi 73 ), interventions to support the creation and operation of low-cost restaurants that offer healthier and subsidized lunches (e.g. coupons) are necessary( Reference Bergeron and Paquette 74 ), particularly in school environments with high access to fast foods and high deprivation. Such interventions also need media support to help change the social norms around eating unhealthy food and raise awareness about the benefits of healthier lifestyles. These initiatives need to be informed by theoretically sound frameworks that involve all stakeholders (e.g. parents, students, teachers) to influence youths to eat their lunch in school, in cafeterias free of junk foods, as illustrated recently by Beaulieu and Godin( Reference Beaulieu and Godin 75 ). Most importantly, a coherent policy strategy for supportive built environments for healthy lifestyles is needed in Canada, to provide local planning authorities with instruments for developing the necessary legislative frameworks. This strategy needs to stipulate various tax incentives to support healthy eating as well as various constraints through zoning to limit access to fast-food outlets( Reference Raine, Muhajarine and Spence 76 ). It also needs to involve several legislative approaches, at the governmental (e.g. introduction of a junk food tax to help subsidize healthy foods, particularly among children from lower socio-economic status families; ban on trans fats), corporate (e.g. sponsoring healthy food campaigns) and school levels (e.g. banning junk food advertisements and sales in schools)( Reference Eisenberg, Atallah and Grandi 77 ). Even though there is strong support for more comprehensive school health policies focusing on the schools within their community context( Reference Raine, Muhajarine and Spence 76 ), there are only a few examples of rezoning to limit fast-food access in Canada, mostly in Quebec (e.g. a by-law implemented against drive-through around food outlets in residential areas in Montreal( 78 ), zoning by-law revision processes in Gatineau and in Lavaltrie, and a by-law implemented to restrict fast-food outlets in certain zones in Baie-Saint-Paul( 79 )).
Limitations and strengths
The current study has several limitations. It is a cross-sectional study that does not allow for establishing causality. Even though the self-reported measure of JCL is frequently used( Reference French, Story and Neumark-Sztainer 32 , Reference Larson and Story 80 ), this measure involves a certain degree of bias, with girls potentially underestimating and boys overestimating consumption. Our exposure measure (i.e. access to fast-food outlets) was collected in 2009, while our outcome measure (i.e. students’ junk food consumption) was collected in 2010–2011; thus the food environment may have changed in the year between data collection for exposure and outcome.
Also, data on the location of the food outlets may under- or overestimate their presence( Reference Liese, Colabianchi and Lamichhane 81 , Reference Paquet, Daniel, Kestens and Léger 82 ), but our use of MAPAQ data may reduce such a bias( Reference Cummins and Macintyre 83 ) because a government database is likely more accurate and more up-to-date than existing commercial directories, as shown recently( Reference Lake, Burgoine and Greenhalgh 51 ).
Finally, we only analysed food environments around schools, but future studies should also consider residential environments, within an activity space approach focusing on all environments that youths frequent daily( Reference Van Hulst, Barnett and Gauvin 18 , Reference Kestens, Lebel and Daniel 84 , Reference Larsen, Gilliland and Hess 85 ). However, such information was not available for the current study. Our study’s strengths include the use of a large representative sample for the province of Quebec and the use of hierarchical models that account for students’ enrolment in schools.
Conclusion
A large proportion of secondary-school students in Quebec are exposed to fast-food outlets within 750 m of schools, which was associated with junk food consumption at lunch of two or more times weekly. This indicates that the food environments around schools constitute a target for interventions that promote healthy eating among youths. Communities may use zoning instruments to limit the presence of certain types of food commerce around schools. Interventions can also target the food options available in existing food establishments to offer choices of greater nutritional value.
Acknowledgements
Acknowledgements: The authors would like to thank Johanne Laguë for reviewing an earlier version of this manuscript. Financial support: This study was possible by the financial contribution of the Ministry of Health and Social Services of Quebec. N.C. was supported by a Fellowship from the Research Centre of the University of Montréal Hospital Centre (CRCHUM) at the time of data analysis and writing of the manuscript. The funders had no role in the design, analysis or writing of this article. Conflict of interest: Authors declare no financial or non-financial competing interests. Authorship: All authors contributed equally to the study design and analyses. B.L. and E.R. created the spatial measures. I.T. conducted the statistical analyses with input from all authors. N.C. and E.R. drafted the initial form of the manuscript. All authors commented the manuscript draft. Ethics of human subject participation: This study was conducted according to the guidelines laid down in the Declaration of Helsinki and all procedures involving human subjects/patients were approved by the Institute of Statistics of Quebec’s Ethics Committee, led by Pierre Durand (the Ethics Committee’s president). Written informed consent was obtained from all survey participants.


