


Koreans used to live by a typical traditional concept of family; however, rapid industrialization and modernization have caused family disorganization over the last several decades. This phenomenon has resulted in a shift in Korea’s family structure to not only nuclear families, but also single-person households. In particular, the proportion of single-person households has been increasing over recent decades. Single-person households accounted for 15·5 % of the total Korean population in 2000, 23·9 % in 2010 and 27·2 % in 2015, and it is expected to increase to 33·3 % in 2030( 1 ). In accordance with social atmosphere changes, people’s eating patterns have also been changing.
One example of this change is the fewer number of people having family dinner. In the past, family meals were considered important( Reference Wang, Shen and Wang 2 ). However, the percentage of people having family dinner has decreased continuously, from 76·1 % in 2005 to 64·9 % in 2014( 3 ). As a result, a novel dining trend has emerged, with a substantial increase in people who eat alone rather than with others. Over 75 % of those who live alone reported eating dinner alone; approximately 52 % ate all three meals alone( Reference Lee 4 ). Furthermore, a survey reported that even 20·9 % of non-single-member households ate meals alone. Considering the health benefits of commensality, this trend may present some worrisome risks of damaging people’s health.
Commensality can influence not only mental health( Reference Lee, Park and Ju 5 ) but also diet and eating patterns. In fact, several studies have reported that sharing meals can positively affect weight or BMI( Reference Fulkerson, Larson and Horning 6 ). In practice, a study has shown that eating patterns differ among groups with different BMI( Reference Lee, Cho and Oh 7 ). Specifically, having meals as a family increases the individual’s intake of fruits and vegetables and reduces the consumption of sugar-sweetened beverages, as well as boosts the individual’s intake of a variety of vitamins/minerals and reduces the consumption of nutrient-poor foods( Reference Martin-Biggers, Spaccarotella and Berhaupt-Glickstein 8 – Reference Fulkerson, Larson and Horning 11 ). On the contrary, eating alone has been reported to have negative effects on health, such as low food diversity or higher energy intake that could lead to obesity (BMI≥30·0 kg/m2) or overweight (BMI≥25·0 kg/m2)( Reference Hammons and Fiese 10 , Reference Chekroun and Brauer 12 ).
The global incidence of obesity and overweight has been increasing over the past few decades and these remain the ever-rising global health concerns. A previous study reported that approximately 2 billion adults are overweight worldwide, among which 650 million are obese( 13 ). In South Korea, the incidence of overweight and obesity in adults has increased steadily from 26·0 % in 1998 to 33·2 % in 2016( 14 ). Naturally, overweight and obesity have become major health burdens in many countries, leading to about 3 million deaths worldwide every year and loss of 35 million disability-adjusted life years( 15 ). Research on factors related to obesity is crucial for its prevention. Since obesity is caused by various factors and eating patterns, it is important to investigate the possible consequences of eating alone to prevent overweight and obesity.
In the current study, we investigated the association between having a dinner companion and BMI. Of the three meals, we found that dinner would be the most suitable for our study for the following reasons: (i) a greater number of people skipped breakfast; and (ii) the percentage of people who ate lunch with family was lower than those who consumed the other two meals with family. Therefore, we decided to examine the benefits of having dinner companions for further research.
Methods
Study population
We used data from the Korean National Health and Nutrition Examination Survey VI (KNHANES VI). KNHANES is a nationwide cross-sectional study that has been performed in Korea since 1998. KNHANES VI is a rolling sample survey that was executed by the Korea Centers for Disease Control and Prevention from 2013 to 2015. KNHANES uses a complex study design, with multistage probability samples. To obtain data, physical examinations and household interviews were conducted. A written informed consent was obtained from all survey participants. The survey was approved by the Institutional Review Board of the Korea Centers for Disease Control and Prevention (2013-07CON-03-4C, 2013-12EXP-03-5C). A total of 22984 individuals participated in the survey. We excluded those who had fewer than two dinners per week on average, since the data on whether they usually dined alone or with others were unavailable. Individuals aged below 20 years were excluded. Additionally, we excluded individuals with missing data. Finally, a total of 13303 individuals were included in the present study (Fig. 1).
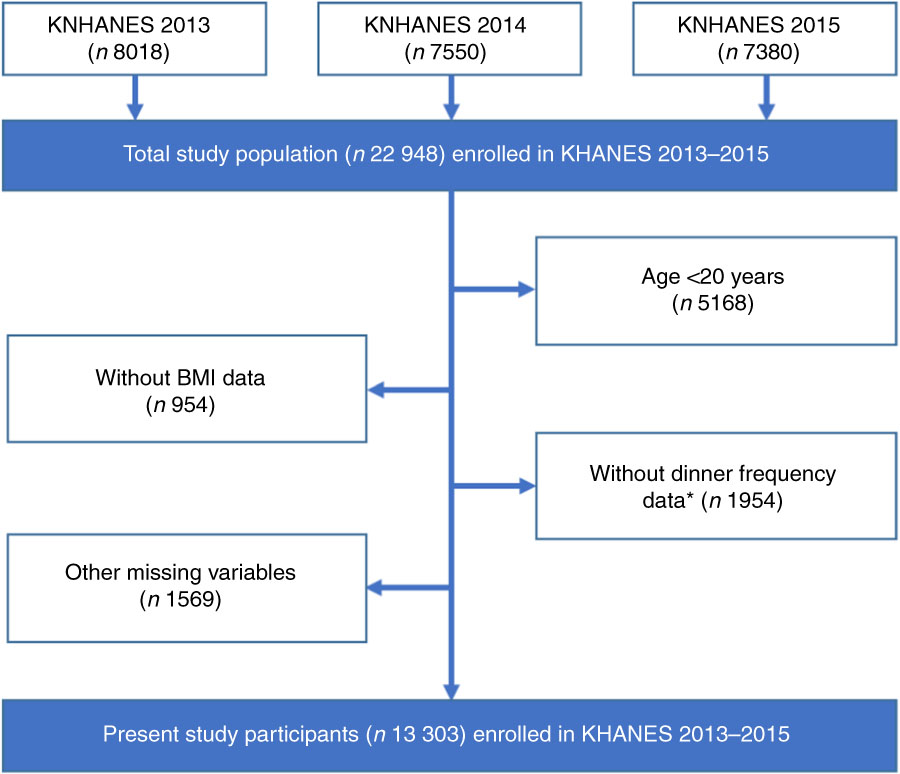
Fig. 1 (colour online) Flowchart showing selection of the present study participants from those enrolled in the Korean Health and Nutrition Examination Survey (KHANES VI, 2013–2015). *Dinner frequency data are essential to move to the question about dinner companion
Variables
The dependent variable in the present study was BMI, which was used to diagnose overweight and obesity. BMI was computed as weight/height2 (kg/m2). In KNHANES VI, the height and weight of the participants were measured by professional investigators using mobile examination vehicles.
Our primary independent variable was dinner companion. Data were collected through individual interviews conducted by nutrition investigators who visited the participants’ households. The interviewers asked the following question: ‘Over the past year, how many times a week did you eat dinner?’ Possible choices were as follows: ‘5–7 times a week’, ‘3–4 times a week’, ‘1–2 times a week’ and ‘almost none (0 time)’. Respondents who ate dinner at least three times per week were asked: ‘When eating dinner over the past year, did you generally eat with others?’ We coded those who replied ‘No’ as eating alone. For those who replied ‘Yes’, we asked another question: ‘In general, who did you eat dinner with?’ We labelled those who answered ‘Family’ as family and those who answered ‘People other than family’ as non-family.
We controlled for several covariates in accordance with previous studies. Our covariates comprised age, household income, marital status, living alone, education level, occupation, average sleep time, average sedentary time, frequency of eating out, smoking and alcohol consumption frequency. Household income was measured in quartiles. Marital status was divided into married, widowed, divorced and unmarried. We separated people who live alone based on the number of household members. Education level was classified as follows: middle school or less; high school; and college or a higher degree. Occupation was recategorized into the following four groups according to the International Standard Classification of Occupations codes: white collar (managers, office clerks and related professionals); pink collar (service and sales workers); blue collar (skilled agricultural, forestry and fishery workers, crafts and related workers, equipment/machine operating and assembling workers, and elementary workers); and unemployed. Military personnel were excluded from the study. Average daily sleep time was split into four levels: <6 h, 6–7 h, 7–8 h and >8 h. Average sedentary time was defined as time spent sitting or lying except when sleeping and was divided into three groups: <5 h, 5–9 h and >9 h. Frequency of eating out was categorized into four groups: ‘once a day or more’, ‘3–6 times a week’, ‘1–2 times a week’ and ‘less than once a week’. Smoking was coded into current smoker, past smoker and never smoker. Alcohol consumption frequency over the past year was divided into four groups: never, once/month or less, 2–4 times/month and twice/week or more.
Statistical analyses
We investigated the general characteristics of our study population. Means and sd of BMI were compared using Student’s t test and ANOVA. Stepwise regression was conducted to select covariates. For conducting stepwise regression, we selected dinner companion, age, gender, household income, marital status, living arrangement, educational level, occupation, working hours per week, average sleep hours per day, average sedentary hours per day, eating out frequency, smoking status, total energy intake, alcohol consumption frequency and survey year. Based on stepwise regression, dinner companion, age, gender, household income, marital status, education, sleep hours, sedentary hours, total energy intake and survey year were selected; living arrangement, occupation, working hours per week, eating out frequency, smoking status and alcohol consumption frequency were excluded. Even though living arrangement, occupation, smoking status and alcohol consumption frequency were not selected based on stepwise regression, we additionally included those variables in the model because they could be associated with BMI as reported in previous studies( Reference Drewnowski, Moudon and Jiao 16 , Reference Sayon-Orea, Martinez-Gonzalez and Bes-Rastrollo 17 ). A multiple linear regression model was used to evaluate the effects of dinner companion on BMI, adjusted for covariates. Lastly, a set of subgroup analyses was conducted by socio-economic variables: age, gender, household income, educational level and occupation. Differences in socio-economic status and lifestyle patterns have been associated with changes in BMI( Reference Sánchez-Vaznaugh, Kawachi and Subramanian 18 ). Thus, we conducted subgroup analyses by socio-economic variables to observe any independent association between having a dinner companion and BMI after controlling for covariates. The survey samples’ weights and complex survey design were accounted for in all statistical analyses( Reference Lee, Kim and Oh 19 ). All statistical tests were two-sided and calculated P values of <0·05 were considered significant. All statistical analyses were performed using the statistical software package SAS version 9.4.
Results
The general characteristics of our study population are shown in Table 1. The mean BMI was 23·75 (sd 0·04) kg/m2 for 13303 participants. Of those participants, 62·26 % (n 8553) usually ate dinner with family, 14·43 % (n 1501) ate dinner with non-family members and 23·30 % (n 3249) usually ate dinner alone. The family dinner group had the lowest BMI (23·62 (sd 0·05) kg/m2), whereas the solo eating group had the highest BMI (24·05 (sd 0·08) kg/m2).
Table 1 General characteristics of the study population of Korean adults, aged 20 years or over, from the Korean Health and Nutrition Examination Survey VI (2013–2015)Footnote *

* Complex study design, including survey weights, was considered.
Table 2 shows the association between having a dinner companion and BMI, based on a multiple linear regression model that was adjusted for covariates. The family dinner group was more likely to have a lower BMI (β=−0·39, P<0·01) than the solo eating group (reference group), but the non-family dinner group did not show a significant association (β=−0·06, P=0·67). Additionally, the lowest income group was more likely to have a higher BMI than the highest income group (β=0·30, P=0·04). With regard to educational level, the group who finished middle school or attained a lower educational level showed higher BMI than those who attained college or achieved a higher educational level (β=0·86, P<0·01).
Table 2 Linear regression results regarding the association between dinner companion and BMI among Korean adults, aged 20 years or over, from the Korean Health and Nutrition Examination Survey VI (2013–2015)Footnote *

Ref., reference category.
* Complex study design, including survey weights, was considered.
We performed subgroup analyses stratified by age, gender, household income, educational level and occupation (Table 3). With regard to gender, male participants who had dinner with family (β=−0·56, P<0·01) or with others (β=−0·41, P=0·04) showed a lower BMI compared with the solo eating group, whereas female participants showed a significant association only among the family dinner group (β=−0·31, P=0·01). For those aged 20–29 years, the family dinner group showed significantly lower BMI compared with the solo eating group (β=−1·15, P<0·01). For those aged 30–39 years, the family dinner group had lower BMI than the solo eating group (β=−0·78, P=0·01). Likewise, for those aged 70 years or over, the family dinner group showed a lower BMI than the solo eating group (β=−0·74, P=0·01). There was no significant difference in BMI between the family dinner group and the solo eating group in any of the other age groups. The non-family dinner group showed significantly different BMI compared with the solo eating group, but this difference was observed only in the group of participants aged 20–29 years (β=−1·03, P=0·01). Non-family dinner had no effect on BMI in any other subgroups.
Table 3 Subgroup analyses for the effect of having dinner companions on BMI, stratified by age, gender, household income, educational level and occupation, according to multiple linear regression model, among Korean adults, aged 20 years or over, from the Korean Health and Nutrition Examination Survey VI (2013–2015)Footnote *

Ref., reference category.
* Complex study design, including survey weights, was considered. The results were adjusted for covariates used in Table 2.
Discussion
In the present study we examined the association between commensal dinner and BMI among Korean adults. The results showed that those who usually have dinner with family were more likely to have a lower BMI compared with those who eat alone. Our subgroup analyses showed that the association was greater in males than in females, and in the younger age groups (people in their 20s and 30s).
Our main finding was that the family dinner group had significantly lower BMI compared with the solo eating group. Several factors could have contributed to these results. First, people who eat with family are more likely to eat dinner on a regular basis( Reference Neumark-Sztainer, Story and Ackard 20 ), which may reduce their BMI. Studies have shown that regular meals could contribute to lower weight with increased metabolism and energy expenditure( Reference Farshchi, Taylor and Macdonald 21 ). Second, family meals are more likely to consist of healthy foods. Studies have reported that people tend to eat more fruits and vegetables when they eat with family, in addition to having increased food diversity( Reference Welsh, French and Wall 22 , Reference Berge, MacLehose and Loth 23 ). In practice, a study has shown that eating dinner with family is linked to higher nutritional scores( Reference van Lee, Geelen and Hooft van Huysduynen 24 ). Additionally, people are more likely to eat processed foods when eating alone, which may cause excessive intakes of saturated fat, sugar and sodium( Reference Poti, Mendez and Ng 25 ). Third, different eating habits of eating alone and eating with others may have contributed to our results. People tend to eat faster when they eat alone, which results in higher energy intake and increased risk of obesity( Reference Zhu, Haruyama and Muto 26 ). Moreover, people may use media devices more when eating alone, which is known to have negative dietary consequences( Reference Moray, Fu and Brill 27 ). Due to these reasons, people who eat alone would more likely have a higher BMI than those who have family dinners.
Besides dinner companion, age, household income, marital status, educational level, sleep hours and sedentary hours showed a significant association with BMI. Our study showed that people in the lower income groups will more likely show a higher BMI than those in the higher income groups. These results are in line with those reported in a previous study which showed that low socio-economic status can be a barrier to physical activity and healthy eating( Reference Janssen, Boyce and Simpson 28 ). With regard to sleeping hours, people who have fewer sleeping hours are more likely to show a higher BMI. Several studies have suggested that people with insufficient sleep had higher appetite for foods with higher levels of carbohydrates and fat( Reference Spiegel, Tasali and Penev 29 , Reference Taheri, Lin and Austin 30 ), which could be related to overweight or obesity. Concerning sedentary hours, increasing sedentary behaviour could be associated with obesity by lowering physical activity energy expenditure( Reference Levine, Lanningham-Foster and McCrady 31 , Reference Pate, O’Neill and Lobelo 32 ).
Our subgroup analysis showed that the association between having a dinner companion and BMI varied significantly among different age groups and gender. With regard to age group, family dinner and non-family dinner were associated with BMI in individuals aged 20–29 years, 30–39 years and 70 years or older, while non-family dinner was non-significant in all age groups except those aged 20–29 years. This may be closely related to prior reports on the negative association between family meals and BMI in children and adolescents. When eating alone, young people generally buy more home meal replacements( 33 ) and eat out more( Reference Kim 34 ). As these foods contain inadequate nutrients and a high amount of energy, young generations are more susceptible to unhealthy diet, resulting in a higher BMI. Moreover, older adults aged 70 years or more showed higher BMI when they ate dinner alone. According to a study conducted in Japan, eating alone was associated with unhealthy dietary behaviours in older adults, and such behaviours could lead to overweight or obesity( Reference Tani, Kondo and Takagi 35 ).
Interestingly, our study revealed a stronger association between family dinner and BMI in males, which contradicts the findings of previous studies showing that such association was significant only in females( Reference Neumark-Sztainer, Larson and Fulkerson 36 , Reference Goldfield, Murray and Buchholz 37 ). This result could be supported by different attitudes towards eating patterns or behaviours according to gender. Since men who have dinner alone need to prepare the food themselves, it leads to poor dietary habits including low intake of fruits or vegetables and meal skipping( Reference Conklin, Forouhi and Surtees 38 ). Furthermore, men tend to consume unhealthy foods, including fast foods, when they eat alone. Therefore, such food choices could be related to obesity( Reference Conklin, Forouhi and Surtees 38 ).
The present study had several limitations. First, we had to exclude people who had fewer than two dinners per week on average from our study, due to the unavailability of data regarding their dinner companions. Second, we could not obtain the exact number of times each of the participants dined with family, with non-family or alone. We used the data on who they usually dined with, which may have been insufficient to characterize their eating patterns. Therefore, individuals within the same group may depict far different eating patterns. Third, not all covariates may have been included in our study. Furthermore, since we used cross-sectional data for our study, it was difficult to establish a cause-and-effect relationship between dinner companion and BMI.
Conclusion
Our study indicates that people who eat dinner alone or with non-family members are more susceptible to weight gain than those who usually have dinner with family, especially in younger generations. This is a worrying trend, considering the prevalence of single-person households and solo eating in young generations. Thus, appropriate health interventions are required as overweight and obesity during adolescence often persist throughout life, leading to massive costs for both the individual and society. Therefore, careful health management for people who eat alone, as well as those living alone, is needed.
Acknowledgements
Acknowledgements: The authors thank colleagues from the Department of Public Health at Yonsei University Graduate School who provided advice for this manuscript. Financial support: This research received no specific grant from any funding agency in the public, commercial or not-for-profit sectors. Conflict of interest: The authors declare no conflict of interest. Authorship: W.R. and J.S. contributed equally to this work. W.R. designed the study and performed statistical analyses. J.S. helped with the literature review. E.-C.P. took part in designing study. S.A.L. and S.-I.J. helped supervise the entire process. All authors read and approved the final manuscript. Ethics of human subject participation: The KNHANES VI was conducted according to the guidelines laid down in the Declaration of Helsinki and all procedures involving human subjects were approved by the Korea Centers for Disease Control and Prevention (2013-07CON-03-4C, 2013-12EXP-03-5C). Written informed consent was obtained from all subjects.


