


Non-alcoholic fatty liver disease (NAFLD) is a hepatic clinicopathologic disorder that is histologically similar to alcoholic liver disease, but occurs in the absence of excessive alcohol consumption or alternative causes of hepatic fat accumulation. NAFLD is usually diagnosed with an imaging-based technology or a blood-based biomarker test and is characterised by excessive fat accumulation and persistent abnormal enzyme catalytic activities in the liver. A number of metabolic syndromes, such as obesity, diabetes, hypertension and insulin resistance, have been linked to NAFLD, which may contribute/promote its progression to cirrhosis, liver failure and hepatocellular carcinoma(Reference Neuschwander-Tetri and Caldwell1–Reference Ong and Younossi3). As a leading cause of chronic liver disease worldwide, the global prevalence of NAFLD was estimated to be around 24 %. In the USA, over 30 % of the population is affected by NAFLD(Reference Heron4–Reference Isokuortti, Zhou and Peltonen6).
High dietary Na intake has been widely reported to be associated with elevated blood pressure (BP)(Reference Stamler, Chan and Daviglus7), an increased risk of CVD(Reference Strazzullo, D’Elia and Kandala8), insulin resistance(Reference Ogihara, Asano and Ando9,Reference Fonseca-Alaniz, Takada and Andreotti10) and overweight/obesity(Reference Ma, He and MacGregor11–Reference Zhou, Stamler and Chan13). The linkage between Na intake and NAFLD was established by a few studies. Through a large population-based evaluation performed in Korea, Huh et al.(Reference Huh, Lee and Lim14) demonstrated that high Na intake is independently associated with an increased risk of NAFLD and advanced liver fibrosis, while Choi et al.(Reference Choi, Lee and Chang15) found that higher Na intake is associated with a greater prevalence of NAFLD in young and middle-aged asymptomatic adults. However, the relationship between Na intake and NAFLD has not yet been evaluated in the US population. In the current study, utilising data from the National Health and Nutrition Examination Survey (NHANES) (2007–2014), we explored the relationship between dietary Na intake estimated from two timed 24-h dietary recalls and NAFLD defined by the hepatic steatosis index (HSI) and the fatty liver index (FLI) in US adults.
Methods
Study population
The data utilised in the current study were collected from NHANES. NHANES is a programme that administers ongoing cross-sectional surveys conducted by the National Center for Health Statistics (NCHS), which is a part of the Centers for Disease Control and Prevention (CDC). A major objective of NHANES is to estimate the number and percentage of people in the USA, and in designated subgroups, with selected diseases and risk factors(16). In total, 40 617 individuals completed the interviews in the NHANES 2007–2014 cohort (10 149 in NHANES 2007–2008, 10 537 in NHANES 2009–2010, 9756 in the NHANES 2011–2012, and 10 175 in the NHANES 2013–2014). Participates who met the following conditions were excluded: (1) age <20 years (n 17 135); (2) dietary data considered unreliable if the total energy intake from any 24-h recall was <2092 or >20 920 kJ/d for women, and <2092 or >33 472 kJ/d for men (n 5448); (3) any special diet for medical reasons, weight loss or other purposes was employed during the investigation (n 2740); (4) pregnant women (n 185); (5) heavy alcohol drinking as defined by >21 drinks per week in men and >14 drinks per week in women (n 2784)(Reference Kim, Kim and Adejumo17); (6) serum hepatitis B surface antigen (HBsAg) or serum hepatitis C antibody were positive (n 233). In addition, we excluded 1070 subjects whose BMI, BP, HbA1c, serum alanine aminotransferase (ALT), aspartate aminotransferase (AST) or total cholesterol (TC) data were not available. Thus, a study population of 11 022 participants was included in the HSI-defined NAFLD analysis. As FLI requires fasting blood tests, a subsample of 5320 participants was included in the FLI-defined NAFLD analysis. A detailed flowchart depicting participant selection is shown in Fig. 1.
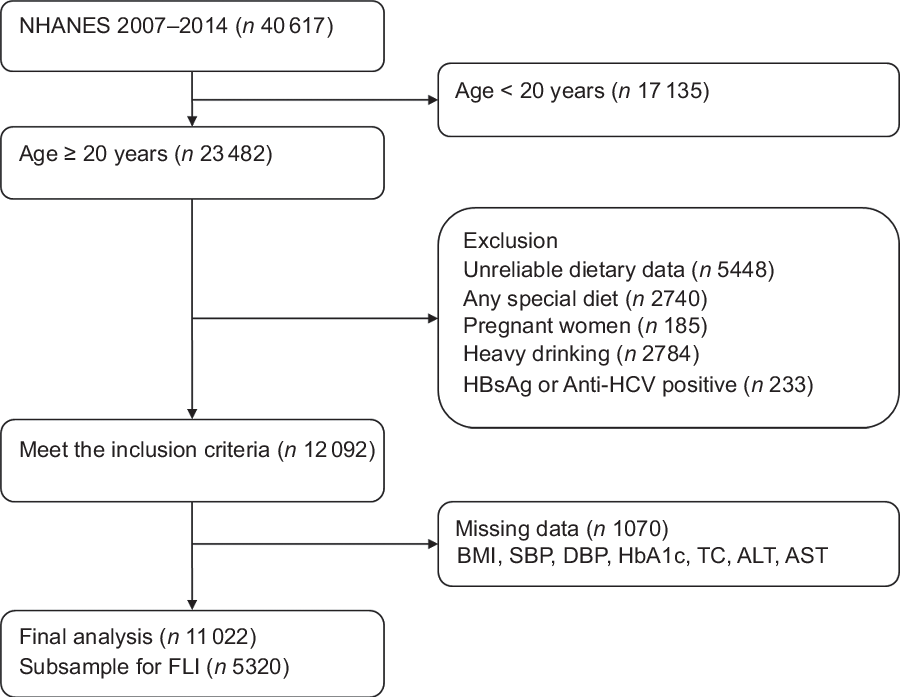
Fig. 1 Flowchart of participant selection
Data collection
Data were collected during interviews in the participants’ homes and through medical examinations and subsequent laboratory assessments in the mobile examination centre (MEC). The NHANES interviews were completed by trained interviewers in participants’ homes using a computer-assisted personal interview system. The questionnaire contained a number of questions on demographics, health conditions and lifestyles such as smoking, drinking and physical activity.
The NHANES 2007–2014 ethnicity variable included Mexican American, other Hispanic, non-Hispanic White, non-Hispanic Black and other races. To facilitate analysis, we merged Mexican American and other Hispanic into one group (Hispanic). The 2007–2014 Department of Health and Human Services’ (HHS) poverty guidelines were used to calculate family monthly poverty level index by dividing family income by the poverty guidelines, specific to family size as well as the appropriate year and state. The index was then grouped into three categories (≤1·30, 1·31−1·85 and >1·85), and we used the family monthly poverty level category as the house income variable in the present analysis.
With respect to lifestyle variables, smoking status was categorised into current, former and never smoker according to participants’ answers. Participants who drank alcohol at least twelve times in the previous year were defined as drinkers. For physical activity, metabolic equivalent (MET)-h/week was calculated with the formula: (MET-h/week = d × duration × MET level).
Body weight (kg) was measured using a digital weighing scale, and standing height (cm) was measured using a stadiometer. BMI was calculated using the formula: weight (kg)/(height [m])2. Waist circumference (WC) was measured to the nearest 0·1 cm at the end of the participant’s normal expiration using a tape by the standard method. For BP measurement, the participants were asked to sit in a height-adjustable office-style chair. BP readings may begin after the participant has been seated and resting quietly for at least 5 min. The mean of three systolic and diastolic BP readings was used in the analysis. Hypertension was defined as a systolic BP ≥140 mmHg or a diastolic BP ≥90 mmHg, and/or current use of antihypertensive medication.
The dietary interview component, called What We Eat in America (WWEIA), is conducted as a partnership between the US Department of Agriculture (USDA) and the US Department of Health and Human Services (DHHS). Under this partnership, DHHS’ National Center for Health Statistics is responsible for survey sample design and all aspects of data collection, and USDA’s Food Surveys Research Group (FSRG) is responsible for dietary data collection methodology, maintenance of databases used to code and process the data, and data review and processing(16). NHANES participants are eligible for two 24-h dietary recall interviews. The first dietary recall interview was collected face-to-face in the MEC, and the second interview was collected via telephone 3–10 d later. Dietary intake was estimated as a mean of the two dietary recalls. Energy-adjusted dietary Na intake (mg per 8368 kJ) was used as the main exposure variable. Total energy, dietary protein, SFA, PUFA, cholesterol and total sugar intakes were included as potential confounding factors in the analysis.
Laboratory tests and clinical definitions
Serum ALT was measured by a kinetic rate method. AST and gamma-glutamyl transferase (GGT) were measured by enzymatic rate methods. HbA1C was measured by HPLC, and we defined diabetes as HbA1c ≥6·5 % and/or current treatment with a hypoglycaemic agent or insulin. The laboratory method used for TAG and TC measurement were enzymatic assays. We defined hypercholesterolaemia on the basis of TC ≥6·2 mmol/l or current medication use.
Definition of NAFLD
NAFLD was defined using HSI and FLI, both of which have been validated externally and used in epidemiologic studies, in the absence of other causes of chronic liver disease(Reference Kim, Kim and Adejumo17–Reference Meffert, Baumeister and Lerch20).
HSI was calculated using the published formula: HSI = 8 × (ALT/AST ratio) + BMI (+2, if female; +2, if diabetes).
NAFLD was defined as HSI >36 according to a previous publication(Reference Lee, Kim and Kim18).
FLI was calculated with the following formula: FLI = (e0·953 × loge (TAG) + 0·139 × BMI + 0·718 × loge (GGT) + 0·053 × WC – 15·745)/(1 + e0·953 × loge (TAG) + 0·139 × BMI + 0·718 × loge (GGT) + 0·053 × WC – 15·745) × 100.
NAFLD was defined as FLI ≥60 in accordance with a previous publication(Reference Bedogni, Bellentani and Miglioli19).
Statistical analysis
Data are presented as mean ± sd or median (P25, P75) for continuous variables, and as percentages for categorical variables. We tested differences in characteristics between groups with one-way ANOVA or Wilcoxon rank-sum test for continuous variables according to whether the continuous variable was normally distributed, and with χ 2 test for categorical variables. The OR and 95 % CI of the second, third and fourth quartiles of Na intake were estimated using multivariate non-conditional logistic regression models that used the first quartile as the reference. To test for trends, we calculated the median amount of Na intake in each quartile, and then modelled these median values as a continuous variable in all models. Potential covariates such as age, sex, ethnicity, education levels, family monthly poverty level categories, metabolic equivalent, smoking status, drinking status, total energy, dietary protein, SFA, PUFA, cholesterol and total sugar intakes were included in the multivariate models. Considering that some metabolic-related variables may share their aetiology with NAFLD, and that they may play a mediating role in the relationship between Na intake and NAFLD, we further adjusted for BMI, hypertension, hypercholesterolaemia and diabetes separately. We also conducted subgroup analyses according to age group, sex and ethnicity. A two-tailed P value <0·05 was considered statistically significant. All analyses were performed using SAS, version 9.4 (SAS Institute).
Results
Data from 11 022 participants (5293 men and 5729 women) with a mean age of 51·7 ± 17·6 years were analysed in the current study. The mean energy-adjusted dietary Na intake of the participants was 3370·4 ± 841·3 mg/d. The prevalence of NAFLD as defined by HSI was 52·6 %, and the prevalence of NAFLD as defined by FLI was 40·1 %. The characteristics of the population according to the quartile categories of energy-adjusted Na intake are shown in Table 1. Overall, participants with a high relative intake of Na were more likely to be men, other races or diagnosed with hypertension or diabetes. No significant differences were found in age, drinking status and serum ALT or AST levels.
Table 1 Characteristics of the study population according to quartile categories of energy-adjusted sodium intake (NHANES 2007–2014)

MET, metabolic equivalent; ALT, alanine aminotransferase; AST, aspartate aminotransferase.
The prevalence and adjusted OR with 95 % CI for NAFLD according to the quartile categories of Na intake are shown in Table 2. The prevalence of NAFLD as defined by HSI in the first, second, third and fourth quartile was 47·8, 52·8, 55·2 and 54·7 %, respectively. The prevalence of NAFLD as defined by FLI in these four categories was 36·5, 39·6, 40·8 and 43·3 %, respectively. Multivariate-adjusted logistic regression models showed a positive association between Na intake and NAFLD after adjusting for age, sex, ethnicity, education levels, family monthly poverty level categories, metabolic equivalent, smoking status, drinking status, total energy, dietary protein, SFA, PUFA, cholesterol and total sugar intakes. Compared with the lowest quartile of Na intake, the highest quartile had a multivariate-adjusted OR and 95 % CI of 1·46 (1·29, 1·65) for NAFLD as defined by HSI, and 1·41 (1·18, 1·69) for NAFLD as defined by FLI.
Table 2 Prevalence and adjusted OR with 95 % CI for non-alcoholic fatty liver disease (NAFLD) according to the quartile categories of sodium intake*

FLI, fatty liver index; HSI, hepatic steatosis index.
* OR (95 % CI) was calculated by logistic regression models.
† Model 1 was adjusted for age and sex.
‡ Model 2 was adjusted for variables in model 1 plus ethnicity, education levels, family monthly poverty level categories, metabolic equivalent, smoking status, drinking status and total energy intake.
§ Model 3 was adjusted for variables in model 2 plus dietary protein, SFA, PUFA, cholesterol and total sugar intakes.
Considering that some metabolism-related variables may play a role in modulating the relationship between Na intake and NAFLD, we further adjusted for several metabolic-related parameters, including BMI, hypertension, hypercholesterolaemia and diabetes, separately. We found that the relationship between Na intake and NAFLD as defined by HSI was somewhat attenuated but remained significant after the adjustment. Similar results were found for NAFLD as defined by FLI in addition to the case where BMI was included in the model (Table 3).
Table 3 OR with 95 % CI for non-alcoholic fatty liver disease (NAFLD) according to the quartiles of sodium intake after adusting for several intermediate variables separately*

FLI, fatty liver index; HSI, hepatic steatosis index.
* OR (95 % CI) was calculated by logistic regression models.
† Estimates obtained with model 3 as shown in Table 2.
The adjusted OR with 95 % CI for NAFLD comparing the highest with the lowest quartile of Na intake stratified by demographic characteristics are presented in Fig. 2. The relationship between Na intake and NAFLD was consistent throughout the whole population, and was not affected by sex or age.

Fig. 2 OR with 95 % CI for non-alcoholic fatty liver disease (NAFLD) comparing the highest with the lowest quartile of sodium intake stratified by demographic characteristics. Sex subgroups were adjusted for age, ethnicity, education levels, family monthly poverty level categories, metabolic equivalent, smoking status, drinking status, total energy, dietary protein, SFA, PUFA, cholesterol and total sugar intakes. Age subgroups were adjusted for age, sex, ethnicity, education levels, family monthly poverty level categories, metabolic equivalent, smoking status, drinking status, total energy, dietary protein, SFA, PUFA, cholesterol, and total sugar intakes. Ethnicity subgroups were adjusted for age, sex, education levels, family monthly poverty level categories, metabolic equivalent, smoking status, drinking status, total energy, dietary protein, SFA, PUFA, cholesterol and total sugar intakes. The quartile of Na intake in each subgroup was calculated separately
Discussion
In this cross-sectional study conducted on a nationally representative sample of US adults, we found that a higher Na intake was independently associated with NAFLD as defined by both HSI and FLI after adjusting for a variety of confounding factors including demographics, lifestyle and dietary nutrients intake. This association was somewhat attenuated but remained significant even after adjusting for BMI, hypertension, hypercholesterolaemia and diabetes separately.
Prior to the current study, only two studies estimated the relationship between dietary Na intake and NAFLD in Korean adults. One study analysed data from 27 433 participants in the Korea National Health and Nutrition Examination Surveys (2008–2010) and found that the prevalence of NAFLD as assessed by both FLI and HSI was significantly higher in the highest estimated 24-h urinary Na excretion tertile group. A significant association was also found between higher estimated 24-h urinary Na excretion and NAFLD. OR (95 % CI) comparing the highest with the lowest tertiles of Na excretion were 1·39 (1·26, 1·55) for the HSI-defined NAFLD, and 1·75 (1·39, 2·20) for the FLI-defined NAFLD(Reference Huh, Lee and Lim14). However, the technique of estimating 24-h Na excretion with spot urine specimens using Tanaka’s equation that was utilised in the current study has been criticised because of the large bias in the estimation of individual salt intake(Reference Zhou, Tian and Fu21,Reference Titze22) . In addition, detailed information on physical activity level, an important factor for NAFLD, was not included(Reference Ryu, Chang and Jung23). Another study was a hospital-based cross-sectional analysis of 100 177 participants (46 596 men and 53 581 women) who underwent a health screening examination. It suggested that there was a correlation between Na intake and prevalence of NAFLD in young and middle-aged asymptomatic Korean adults. The multivariable-adjusted prevalence ratios (PR) comparing the highest with the lowest quintile of energy-adjusted Na intake were 1·25 (95 % CI 1·18, 1·32) in men and 1·32 (95 % CI 1·18, 1·47) in women. The association became attenuated when additionally adjusted for body fat percentage. The corresponding PR of NAFLD was 1·15 (95 % CI 1·09, 1·21) in men and 1·06 (95 % CI 0·95, 1·17) in women(Reference Choi, Lee and Chang15). However, a limitation of the current study is that the population included was not a nationwide random sample given that the study design was hospital-based but not community-based.
NAFLD has been considered the hepatic component of metabolic syndrome, with excessive fat accumulation and insulin resistance acting as key factors in its pathophysiology(Reference Rinella5,Reference Isokuortti, Zhou and Peltonen6) . Animal studies have demonstrated a significant association between increased Na intake and insulin resistance(Reference Ogihara, Asano and Ando9,Reference Fonseca-Alaniz, Takada and Andreotti10) . A potential independent association between Na intake and obesity has been reported in population studies. A study based on the UK National Diet and Nutrition Survey rolling programme that included 785 adults reported that a 1 g/d higher salt intake was associated with higher odds of being overweight or obese of 26 % (OR 1·26; 95 % CI 1·16, 1·37) after adjusting for several potential confounding factors, including energy intake(Reference Ma, He and MacGregor11). A cross-sectional study based on data from a sample of 730 participants aged 20–69 years found that a 1000 mg/d higher Na excretion was significantly associated with 3·8 units higher BMI (95 % CI 2·8, 4·8 kg/m2). Compared with participants in the lowest quartile of Na excretion, the adjusted PR in the highest quartile was 1·93 (95 % CI 1·69, 2·20) for overweight/obesity(Reference Zhao, Cogswell and Yang12). The International Study of Macro-/Micro-nutrients and Blood Pressure (INTERMAP Study) reported that a 1 g/d higher salt intake was associated with odds of overweight/obesity 21 % higher in Japan, 4 % higher in China, 29 % higher in the UK and 24 % higher in the USA(Reference Zhou, Stamler and Chan13). Considering that some metabolic parameters such as BMI may play a mediating role in the relationship between Na intake and NAFLD, we further adjusted for BMI, hypertension, hypercholesterolaemia and diabetes, and found that the relationship between Na intake and NAFLD was reduced but remained statistically significant. An exception is that the association between Na intake and FLI-defined NAFLD was non-significant after adjusting for BMI, likely due to the fact that FLI-defined NAFLD is body weight-oriented. The formula for FLI includes both BMI and WC(Reference Bedogni, Bellentani and Miglioli19).
Although the mechanisms underlying Na intake in relation to NAFLD remain unclear, experimental studies showed that a high-salt diet enhanced insulin sensitivity in adipocytes, which improved glucose uptake and insulin-induced glucose metabolism, promoted adipocyte hypertrophy, and increased the mass of white adipose tissue and leptin production in rats(Reference Fonseca-Alaniz, Takada and Andreotti10,Reference Fonseca-Alaniz, Brito and Borges-Silva24) . A recent study in mice showed that a high salt intake activated the aldose reductase–fructokinase pathway in the liver and hypothalamus, leading to endogenous fructose production with the development of leptin resistance and hyperphagia that caused obesity, insulin resistance and a fatty liver(Reference Lanaspa, Kuwabara and Andres-Hernando25).
To the best of our knowledge, the current study is the first to explore the association between dietary Na intake and NAFLD using a nationally representative sample of US adults, with a large sample size and comprehensive covariates included in the multivariate regression models. The mean energy-adjusted dietary Na intake of the participants was 3370·4 ± 841·3 mg/d in the current study, much more than 2300 mg/d recommended by the Dietary Guidelines for Americans(26). Our current study provides new evidence for the health hazards of excessive Na intake. Our study has several limitations. First, the definition of NAFLD was not based on hepatic imaging and biopsy but rather on predictive equations. Although hepatic imaging and biopsy methods have a better accuracy for the diagnosis of NAFLD, it is difficult to apply these methods in large-scale population studies. Second, we used two timed 24-h dietary recalls to estimate Na intake instead of 24-h urine collections, which is considered a gold standard for the estimation of Na intake in humans. To overcome this limitation, we took some measures to minimise the measurement bias caused by 24-h dietary recalls. For example, we excluded 5448 participants whose dietary data were considered unreliable. We also excluded 2740 participants with any special diet for medical reasons, weight loss or other purposes during the investigation. Even so, 24-h dietary recall has its inherent limitations, and two times of 24-h dietary recalls cannot reflect the long-term dietary habits. Multiple 24-h urine collections are needed to evaluate the relationship between Na intake and NAFLD in the future. Third, cross-sectional studies cannot provide information on temporal associations. Hence, a long-term prospective cohort analysis may be needed to better understand this relationship.
In conclusion, our findings indicate that dietary Na intake is positively associated with NAFLD in the US population. Further studies with a comprehensive molecular method are required to uncover the mechanisms underlying this association.
Acknowledgements
Acknowledgement: We thank all NHANES participants and staff for their valuable efforts and contributions. Financial support: This work was partially supported by the National Health and Medical Research Council of Australia (NHMRC) (grant number APP1049417). The funding source had no role in the study design, analysis and interpretation of the data. Conflict of interest: None. Authorship: L.Z. and Y.Y. designed the current study; L.Z. performed data cleaning and analysis and wrote the manuscript; Y.Y. contributed to data cleaning and interpretation; L.Z. critically revised and edited the manuscript for important intellectual content; and all authors reviewed and approved the final manuscript. Ethics of human subject participation: The current study was conducted according to the guidelines laid down in the Declaration of Helsinki, and all procedures involving study participants were approved by the NCHS of the CDC institutional review board. Written informed consent was obtained from all subjects.


