


Recent data suggest that an imbalance of low vitamin B12 (cobalamin) and high folate status may be associated with negative health outcomes in older adults and children( Reference Paul and Selhub 1 ). Moreover, it has been reported previously that high folate status or the use of folic acid supplements may have a negative effect on cognitive function in older people with diminished B12 status( Reference Moore 2 ).
The aim of this study was to describe the prevalence of four vitamin B12:folate categories in older adults and the relationship with several measures cognitive function, using data from Wave 1 (2009–2011) of The Irish Longitudinal Study on Ageing (TILDA), a nationally representative cohort of community-dwelling adults aged 50 and over (n = 8175).
Blood samples were analysed for concentrations of plasma B12 and folate (n = 3,914). Four categories were defined: normal B12/normal folate (total cobalamin >258 pmol/L, folate < = 45·3 nmol/L) low B12/normal folate (total cobalamin < = 258 pmol/L, folate < = 45·3 nmol/L), low B12/high folate (total cobalamin < = 258 pmol/L, folate >45·3 nmol/L), and normal B12/high folate (total cobalamin >258 pmol/L, folate >45·3 nmol/L). The Mini-Mental State Examination (MMSE), the Montreal Cognitive Assessment (MoCA) and verbal fluency were used was used to assess cognitive performance( Reference Kenny 3 ). Multiple regression analyses were used to examine relationship of each category with these measures of cognitive function.
The mean (SD) age of the population was 63·8 years (10·3), 48·5 % were female. The prevalence of normal B12/normal folate status was 55·0 % [53·3–56·8]; low B12/normal folate status was 38·5 % [36·8–40·2]; low B12/high folate status was 1·8 % [1·4–2·4] and normal B12/high folate status 4·6 % [3·8–5·6]. Mean MMSE scores were higher in the normal B12/normal folate group (28·1 [95 % CI 28·0–28·2]) compared to the low B12/normal folate group (27·8 [95 % CI 27·6–28·0]) (P = <0·05) (Fig 1). Similarly, mean MoCA scores were higher in the normal B12/normal folate group (24·4 [95 % CI 24·1–24·6]) compared to the low B12/normal folate group (23·8 [95 % CI 23·5–24·1]) (P = <0·05) (Fig 2). The overall mean scores for verbal fluency were not different from one another across all categories (Fig 3).

Fig. 1. Mean MMSE Score*.
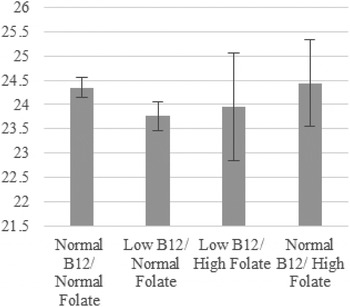
Fig. 2. Mean MoCA Score*.

Fig. 3. Mean Verbal Fluency Score*.
*covariates: age, gender, body mass index, educational attainment, depressive symptoms and disability.
Previous evidence has reported that low B12 and high folate status was associated with negative health outcomes in older adults, particularly cognitive function. Our data does not support this hypothesis, however we plan to investigate this hypothesis further with further measures of cognitive function and a higher threshold for folate status. These findings may have significant implications for future policy recommendations in Ireland, where a voluntary folic acid fortification programme is currently in place.


