


INTRODUCTION
By definition, parasites impose costs on their hosts and are partially responsible for shaping the phenotype, genotype, and life-history traits of host organisms. In many host species, the more heavily parasitized individuals are less likely to mate (Hamilton and Zuk, Reference Hamilton and Zuk1982), more likely to raise inferior offspring if they do mate (Neuhaus, Reference Neuhaus2003), suffer from reduced life expectancy (Walter and Proctor, Reference Walter and Proctor1999) and display modified behaviours (Poulin, Reference Poulin1992). Parasites can impose major costs on their hosts and thus influence many aspects of host physiology, ecology, life history and behaviour. Parasites have been found to affect various parameters of host social organization, such as group size (reviewed by Côté and Poulin, Reference Côté and Poulin1995 and Altizer et al. Reference Altizer, Nunn, Thrall, Gittleman, Antonovics, Cunningham, Dobson, Ezenwa, Jones, Pedersen, Poss and Pulliam2003), sexual segregation (Ferrari et al. Reference Ferrari, Rosa, Lanfranchi and Ruckstuhl2010), dominance hierarchies (Ezenwa, Reference Ezenwa2004) and contact networks (van Baalen, Reference van Baalen, Dieckmann, Metz, Sabelis and Sigmund2002). Parasite transmission rates typically scale positively with the density of the host population (density-dependent transmission) or with the frequency of interactions between the host and the parasite's infective stage (frequency-dependent transmission). As such, host behavioural and ecological traits that increase host proximity to infective stages and local population size/density, such as social group size, should increase parasite infection intensity (number of parasites per individual host; Bush et al. Reference Bush, Lafferty, Lotz and Shostak1997), parasite prevalence (the presence or absence of a parasite species on or in an individual host; Bush et al. Reference Bush, Lafferty, Lotz and Shostak1997) and parasite species richness (the number of parasites on or in a host individual, population or species; Bush et al. Reference Bush, Lafferty, Lotz and Shostak1997). The combination of these 3 terms will generally be referred to herein as ‘parasite infection’.
Host sociality (gregariousness) is a widespread phenomenon spanning many taxa including insects, fish, birds and mammals. Sociality has been the topic of much empirical and theoretical research concerning both ultimate and proximate causes for its existence. In essence, for gregariousness to have evolved and to have remained evolutionarily stable, the benefits of forming groups must consistently outweigh the costs. All social species experience both costs and benefits of living in groups. The benefits accrued to individuals living in groups are plentiful and variable and may include predator avoidance (i.e. dilution effects; Ostfeld and Keesing, Reference Ostfeld and Keesing2000), increased foraging efficiency, improved thermoregulation and mate choice (Krause and Ruxton, Reference Krause and Ruxton2002). Alexander (Reference Alexander1974) noted that there are no automatic or universal benefits gained by individuals through group formation, but there are automatic and universal costs, including, but not limited to, increased intra-specific competition for limited resources, predator attraction and an increased probability of misdirecting parental care (Krause and Ruxton, Reference Krause and Ruxton2002). When the costs are exceedingly large, group formation may be discouraged altogether. Given that most parasite transmission is either density-dependent or frequency-dependent, epidemiological models predict host density and local population size as key contributing factors controlling the transmission dynamics of infectious diseases because these variables often set the threshold for successful parasite invasion and spread (Anderson and May, Reference Anderson and May1978). Increased parasite infection is widely interpreted as a cost of gregariousness (Côté and Poulin, Reference Côté and Poulin1995). The magnitude of the cost depends on the degree to which infection negatively affects host fitness.
Alexander (Reference Alexander1974) proposed that group formation and increased group size should lead to enhanced parasite infection among group members through increased transmission. Hoogland and Sherman (Reference Hoogland and Sherman1976) and Freeland (Reference Freeland1977) were the first researchers to empirically test Alexander's idea. Hoogland and Sherman addressed this question with contagious parasites (fleas) of colonial bank swallows (Riparia riparia) and Freeland examined this question with mobile, biting flies in primate (Cercocebus albigena, Cercopithecus ascanius, Piliocolobus badius) social groups. Hoogland and Sherman (Reference Hoogland and Sherman1976) found a significant relationship between group size and both flea prevalence and intensity, lending support for Alexander's (Reference Alexander1974) hypothesis. Freeland's data, on the other hand, did not support Alexander's hypothesis. Freeland found evidence of a dilution effect: group size increased when attacks from biting flies increased, suggesting that grouping may be beneficial in terms of reducing per capita attack rates. Further testing of effects of group size on parasite intensity and prevalence has corroborated these original findings. For instance, Kunz (Reference Kunz1976) observed that bat fly (Trichobius corynorhini) intensities and group sizes of Townsend's big-eared bats (Corynorhinus townsendii) were positively correlated. Similar to Freeland (Reference Freeland1977), Rubenstein and Hohmann (Reference Rubenstein and Hohmann1989) found that dipteran biting fly intensities were negatively correlated with group size in feral horses (Equus caballus). The feral horses also appeared to form more tightly clustered aggregations when flies were more abundant, active or bothersome, suggesting a behavioural adaptation for dealing with dipteran parasitism (Rubenstein and Hohmann, Reference Rubenstein and Hohmann1989). This select cross-section of studies highlights the importance of understanding basic host and parasite biology when developing hypotheses and interpreting results with respect to the interplay between parasite infection and host gregariousness.
The risk of parasitism by contagious contact-transmitted parasites (i.e. parasites whose infective stages are directly transmitted via contact between hosts and are immediately infective – most ectoparasites; herein referred to as direct transmission) is predicted to positively correlate with group size as host proximity and the number and duration of conspecific contacts increases. A contagious parasite in which the infective stages occur off of the definitive host (i.e. in an intermediate host) and which are not immediately infective (i.e. most endoparasites; herein referred to as indirect transmission) should follow the same patterns as directly transmitted parasites if host groups are sedentary and exposure to infective stages is consistent. Host species that are highly mobile and range more widely are not predicted to acquire more indirectly transmitted infective stages in larger groups because such groups are able to move away from contaminated areas into more parasite-free environments (Côté and Poulin, Reference Côté and Poulin1995), thereby reducing group-member-to-group-member transmission of infective stages. However, this need not always be the case. For instance, if large mobile groups of predators forage more efficiently on certain prey species than smaller groups, and prey species are the intermediate hosts, then variation in predator group size may control the variation in the transmission rate of parasites. However, in general, the parasite infection intensity in mobile groups is predicted to show weak or absent correlations with group size. Mobile parasites (i.e. biting flies, mosquitoes, aquatic crustaceans) represent an interesting case: once a parasite has detected a group of hosts, the dilution effect predicts that as group size increases the probability that each group member has of being attacked decreases, resulting in an expected inverse relationship between group size and parasite intensity. However, mobile parasites can track their hosts’ movement patterns, so host mobility is not expected to affect the relationship between mobile parasites and their hosts.
In earlier meta-analyses on this topic, Côté and Poulin (Reference Côté and Poulin1995) and Rifkin et al. (Reference Rifkin, Nunn and Garamszegi2012) have generally supported the existence of an association between parasite infection and group size. These meta-analyses have both found, for instance, that contagious parasite infections increase with group size; however, Rifkin et al. (Reference Rifkin, Nunn and Garamszegi2012) did not support Côté and Poulin's (Reference Côté and Poulin1995) finding that mobile parasite intensity decreased with increasing group size. Rifkin et al. (Reference Rifkin, Nunn and Garamszegi2012) did not explore the effects of host mobility, but Côté and Poulin (Reference Côté and Poulin1995) did not find any correlations between either parasite intensity or prevalence and host mobility. Côté and Poulin (Reference Côté and Poulin1995) did not incorporate studies of parasite species richness, nor did they consider differences in direct and indirect parasite transmission modes in their analyses. Rifkin et al. (Reference Rifkin, Nunn and Garamszegi2012) did evaluate the effect of group size on parasite species richness and did not find any effect. Since Côté and Poulin's (Reference Côté and Poulin1995) meta-analysis, several studies elucidating the relationship between group size and parasite infection risk have been published and meta-analytical techniques have improved. While Rifkin et al. (Reference Rifkin, Nunn and Garamszegi2012) offer a phylogenetic analysis of various measures of parasite infection and host group size, as well as taxon-specific analyses, they do not evaluate several biologically meaningful explanatory variables, such as host mobility. In this article, we re-evaluate the literature and examine the relationship between host group size and parasite infection. Since our dataset spans a broad range of taxa, life histories and evolutionary lineages, we made the following assumptions. First, we assumed that host individuals are similarly susceptible to parasitism across group sizes, which Møller (1987) showed might not always be the case. Second, we assumed an even distribution of immunity against parasites across group sizes within species (Wilson et al. Reference Wilson, Knell, Boots and Koch-Osborne2003).
MATERIALS AND METHODS
Data collection
All data were collected from an extensive search of the literature published on or before 26 June 2012. A complete search of ISI Web of Science, Google Scholar, BIOSIS and PubMed was performed using all possible combinations of the terms: ‘parasite’, ‘parasitoid’, ‘pathogen’, ‘disease’ and ‘infection’ in conjunction with ‘group size’, ‘group’, ‘colony size’, ‘colony’, ‘colonial’, ‘gregarious’, ‘social’ and ‘communal’. References within collected published studies and all publications citing Côté and Poulin (Reference Côté and Poulin1995) were searched for pertinent data. These sources of information should provide comprehensive coverage of the published data on this topic. To be included in the analysis, reported results had to meet several main criteria. First, studies were included in the dataset if they reported a correlation coefficient (either Pearson or Spearman) between group size and 1 of 3 different measures of parasite infection risk: prevalence, intensity or species richness. These 3 measures of infection are most often predicted to correlate with gregariousness and group size in social animals. Pearson and Spearman correlation coefficients are commonly used as measures of effect size in meta-analyses (i.e. Côté and Poulin, Reference Côté and Poulin1995; Gontard-Danek and Møller, Reference Gontard-Danek and Møller1999) and are appealing because their squared value represents the variance in the response variable explained by the predictor. Second, published data were only included if the sample size (i.e. number of groups observed) was reported. Third, we chose not to mix single species and phylogenetic studies in our analyses. For example, in Table 1 (parasite prevalence) we chose to omit studies of cross-species relationships between mean group size and mean prevalence (e.g. Gregory et al. Reference Gregory, Keymer and Harvey1991, where n = 86 phylogenetically independent contrasts but is actually based on 100+ bird species). Mixing single species and phylogenetic studies is problematic in that there are obvious potential differences between within-species and cross-species patterns and the weighting of studies is thrown into question as, for example, 86 buffalo groups (i.e. one species) would be as heavily weighted as the 86 independent contrasts from 100+ bird species. For Table 3 (species richness), we chose to omit the one single species study (Snaith et al. Reference Snaith, Chapman, Rothman and Wasserman2008) since all other studies were cross-species analyses. Additionally, where data on the same host–parasite interaction were reported in the same study population across several years (e.g. Brown et al. Reference Brown, Komar, Quick, Sethi, Panella, Brown and Pfeffer2001) a composite mean effect was used in the analyses so as to deal with a possible lack of independence between the data. Finally, because different taxonomic groups of hosts contributed unequally to our dataset, we included higher taxa of hosts as a moderator in the models to control for any bias due to a taxonomically unbalanced dataset.
Table 1. Studies on the relationship between host group size and parasite prevalence included in the meta-analyses

Classification of data
The dataset was divided to test several hypotheses regarding host behaviour and parasite transmission dynamics. A separate meta-analysis was carried out to test each hypothesis where the data allowed.
Sedentary hosts
Sedentary hosts were considered as species or populations associated with a specific area for the duration of the original study, such as nests, burrows, or a highly restricted range (i.e. prairie dogs that remain on their group's territory, colonially nesting birds that remain in the colony, nests or nestlings that remain stationary).
Mobile hosts
Mobile hosts on the other hand were considered to be those species or populations that range widely or whose location was not spatially predictable during the course of the original study (i.e. most ungulates with large home ranges, free-swimming fish).
Mode of parasite transmission
We looked at directly transmitted parasites (contact-transmitted, immediately infective), indirectly transmitted parasites (most parasites that require off-host development) and mobile parasites (parasites that can freely move and actively seek new hosts, often by flying or swimming: flies, some swimming crustaceans, many microparasites and their vectors).
Statistical analyses
Meta-analysis is widely regarded as being a powerful method by which to quantitatively test hypotheses using previously published results (Cadotte et al. Reference Cadotte, Mehrkens and Menge2012; Nakagawa and Poulin, Reference Nakagawa and Poulin2012). Meta-analysis involves weighting effect size against the sample size. This is accomplished by transforming test statistics into a common metric called the effect size, which is a ‘standardized measure of the strength of a relationship between two variables of interest’ (Møller and Jennions, Reference Møller and Jennions2001). The measures of effect size used here were obtained from Pearson and Spearman correlation coefficients drawn from the pertinent literature. Correlation coefficients were transformed by means of Fisher's transformation to Z values (Sokal and Rohlf, Reference Sokal and Rohlf1995) and these Z values were used as the effect size in subsequent analyses. Mixed effects models were used to analyse each of the datasets with host species entered as a moderator variable (Hunter and Schmidt, Reference Hunter and Schmidt2000). Mixed effects models are random effects models with a moderator variable, and can be preferable in ecological studies where variation in observed effects is not due solely to sampling error and effect sizes are expected to vary between taxa and ecosystems (Jennions and Møller, 2002). By allowing for random sources of variation in effect sizes between studies, as well as in sampling error, random effect models can account for random variance caused by stochastic and biological processes (Jennions and Møller, 2002). Confidence intervals (95%) are reported and the mean effect size can be interpreted as being significantly different from zero if the 95% confidence intervals do not overlap zero. This relationship is also reflected in the P-values (i.e. P < 0·05).
Publication bias can be problematic for analyses that rely on previously published findings. In order to overcome the potential hurdles imposed by publication bias, several statistical methods have been developed for use in meta-analyses to both detect and adjust for any bias in the data (Møller and Jennions, Reference Møller and Jennions2001), although there is only one true way of testing for publication bias and that is to compare published and unpublished studies. Here, we estimated the potential for publication bias in the data by use of rank correlation tests (Begg and Mazumdar, Reference Begg and Mazumdar1994). The rank correlation test uses Spearman rank correlations to investigate the relationship between the effect size and sample size. Plotting effect size against sample size should reveal a funnel-shaped plot (funnel plot): larger variance in effect sizes when sample size is small with decreasing variance as sample size increases. If the funnel plot is significantly skewed (i.e. asymmetric) in any way, the rank correlation test will show this (i.e. P < 0·05) and appropriate measures can be taken to correct for the bias. The rank correlation test is regarded as being a fairly powerful test for investigating publication bias (Møller and Jennions, Reference Møller and Jennions2001). Publication bias was not detected for any of the tests in this study. We also determined fail-safe numbers for each of the meta-analyses using the Rosenthal method (Rosenthal, Reference Rosenthal1979). Fail-safe numbers represent the number of null results needed to eliminate an effect, or to change a significant result to a non-significant one (Møller and Jennions, Reference Møller and Jennions2001).
Meta-analyses were carried out in R version 2.15.0 (R Development Core Team, 2010) using the ‘metafor’ package (Viechtbauer, Reference Viechtbauer2010) and the ‘psychometric’ package (Fletcher, Reference Fletcher2008). The ‘metafor’ package was used to generate the meta-analyses using maximum likelihood techniques, create funnel plots, conduct the rank correlation publication bias test, and to generate the fail-safe numbers. The ‘psychometric’ package was used to convert reported correlation coefficients to Z values for use in the meta-analyses.
RESULTS
Seventy correlations were found that met the selection criteria. Nineteen of these reported data on parasite prevalence and group size (Table 1), 34 correlations reported data on parasite intensity and group size (Table 2) and 17 reported data on parasite species richness and group size (Table 3). The average sample size across all studies was n = 22·8 groups (range: 4–86 groups), for parasite prevalence studies the average sample size was n = 15·8 groups (range: 4–32 groups), for parasite intensity studies the average sample size was n = 14·6 groups (range: 4–42 groups) and the average sample size for parasite species richness studies was n = 37·9 groups (range: 8–86 groups).
Table 2. Studies on the relationship between host group size and parasite intensity included in the meta-analyses
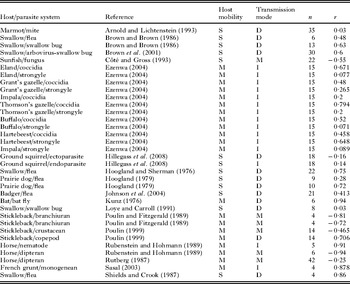
Table 3. Studies on the relationship between host group size and parasite species richness included in the meta-analyses

Relationships between host group size and parasite prevalence
Among comparisons of parasite prevalence, the effect size estimate was high and significantly different from zero (Table 4a). Thus, a strong positive correlation was found between overall parasite prevalence and group size. Similar positive correlation trends were also found between group size and both directly transmitted parasites (Table 4a) and indirectly transmitted parasites (Table 4a). No studies were found that reported data on group size and parasite prevalence for mobile parasites (Table 1). Due to high co-variation between studies on mode of transmission and host mobility, we did not test for effects of host mobility on parasite prevalence.
Table 4. Results from each separate meta-analysis regarding parasite infection in group-living species

Relationships between host group size and parasite intensity
Larger groups had more intense parasite infections than expected by chance (Table 4b). The intensities of directly transmitted parasites (Table 4b) and indirectly transmitted parasites (Table 4b) also showed significant positive trends with increasing group size (Table 4b). The relationship between mobile parasite intensity and group size showed a significant negative trend (Table 4b). Host mobility played a role in determining parasite infection intensity, with larger groups of sedentary hosts more likely to have higher parasite intensities (Table 4b). Mobile hosts did not show a significant effect of group size and parasite intensity (Table 4b).
Relationships between host group size and parasite species richness
Finally, for overall parasite species richness the effect size was low, making it likely that the observed mean could have been obtained by chance (Table 4c). No trend was obtained for the relationship between directly or indirectly transmitted parasite species richness and group size (Table 4c). All available studies were from mobile hosts so distinctions between mobile and sedentary hosts could not be made (Table 1).
DISCUSSION
Parasite prevalence and intensity
We have noted general trends spanning a variety of taxa that support a positive relationship between group sizes in social animals and the infection intensity and prevalence of many parasites. These findings are consistent with previous meta-analyses (Côté and Poulin, Reference Côté and Poulin1995; Rifkin et al. Reference Rifkin, Nunn and Garamszegi2012). This result is not surprising when we consider that all contagious (i.e. non-mobile) parasites require direct contact between susceptible hosts and infective stages and that most parasites exhibit density-dependent or frequency-dependent transmission. Accordingly, the results presented here are supported by predictions of epidemiological models and social evolution theory (Alexander, Reference Alexander1974; Anderson and May, Reference Anderson and May1978). Epidemiological models predict that parasite transmission will be enhanced in group-living species due to increased proximity and contact with infective stages (Anderson and May, Reference Anderson and May1978) resulting in elevated parasite infections amongst group members. As such, increased parasite infection intensity and prevalence appear to be costs of group-living across a broad range of host and parasite species. Where the costs of parasitism are great, parasites may thus put constraints on optimal group sizes and the evolutionary stability of social groups.
In contrast, we have also shown here that forming groups may be beneficial to individuals faced with infection by mobile parasites (i.e. dipterans, mosquitoes), possibly through the encounter-dilution effect. When confronted with mobile parasites, group formation is predicted to reduce the attack rate per individual group member (Freeland, Reference Freeland1977). To date, no studies have been conducted to test the relationship between group size and the prevalence of mobile parasites. Studies of mobile parasite intensity are more common and there is good support for a dilution effect (grouping benefits) when mobile parasites are present. For instance, Poulin and Fitzgerald (Reference Poulin and Fitzgerald1989) experimented with a mobile crustacean ectoparasite that parasitizes stickleback fish and found that attack rates increased less than linearly so that each individual in the group was less at risk when in a larger group. In mammals, Freeland (Reference Freeland1977), Duncan and Vigne (Reference Duncan and Vigne1979), Espmark and Langvatn (Reference Espmark and Langvatn1979), Rutberg (Reference Rutberg1987) and Rubenstein and Hohmann (Reference Rubenstein and Hohmann1989) have all found positive effects of grouping through reduced attack rates of mobile parasites. The results presented here are in agreement with Côté and Poulin (Reference Côté and Poulin1995) in terms of the overall trend observed between group size and mobile parasite intensity, but differ from those of Rifkin et al. (Reference Rifkin, Nunn and Garamszegi2012), possibly owing to differences in analytical techniques.
Interestingly, the mobility of the host appears to be important. Mobile hosts are able to move away from infected areas or hosts and this ability to escape may mitigate the effect of group size on parasite infection intensity. Mobile hosts may also have less rigid group structures than sedentary hosts, which may lead to highly variable group sizes over time and may confound studies looking for group size effects. Additionally, larger, less stable groups have been shown to experience increased social stress related to crowding and/or less rigid dominance hierarchies (Sapolsky, Reference Sapolsky2005). The majority (15 of 21) of the group-living species included in the mobile host–parasite intensity meta-analysis presented here are species that exhibit some form of hierarchical social structure. Dominant individuals generally have higher levels of androgen hormones (i.e. testosterone), which are known to suppress host immune function (Sapolsky, Reference Sapolsky2005; Nunn et al. Reference Nunn, Lindenfors, Pursall and Rolff2009). Additionally, dominant individuals that frequently engage in physical combat to maintain rank may be more likely to acquire directly (contact) transmitted parasites. Submissive individuals typically have higher levels of cortisol, a stress hormone that has also been linked to a reduced immune function (Gulland, Reference Gulland1992). Subordinates may also have fewer possibilities to select grazing locations and may incur a higher risk of parasitism by grazing in less preferred, contaminated locations (Hutchings et al. Reference Hutchings, Milner, Gordon, Kyriazakis and Jackson2002). As a result, group-living animals that form dominance hierarchies may experience variable or skewed parasite intensities depending on the social system and physiological responses of the species or population, which could not be addressed in our study.
In sedentary groups, the social contact networks and transmission patterns are spatially and temporally stable, which may foster continual transmission of parasites between neighbours. Most studies of sedentary hosts consider nesting or burrowing species. Nests and burrows are spatially fixed features that hosts are ‘attached’ to, at least for the duration of study. For instance, prairie dogs typically hold the same burrow location throughout their lifetime and interact with the same set of neighbours most frequently (Hoogland, Reference Hoogland1995). Transmission of parasites is likely then facilitated by repeated interactions between neighbours and by continuous host exposure to infective stages, such that parasites are readily shared between adjacent and nearby hosts. In some cases, neighbours are kin and related hosts may have common genetic dispositions to infection (i.e. weak immune systems). As such, we should expect that patterns of parasite infection intensity would hold for sedentary hosts, and indeed we find that they do.
If hosts are faced with a virulent parasite and higher contact rates induce greater parasite transmission, evolutionary forces should drive the host to respond with lower rates of contact to a point where the costs of group-living are minimized. Bonds et al. (Reference Bonds, Keenan, Leidner and Rohani2005) point out the conspicuous absence of published studies that have found a negative correlation between group size and contagious parasite prevalence. This is substantiated here as we could only find 1 study that reported a negative relationship between group size and prevalence that met the selection criteria. Bonds et al. (Reference Bonds, Keenan, Leidner and Rohani2005) question that if animal behaviours change in response to infection risk, why is it that we have not seen evidence of more substantial evolutionary influences on social structure? It is clear that the evolutionary relationship between hosts and parasites is not unidirectional, and that parasites should be expected to evolve mechanisms to overcome host adaptations and vice versa (i.e. Hamilton et al. Reference Hamilton, Axelrod and Tanese1990; Webster et al. Reference Webster, Gower and Blair2004; Decaestecker et al. Reference Decaestecker, Gaba, Raeymaekers, Stoks, Van Kerckhoven, Ebert and De Meester2007; Duffy and Sivars-Becker, Reference Duffy and Sivars-Becker2007; Morran et al. Reference Morran, Schmidt, Gelarden, Parrish and Lively2011). Importantly, the evolutionary history and the fitness costs of infection should be explicitly stated in all studies of host–parasite interactions. Host specificity of the parasite also needs to be taken into consideration. Studies have shown that parasite species able to exploit many taxonomically unrelated hosts often achieve higher intensities than specialist parasites, possibly because host species have developed particular defences for coping with specialist parasites, but not generalists (Krasnov et al. Reference Krasnov, Poulin, Shenbrot, Mouillot and Khokhlova2004). Ezenwa (Reference Ezenwa2004) showed that gregarious species were more likely to be infected than were solitary species with generalist species of strongyles (a gastrointestinal parasite). For strongyles, contact with heterospecifics and conspecifics could both affect the rates of exposure to this group of parasites (Ezenwa, Reference Ezenwa2004). Finally, intersexual differences may drive the parasite transmission dynamics, but often sex ratios are not explicitly considered in studies of group size. Sex ratios can be extremely biased in many groups, such as harems and sexually segregated groups. In studies of group-living species it is pertinent to acknowledge that males and females are often not infected by parasites in the same manner and the transmission dynamics and infection risk can be affected by the sex ratio. In most vertebrate species, males are more likely to be infected with parasites (higher prevalence) and carry a higher intensity of infection than are females of the same species (Poulin, Reference Poulin1996; Zuk and McKean, Reference Zuk and McKean1996; Schalk and Forbes, Reference Schalk and Forbes1997; Moore and Wilson, Reference Moore and Wilson2002; Ferrari et al. Reference Ferrari, Cattadori, Nespereira, Rizzoli and Hudson2004; Klein, Reference Klein2004; Hillegass et al. Reference Hillegass, Waterman and Roth2008). Therefore, groups with male-biased sex ratios may be at an elevated risk of acquiring parasites and maintaining infections. One hypothesis that is especially pertinent to group-living species, but which has received very little attention to date, is that males and females may sexually segregate as a means to avoid parasite transmission (Ferrari et al. Reference Ferrari, Rosa, Lanfranchi and Ruckstuhl2010).
Parasite species richness
Hosts with higher mobility or those that live in open societies with intergroup member exchange are widely hypothesized to have higher parasite species richness because contact with a diversity of individuals and environments should promote the acquisition of novel parasites. A large group is also more likely to contain a group member (or members) with rare parasite fauna. Freeland (Reference Freeland1979) found more protozoan species in larger mangabey (Cercocebus albigena) and blue monkey (Cercopithecus mitis) groups inhabiting the same area. However, results from subsequent studies testing associations between group size or group-living and parasite species richness have varied considerably, with some studies showing positive relationships, some showing negative relationships, and others showing no relationship at all (Gregory et al. Reference Gregory, Keymer and Harvey1991; Poulin, Reference Poulin1991a, Reference Poulin1991b; Ranta, Reference Ranta1992; Watve and Sukumar, Reference Watve and Sukumar1995; Tripet et al. Reference Tripet, Christe and Møller2002; Nunn et al. Reference Nunn, Altizer, Jones and Sechrest2003; Vitone et al. Reference Vitone, Altizer and Nunn2004). The results presented here support the conclusion that no broad general trends between parasite species richness and group size appear to exist in the available literature, counter to our original prediction. These findings are in concordance with Rifkin et al. (Reference Rifkin, Nunn and Garamszegi2012). Given the complexities of host social behaviour, it is likely that the degree and directionality of the effect of host group size on parasite species richness depends on the specific social system of the host group/species under consideration and on other elements of host behaviour that affect contact rates, such as dominance hierarchies (Wilson et al. Reference Wilson, Knell, Boots and Koch-Osborne2003).
Some authors have argued that sociality should lower the risk of parasite transmission if increased clustering of individuals into relatively permanent groups effectively quarantines parasites into discrete host patches (Hess, Reference Hess1996; Watve and Jog, Reference Watve and Jog1997; Wilson et al. Reference Wilson, Knell, Boots and Koch-Osborne2003). Freeland (Reference Freeland1979) proposed that individuals that remain within a group are less likely to become infected with parasites to which they have not previously been exposed than are individuals that frequently engage in extra-group social relationships. In this sense, closed social groups or more sedentary groups may act as barriers to parasite transmission between groups or extra-group members (Loehle, Reference Loehle1995), leading to reduced species richness.
CONCLUSIONS
Sociality is thought to be one of the last major evolutionary transitions (Jackson and Hart, Reference Jackson and Hart2009) and group-living generates many advantages, such as diluted predation risk, extended parental care and enhanced potential for information sharing (Krause and Ruxton, Reference Krause and Ruxton2002). However, group-living also imposes costs, particularly a predicted increase in the risk of parasite infection. Local population density and social group size can increase rates of host–host contact and host interaction with parasite-infective stages. While the role of parasites in the evolution of group formation and sociality are far from clear, empirical evidence appears to support the hypothesis that parasites can exert selective pressures on group size and group formation, and may have driven, at least in part, the evolution of social behaviours. We have shown here that parasite intensity and parasite prevalence generally trend positively with increasing group size, suggesting an increased cost associated with forming larger groups.
The results presented here are correlational and do not allow explicit derivations of causative mechanisms. Future research should focus on the causes of increased parasite intensity and prevalence in groups and the selective forces imposed by parasites on group formation and stability. In order to fully assess these problems, the costs of parasitism must be explicitly determined a priori. If parasites do not impose appreciable costs on host fitness (i.e. reduced offspring growth and survival, reduced mating success, reduced lifespan), then parasitism should not be expected to function as an evolutionary pressure influencing group size. It is apparent that many parasites do impose costs on the fitness of their hosts and, in this regard, parasites may constrain group size. In extreme situations, intense parasitism could lead to a reduction of social behaviour or the elimination of group-living altogether; however, the latter situation is highly unlikely. In order for group-living to be evolutionarily stable and persistent the costs of living in groups must not outweigh the benefits. When the risk of parasite transmission increases, the costs to group-living also increase. Clearly, in these cases, benefits of group formation must be great. According to Brown and Brown (Reference Brown and Brown1986), ‘… without compensating benefits of coloniality, the cost of ectoparasitism would quickly select for solitary nesting in Cliff Swallows’.
Here we see that parasitism can be one of the most important costs associated with sociality and group-living. However, in the case of mobile parasites, group-living appears to be beneficial for reducing parasite intensities. Therefore, when grouping leads to increased parasite infection, group size will be down-regulated to achieve an optimal group size that balances the costs of parasitism with the other benefits of group-living. However, in cases where grouping reduces parasite attack rates, lower parasitism will be a benefit of group-living and group sizes may be larger than expected.
Ultimately, group-living has probably evolved several times and for several different reasons (Alexander, Reference Alexander1974), so parasite infection must be considered along with other factors that favour or discourage gregariousness, such as predation and competition, in a complete cost–benefit model. If we are to fully understand why animals live in groups we must employ a holistic approach that incorporates multiple explanatory factors, in particular host–parasite phylogenies, host sex, host group structure, parasite specificity and parasite transmission mode, in comparative analyses that will allow us to examine the links between host sociality and parasite infection in a broader context. Even after over 15 years of intense study, it is still necessary to echo Côté and Poulin's (Reference Côté and Poulin1995) call for future studies that focus on experimental manipulations of parasite infection risk in gregarious species in order to elucidate the causative factors modulating optimal group sizes in free-ranging animals. Additionally, studies on the relationship between parasite prevalence and group size are needed specifically for sedentary species and indirectly transmitted parasites.
ACKNOWLEDGEMENTS
We are grateful to R. M. R. Barclay, S. Kutz, M. Pavelka, M. Jennions and one anonymous reviewer for thoughtful discussion and critique.
FINANCIAL SUPPORT
An NSERC Canada Graduate Scholarship, Bettina Bahlsen Memorial Scholarship, and Queen Elizabeth II Scholarship supported J.E.H.P.


 Open access