


Introduction
Seasonal Ecological Variation
High-latitude ecosystems experience extreme seasonality, with the timing of their short growing season dependent on a combination of temperature, snowmelt, and photoperiod (Ernakovich et al. Reference Ernakovich, Hopping, Berdanier, Simpson, Kachergis, Steltzer and Wallenstein2014). Animals have adapted to this seasonality, with annual metabolic events (i.e., pregnancy, weaning, use of fat reserves, hibernation) coordinated based on seasonal resource availability (Gilg et al. Reference Gilg, Kovacs, Aars, Fort, Gauthier, Grémillet, Ims, Meltofte, Moreau, Post and Schmidt2012). Temperature and precipitation, and thus the growing season, at high latitudes were strongly affected by climatic variability during the Pleistocene (e.g., Guthrie Reference Guthrie2001) and are expected to change again dramatically with contemporary climate change (Gilg et al. Reference Gilg, Kovacs, Aars, Fort, Gauthier, Grémillet, Ims, Meltofte, Moreau, Post and Schmidt2012; Ernakovich et al. Reference Ernakovich, Hopping, Berdanier, Simpson, Kachergis, Steltzer and Wallenstein2014). Large terrestrial herbivores such as cervids (family Cervidae) may experience “trophic mismatch” if they are unable to adapt the timing of annual metabolic events to changing seasonality (Gilg et al. Reference Gilg, Kovacs, Aars, Fort, Gauthier, Grémillet, Ims, Meltofte, Moreau, Post and Schmidt2012; Ernakovich et al. Reference Ernakovich, Hopping, Berdanier, Simpson, Kachergis, Steltzer and Wallenstein2014). Methods to track cervid responses to environmental change, such as isotope-based tracking of seasonal diets, are therefore important to study high-latitude ecosystem shifts caused by climate change (Zhao et al. Reference Zhao, Colman, Irvine, Karlsen, Olack and Hobbie2019). These methods are also important to elucidate Pleistocene ecology. The diversity of Pleistocene herbivore megafauna coexisting in high-latitude environments may have involved seasonally based resource partitioning, with dietary specialization during periods of winter resource scarcity and generalist diets during the growing season (Schwartz-Narbonne et al. Reference Schwartz-Narbonne, Longstaffe, Kardynal, Druckenmiller, Hobson, Jass, Metcalfe and Zazula2019). Seasonality may thus have played a key role in Pleistocene herbivore megafauna interactions.
Cervid antler tissue grows rapidly, and the antler sets are fully developed after 4 months (Chapman Reference Chapman1975). Despite this intense energy investment, cervids that live in high-latitude environments shed and regrow their antlers annually. Antler is structurally analogous to bone and is composed of hydroxyapatite mineral deposited within a collagen protein matrix. The stable carbon and nitrogen isotope compositions (δ13CColl and δ15NColl) of bone collagen closely correlate with those of the individual's diet (Kelly Reference Kelly2000). In this study, we assess whether seasonal changes in diet or nutritional stress are recorded in cervid antler δ13CColl and δ15NColl. In addition, we compare the spring–summer isotopic signal in antler with the multiyear signal in bone from the same individual.
The δ13CColl and δ15NColl of three cervid species were examined in this study: elk (Cervus elaphus, also known as red deer or wapiti), moose (Alces alces, also known as Eurasian elk), and caribou (Rangifer tarandus, also known as reindeer). We tested for metabolic controls on antler δ15NColl using antler amino acid (glutamate and phenylalanine) δ15N (δ15NGlu and δ15NPhe) from modern caribou living in captivity. The study includes 8 paleo-antlers measured for intra-antler isotopic variability (2 elk; 2 moose; 4 caribou), 2 paired antler–bone paleo-samples (1 moose; 1 caribou), and 6 modern samples (5 caribou; 1 Ankole bull). All paleontological specimens originate from Yukon Territory, Canada, and a subset were confirmed by radiocarbon dating to be of Pleistocene or Holocene age.
Temporal changes in an animal's diet can be assessed through stable isotope analysis of (1) a single tissue repeatedly sampled over time, (2) multiple tissues with varying turnover rates, or (3) a single tissue with progressive growth (Dalerum and Angerbjörn Reference Dalerum and Angerbjörn2005; Davis and Pineda-Munoz Reference Davis and Pineda-Munoz2016). Previous studies of present-day cervids examined short-term ecological changes by comparing the isotopic signal of bone collagen, which provides a multiyear average, to that of tooth collagen, which represents only the brief period of time during youth when the tooth formed (Drucker et al. Reference Drucker, Bocherens, Pike-Tay and Mariotti2001, Reference Drucker, Hobson, Münzel and Pike-Tay2012). Seasonal changes in diet have also been identified by serial sampling of keratin-based tissues such as hooves (Barnett Reference Barnett1994; Kielland Reference Kielland2001; Walter and Leslie Reference Walter and Leslie2009) and hair (Drucker et al. Reference Drucker, Hobson, Ouellet and Courtois2010; Zhao et al. Reference Zhao, Colman, Irvine, Karlsen, Olack and Hobbie2019). Keratinous tissues, however, do not typically preserve well over archeological or paleontological timescales, whereas bone, tooth, and antler are more likely to survive. In some contexts, antler represents a large proportion of the available sample material in paleontological archives, surpassing the number of other skeletal elements from the same species (Jay and Richards Reference Jay and Richards2007; Kuitems et al. Reference Kuitems, van der Plicht, Drucker, Van Kolfschoten, Palstra and Bocherens2015; Miller et al. Reference Miller, Carden, Evans, Lamb, Madgwick, Osborne, Symmons and Sykes2016). Thus, understanding the temporal scale of dietary information that stable isotope analysis of antler can—and cannot—provide is highly relevant (Davis and Pineda-Munoz Reference Davis and Pineda-Munoz2016).
Antler and Bone Growth
Antler growth is rapid, with continuous remodeling occurring spatially at the cellular level within the tissue during its formation. Antler development begins at the pedicle, or attachment point to the skull, with new tissue deposited at the tip of the growing antler (Fig. 1) (Banks and Newbrey Reference Banks, Newbrey and Brown1983). The upper portion of the antler grows faster than the lower portion, correlated with the greater availability of high-quality forage during late spring and summer (Van Ballenberghe Reference Van Ballenberghe and Brown1983; Finstad and Kielland Reference Finstad and Kielland2011; Gomez et al. Reference Gomez, Garcia, Luna, Kierdorf, Kierdorf, Gallego and Landete-Castillejos2013). The outer circumference of an antler is composed of layers of woven bone that are systematically remodeled into dense lamellar cortical bone. In contrast, the interior of an antler is composed of spongy cancellous bone deposited toward the very end of the growth period (Fig. 1) (Gomez et al. Reference Gomez, Garcia, Luna, Kierdorf, Kierdorf, Gallego and Landete-Castillejos2013; Kierdorf et al. Reference Kierdorf, Flohr, Gomez, Landete-Castillejos and Kierdorf2013). The final stage of tissue growth consists of an extremely thin layer of woven bone deposited over the pedicle and antler base (Fig. 1) (Gomez et al. Reference Gomez, Garcia, Luna, Kierdorf, Kierdorf, Gallego and Landete-Castillejos2013; Kierdorf et al. Reference Kierdorf, Flohr, Gomez, Landete-Castillejos and Kierdorf2013). All growth takes place while the antler is covered in a layer of highly vascular skin (called velvet) that supplies nutrients and oxygen to the living bone tissue of the antler. Once antler growth is complete, the velvet is shed. The finished antler is effectively dead avascular tissue in which no further remodeling takes place (Gomez et al. Reference Gomez, Garcia, Luna, Kierdorf, Kierdorf, Gallego and Landete-Castillejos2013).
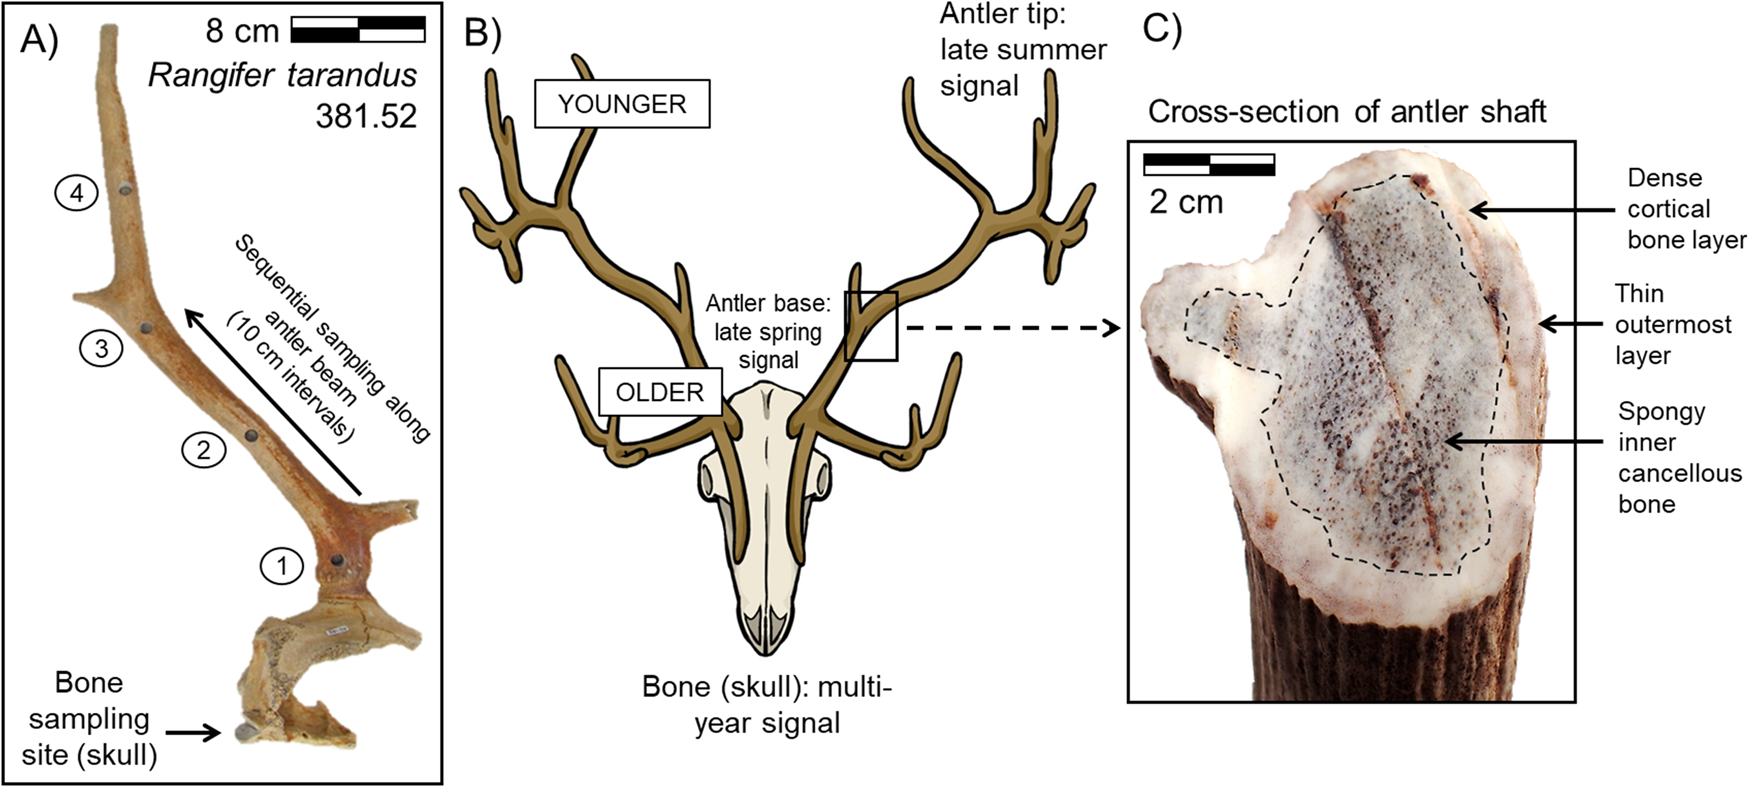
Figure 1. Sampling strategy: A, an example of the sampling pattern (arrows) for a caribou skull and antler (specimen YG 361.52; bone sample removed from right occipital condyle); B, conceptual model of the timing of antler tissue formation in cranial bone versus antler; and C, cross-section of an antler shaft differentiating cortical and cancellous bone. This study measured variability along the length of the antler in cortical bone.
The overall growth pattern makes it possible to record seasonal changes in tissue δ13C and δ15N across both the length and width of an antler (Fig. 1). In contrast, the bone tissue that comprises the rest of the skeletal elements in the body is vascular and remodels continuously over the course of the animal's lifetime, yielding an isotopic signal that is an average of multiple years. In most cervid species, only males take on the calcium burden of growing antlers, with the exception of caribou. Both male and female caribou grow antlers. Males use antlers primarily to attract females for mating and for fighting with other males during the rut; the antlers are commonly shed before winter. Antler growth in males generally occurs between the late spring and summer months, and the velvet is shed during late summer or early autumn before the rutting season (Chapman Reference Chapman1975; Van Ballenberghe Reference Van Ballenberghe and Brown1983). Resorption of mineralized tissue between the base of the antler and pedicle occurs after the mating season, and the antler is eventually shed. Antler growth in caribou females begins about a month later than male antler growth (Chapman Reference Chapman1975; Leader-Williams Reference Leader-Williams1988). Female caribou typically retain their antlers over the winter months; females primarily use antlers to access forage underlying snow to obtain sufficient resources to sustain themselves and their unborn calves.
Stable Isotopes
Stable isotope compositions are reported using δ-notation, which compares sample isotope ratios (e.g., 13C/12C, 15N/14N) to internationally accepted standard isotope ratios, in per mille (‰). The reference standards are VPDB for carbon isotope ratios (Coplen et al. Reference Coplen, Brand, Gehre, Gröning and Meijer2006) and AIR for nitrogen isotope ratios (Mariotti Reference Mariotti1983).
δ13C and δ15N of Plants
Cervids consume a herbivorous diet. The isotopic composition of photosynthetic organisms is highly variable. The main variability in terrestrial plant isotopic compositions depends on the method of carbon fixation. Modern plant species that employ the C3 photosynthetic pathway have an average δ13C of ~ −27‰. Plants that utilize the C3 photosynthetic pathway comprised the vast majority (and at times, the entirety) of the vegetation in North American high-latitude regions during the late Pleistocene and Holocene (Blinnikov et al. Reference Blinnikov, Gaglioti, Walker, Wooller and Zazula2011; Gaglioti et al. Reference Gaglioti, Barnes, Zazula, Beaudoin and Wooller2011; Kristensen et al. Reference Kristensen, Kristensen, Forchhammer, Michelsen and Schmidt2011). Other factors that can influence C3 vegetation stable carbon isotope composition include extensive canopy cover, which typically leads to more negative plant δ13C; warmer temperatures, which lead to more positive plant δ15N; and increased aridity, which results in more positive plant δ13C and δ15N (O'Leary Reference O'Leary1981; Tieszen Reference Tieszen1991; Koch et al. Reference Koch, Fogel, Tuross, Lajtha and Michener1994; Kohn Reference Kohn2010). While plant isotopic baselines can vary among sites and over time (Schwartz-Narbonne et al. Reference Schwartz-Narbonne, Longstaffe, Kardynal, Druckenmiller, Hobson, Jass, Metcalfe and Zazula2019), the average δ13C and δ15N of aquatic macrophytes, C3 vascular terrestrial plants (shrubs and herbs), lichens, mosses, and fungi in high-latitude ecosystems tend to follow a predictable pattern (Fig. 2). The observed isotopic patterns for these plants and fungi from high-latitude sites is: δ13C of shrubs < herbs < fungi < mosses < lichens < freshwater macrophytes. For δ15N, the pattern is: moss < lichens < shrubs < herbs < freshwater macrophytes < fungi (Fig. 2) (Barnett Reference Barnett1994; Nadelhoffer et al. Reference Nadelhoffer, Shaver, Fry, Giblin, Johnson and McKane1996; Ben-David et al. Reference Ben-David, Shochat and Adams2001; Kielland Reference Kielland2001; Tischler Reference Tischler2004; Wang and Wooller Reference Wang and Wooller2006; Milligan Reference Milligan2008; Drucker et al. Reference Drucker, Hobson, Ouellet and Courtois2010; Finstad and Kielland Reference Finstad and Kielland2011; Kristensen et al. Reference Kristensen, Kristensen, Forchhammer, Michelsen and Schmidt2011; Tahmasebi et al. Reference Tahmasebi, Longstaffe, Zazula and Bennett2017; Plint et al. Reference Plint, Longstaffe and Zazula2019). The extensive overlap in the data compiled from a range of high-latitude sites is expected, given the range of δ13C and δ15N among plant types within a single site.

Figure 2. Stable carbon and nitrogen isotope compositions of common, modern, high-latitude vegetation based on previous studies of Arctic and subarctic ecosystems (Barnett Reference Barnett1994; Wang and Wooller Reference Wang and Wooller2006; Milligan Reference Milligan2008; Tahmasebi et al. Reference Tahmasebi, Longstaffe, Zazula and Bennett2017; Plint et al. Reference Plint, Longstaffe and Zazula2019) and presented as: A, data points; and B, ellipses. Herbs include annual and perennial grasses, forbs, and sedges (Tahmasebi et al. Reference Tahmasebi, Longstaffe, Zazula and Bennett2017). Woody plant angiosperms (AS) include angiosperm subshrubs, shrubs, and trees. Woody plant gymnosperms (GS) include gymnosperm trees. Ellipses encompass 40% of the data for each forage type, corrected for small sample size (Parnell and Jackson Reference Parnell and Jackson2013). Forage δ13C was corrected for the Suess effect to the last glacial maximum δ13Catmosphere using the date of sample collection (Long et al. Reference Long, Sweitzer, Diefenbach and Ben-David2005; Tahmasebi et al. Reference Tahmasebi, Longstaffe and Zazula2018). Isotopic results for all plant tissues were included unless the study identified them as roots or as outliers. Despite substantial overlap, different plant types tend to occupy different positions in δ15N versus δ13C space on this isotopic cross-plot.
δ13C and δ15N of Herbivores
The stable carbon and nitrogen isotope compositions of a consumer's bodily tissues reflect the protein component of diet, after accounting for trophic discrimination. For large herbivores, there is a well-documented trophic increase of ~ +5‰ for δ13C, and +3 to +5‰ for δ15N from diet to collagenous tissues (bone, tooth dentin and cementum) (Koch et al. Reference Koch, Fogel, Tuross, Lajtha and Michener1994; Bocherens Reference Bocherens2015). Nutritional stress is thought to produce higher δ15N in cervids (Parker et al. Reference Parker, Barboza and Stephenson2005), although this effect is disputed (see Drucker et al. Reference Drucker, Hobson, Münzel and Pike-Tay2012). We use Δ15NGlu-Phe (δ15Nglutamate − δ15Nphenylalanine) to evaluate whether rapid tissue growth, such as occurs within antlers, has affected the δ15N of collagenous tissues, including antlers, as has been suggested in the past (Trueman et al. Reference Trueman, McGill and Guyard2005; Waters-Rist and Katzenberg Reference Waters-Rist and Katzenberg2010; Madgwick et al. Reference Madgwick, Sykes, Miller, Symmons, Morris and Lamb2013; Osborne Reference Osborne2017).
The δ15N of individual amino acids in bone collagen can be used to assess the extent of metabolic enrichment between diet and tissue. The difference between the δ15N of phenylalanine (Phe: a “source” amino acid whose δ15N derives from diet) and of glutamate (Glu: a “trophic” amino acid whose δ15N increases with each subsequent metabolic cycling event) is a measure of metabolic enrichment in an animal. Higher Δ15NGlu-Phe occurs in animals higher up in the food chain (Chikaraishi et al. Reference Chikaraishi, Kashiyama, Ogawa, Kitazato and Ohkouchi2007, Reference Chikaraishi, Ogawa, Kashiyama, Takano, Suga, Tomitani, Miyashita, Kitazato and Ohkouchi2009, Reference Chikaraishi, Steffan, Takano and Ohkouchi2015; McMahon and McCarthy Reference McMahon and McCarthy2016). Values of Δ15NGlu-Phe can change in animals fed a low-quality diet (McMahon and McCarthy Reference McMahon and McCarthy2016) or experiencing starvation (Barreto-Curiel et al. Reference Barreto-Curiel, Focken, D'Abramo and Viana2017) (although the latter is debated; see Ishikawa et al. Reference Ishikawa, Hayashi, Sasaki, Chikaraishi and Ohkouchi2017). Thus, metabolic controls, in addition to trophic level, have the potential to change an animal's Δ15NGlu-Phe. If bone, tooth, and antler δ15NColl are controlled by the same metabolic processes, we expect the Δ15NGlu-Phe in these three tissues to be the same for ruminant herbivores, in the absence of dietary stress. If rapid tissue growth is a metabolic control on antler δ15NColl, we expect that to be reflected in distinct antler Δ15NGlu-Phe.
Materials and Methods
Specimen Collection
The Pleistocene and Holocene caribou, elk, and moose fossil specimens originate from Qikiqtaruk (Herschel Island), southern Beaufort Sea, and the Klondike region of west-central Yukon Territory (Fig. 3). These specimens are curated in the fossil collections of the Yukon Palaeontology Program of the Yukon Government in Whitehorse, Yukon (specimen prefix YG = Yukon Government). Antlers naturally shed by modern caribou were obtained over multiple years from the collections of the Bowmanville Zoo, located in Bowmanville, Ontario, Canada (specimen BZ = Bowmanville Zoo). Coeval skeletal material from these caribou was not available, as none had died recently. As such, the only bone tissue sample available from Bowmanville Zoo during the time of our sampling was from a recently deceased Ankole-Watusi bull. For ease of handling, the zookeepers sampled the easily removed dewclaw bone, which is a vestigial digit in cattle.

Figure 3. Map of sample collection locations, with inset detail of paleo-sample collection locations. QI, Qikiqtaruk (Herschel Island); KD, the Klondike; BZ, Bowmanville Zoo. The modern samples were collected at a site distant from the paleo-samples.
Collagen Extraction
Individual bone and antler samples were removed using a Dremel drill fit with a cutting wheel blade. Serial sampling along the length of antlers was performed using a 0.625 cm drill core attached to a drill press. Serial samples were taken every ~10 cm along one side of the main antler beam, with the base of the antler designated as 0 cm (Fig. 1). Cancellous bone was removed from bone samples to allow for sampling of purely cortical bone. Outer antler tissue was preferentially sampled when antler thickness permitted. All antlers were fully mineralized, and no velvet remained.
Collagen extraction was performed at room temperature following the modified Longin method (Longin Reference Longin1971; Schwartz-Narbonne et al. Reference Schwartz-Narbonne, Longstaffe, Kardynal, Druckenmiller, Hobson, Jass, Metcalfe and Zazula2019). Samples were dissolved for 24 h in 0.25 M HCl, and subsequently in 0.5 M HCl, during which time the acid was refreshed every 1–3 days until the tissues were fully demineralized. Samples were then rinsed three times with deionized water. Humic substances were removed using 0.1 M NaOH treatment for 20 min at room temperature, which was repeated until the liquid remained colorless. Samples were then rinsed seven times with deionized water, and the pH was adjusted to <3. Samples were then placed in a 90°C oven for ~16 h to solubilize the collagen. The solubilized collagen was decanted and dried at 90°C and then weighed for stable isotope analysis.
Stable Isotope Measurements
The collagen δ13C and δ15N were measured using a Costech elemental analysis (EA) combustion system (ECS 4010) attached to a Thermo Scientific Delta V isotope ratio mass spectrometer (IRMS) operated in continuous-flow mode with helium as the carrier gas. Collagen samples were measured over a total of 11 analytical sessions. The stable carbon isotope data were calibrated to VPDB using a two-point scale anchored by either NBS-22 (accepted δ13C = −30.03‰; ±0.0‰ 1 SD, n = 3) (Coplen et al. Reference Coplen, Brand, Gehre, Gröning and Meijer2006) and IAEA-CH-6 (accepted δ13C = −10.45‰; ±0.2‰ SD, n = 18) (Coplen et al. Reference Coplen, Brand, Gehre, Gröning and Meijer2006), or USGS-40 (accepted δ13C = −26.39‰; ±0.0‰ SD, n = 21) (Coplen et al. Reference Coplen, Brand, Gehre, Gröning and Meijer2006) and USGS-41 (accepted δ13C = +37.63‰; ±0.1‰ SD, n = 24) (Coplen et al. Reference Coplen, Brand, Gehre, Gröning and Meijer2006). The nitrogen isotope data were calibrated to AIR using a two-point scale anchored by USGS-40 (accepted δ15N = −4.52‰; ±0.1‰ SD, n = 21) (Qi et al. Reference Qi, Coplen, Geilmann, Brand and Böhlke2003) and either IAEA-N2 (accepted δ15N = +20.39‰; ± 0.2‰ SD, n = 15) (Qi et al. Reference Qi, Coplen, Geilmann, Brand and Böhlke2003) or USGS-41 (accepted δ15N = +47.57‰; ±0.2‰ SD, n = 24) (Qi et al. Reference Qi, Coplen, Geilmann, Brand and Böhlke2003). These standards were also used to calibrate the carbon and nitrogen contents and to calculate the atomic C/N ratio of each sample. Standards not used in the calibration curve were measured as unknowns to monitor instrument accuracy and precision. Every analytical session also included a keratin in-house standard (MP Biomedicals, cat. no. 90211, lot no. 9966H) for which the following average results (SD) were obtained (n = 38): δ13C = −24.1 ± 0.1‰, δ15N = +6.3 ± 0.1‰, and atomic C/N ratio = 3.7 ± 0.1. These results compare well with the accepted values of δ13C = −24.0‰, δ15N = +6.4‰, and atomic C/N ratio of 3.7. A subset of samples (n = 14) were analyzed in duplicate or triplicate; reproducibility (SD) ranged from ±0.0 to ±0.2‰ for δ13C, and from ±0.0 to ±0.3‰ for δ15N.
Amino Acid δ15N Measurements
In preparation for isotopic analysis, collagen was hydrolyzed into its constituent amino acids, which were then derivatized following the N-acetyl-methyl ester derivatives (NACME) procedure (Corr et al. Reference Corr, Berstan and Evershed2007a,Reference Corr, Berstan and Evershedb; Styring et al. Reference Styring, Sealy and Evershed2010). Approximately 6 mg of collagen was dissolved in 2 ml of double-distilled 6 N HCl and vortexed, and the air in the sample tube was replaced with N2(g). Samples were then heated at 100°C–110°C for 24 h, followed by drying at 40°C under a gentle stream of N2(g). The hydrolyzed amino acids were then dissolved in 2 ml of methanol and stored at −25°C until derivatization. At this point, a 0.5 ml aliquot was taken, and 0.5 ml of 0.2 mg norleucine/ml methanol was added as an internal standard. Methanol was removed by drying under a gentle stream of N2(g) at room temperature. A 1.85 M acidified methanol solution was prepared by dropwise addition of 0.8 ml of acetyl chloride to 5 ml of anhydrous methanol in an ice or dry ice bath. One milliliter of acidified methanol was added to each sample, and samples were vortexed and then heated at 75°C for 1 h. Samples were then dried in an ice bath using a gentle stream of N2(g). One milliliter of dichloromethane (DCM) was added to each sample, and the resulting liquid was dried in an ice bath using a gentle stream of N2(g). Addition of DCM and subsequent drying of the sample were repeated three times, after which the samples were stored at −25°C overnight.
A solution of acetic anhydride, triethylamine, and acetone (1 ml:2 ml:5 ml) was then prepared, of which 1 ml was added to each sample. Samples were then vortexed and heated at 60°C for 10 min, followed by drying in an ice bath under N2(g). To extract the organic phase, 2 ml of ethyl acetate and 1 ml of saturated NaCl in MilliQ water were added to each sample, and the solution was shaken. After the inorganic and organic phases had separated, the organic phase was transferred by pipette to another vial. An additional 1 ml of ethyl acetate was then added to the inorganic phase to ensure complete removal of the organic phase. The extracted organic phases were combined and evaporated to dryness in an ice bath under a gentle stream of nitrogen. One milliliter of DCM was then added to each sample, and the solution was evaporated in an ice bath using a gentle stream of N2(g). This step was repeated three times. Each sample was then dissolved in 50 μl of ethyl acetate and vortexed, following which a 25 μl aliquot was removed for nitrogen isotope analysis. Samples were stored at −25°C until the isotopic analysis was performed.
Amino acid δ15N was measured using an Aligent 6890N-Thermo Scientific Gas Chromatograph-Combustion 3-Thermo Scientific DeltaPlus XL (GC-C-IRMS). The GC ramping program used follows Styring et al. (Reference Styring, Sealy and Evershed2010) with minor adjustments, beginning at 60°C (1 min), ramping up at 15°C/min to 120°C, 3°C/min to 190°C, and then at 5°C/min to a final temperature of 250°C (15 min). An Agilent Technologies VF-23MS column was used in the GC. Samples were injected in splitless mode at an injection temperature of 200°C. Samples were oxidized over CuO/NiO/Pt at 940°C and reduced over Cu at 650°C. The nitrogen gas from the sample was isolated by passing the gas through a liquid nitrogen trap using helium flowing at a rate of 2ml/min. Three reference gas pulses were introduced into the IRMS at the beginning of each analytical session, and one pulse was introduced at the end of each session. The isotopic composition of the reference gas was calibrated using four amino acid standards. Three of these standards, alanine, leucine, and phenylalanine, were purchased as their NACME derivatives from Sigma Aldrich. The fourth, proline, was purchased as an amino acid and derivatized in-house. The nitrogen isotope compositions of the derivatized standards were established by multiple measurements of their isotope ratios by EA-IRMS, as described earlier for bulk collagen.
All samples were analyzed in triplicate. An internal standard, norleucine, was analyzed as an unknown, along with the samples. Norleucine δ15N was offset from the expected values by +1.0 to +4.3‰, with an average offset of +2.5‰ and an average reproducibility of ±1.3‰ for triplicate measurements. A graph of proline versus hydroxyproline δ15N produces a linear relationship (R2 = 0.95; y = 1.2x − 0.9) within the expected 1:1 relationship (O'Connell and Collins Reference O'Connell and Collins2018), accounting for instrumental error.
Radiocarbon Dating and Suess Effect Correction of δ13C
Radiocarbon (14C) dates were obtained for a subset of antler and bone samples. Collagen was extracted, combusted, graphitized, and dated at the University of Arizona Accelerator Mass Spectrometry (AMS) Laboratory. Dates are presented as uncalibrated radiocarbon years before present (1950 AD) and are listed in Tables 1–3 alongside previously published results (Kristensen and Heffner Reference Kristensen and Heffner2011; Meiri et al. Reference Meiri, Lister, Collins, Tuross, Goebel, Blockley, Zazula, van Doorn, Guthrie, Boeskorov and Baryshnikov2014; Schwartz-Narbonne et al. Reference Schwartz-Narbonne, Longstaffe, Kardynal, Druckenmiller, Hobson, Jass, Metcalfe and Zazula2019). Dated samples covered a wide range, from nonfinite dates (YG 404.657) to post–Industrial Revolution/post-bomb (YG 381.52).
Table 1. Sample collection information.

Table 2. Cervid antler collagen bulk stable carbon and nitrogen isotope measurements, C and N elemental data (%), and preservation parameters. Average values for duplicate or triplicate analyses are indicated in bold font.

Table 3. Paired bone and antler collagen bulk stable carbon and nitrogen isotope measurements, offset between tissues (ΔB − A), C and N elemental data (%), and preservation parameters. “Single” refers to specimens from which only a single sample was taken. Averages for samples analyzed in duplicate are shown in bold font. *Average isotopic and elemental compositions are listed for serially sampled antler YG 381.52.

While the δ13C of atmospheric CO2 varied somewhat during the Pleistocene and pre–Industrial Revolution Holocene, it has decreased substantially since the advent of fossil fuel use, a change commonly referred to as the Suess effect (Long et al. Reference Long, Sweitzer, Diefenbach and Ben-David2005). The δ13C of the post-bomb sample (YG 381.52) was therefore corrected, following the formula of Long et al. (Reference Long, Sweitzer, Diefenbach and Ben-David2005), to the value for atmospheric δ13C before the Industrial Revolution. As samples covered a wide range of Pleistocene and Holocene ages, we followed previous work and corrected to the last glacial maximum as a known point for comparison (Tahmasebi et al. Reference Tahmasebi, Longstaffe and Zazula2018). Because an exact date for this specimen is not known, the midpoint (1987) between the start of the post-bomb time period (1964) and the year of collection (2009) was used to make the correction. In the absence of radiocarbon dates, a Suess correction cannot be made for the smaller shifts in atmospheric CO2 δ13C during the Pleistocene and Holocene. Hence, no direct comparisons were made among the δ13C of the Quaternary samples. Plant δ15N baselines are hypothesized to have shifted during the Quaternary (Tahmasebi et al. Reference Tahmasebi, Longstaffe and Zazula2018; Schwartz-Narbonne et al. Reference Schwartz-Narbonne, Longstaffe, Kardynal, Druckenmiller, Hobson, Jass, Metcalfe and Zazula2019), and so direct comparisons were also not made among samples for δ15N.
Results
Information about the origin and age of the paleontological specimens is summarized in Table 1. Bulk antler measurements are listed in Table 2. The surface area of the pedicle (Miller et al. Reference Miller, Druckenmiller and Bahn2013) and the total size of the caribou antlers were used to identify male versus female animals. Bulk stable isotope measurements for paired antler and bone collagen samples from Yukon Territory are listed in Table 3, and bulk measurements for antler (caribou) and bone (Ankole-Watusi bull) collagen from the Bowmanville Zoo are listed in Table 4. Table 5 provides the nitrogen isotope results for amino acid phenylalanine and glutamate from the Bowmanville Zoo collagen samples.
Table 4. Bowmanville Zoo animal bone and antler collagen bulk stable carbon and nitrogen isotope measurements, C and N elemental data (%), and preservation parameters. Averages for samples analyzed in duplicate are shown in bold font.

Table 5. δ15NPhe, δ15NGlu and Δ15NGlu-Phe data. Results for amino acids (Glu and Phe) are averages of triplicate measurements.

Preservation
All collagen samples were considered well preserved based on preservation parameters (collagen yield and atomic C/N) (Tables 2–4). In all cases, collagen extraction yields were >1%, atomic C/N ratios were between 2.9 and 3.6, and carbon and nitrogen contents were ≥13 wt.% for carbon and ≥4.8 wt.% for nitrogen (DeNiro Reference DeNiro1985; Ambrose Reference Ambrose1990; van Klinken Reference Van Klinken1999).
Collagen Stable Carbon and Nitrogen Isotope Compositions
Changes in Antler δ13CColl and δ15NColl
A small but measurable change in carbon and/or nitrogen isotope compositions was observed along the length of four out of the eight serially sampled antlers (Fig. 4, Table 3). Length of antler was not a determining factor for the presence or absence of isotopic variation. Antlers from two species (moose and caribou) exhibited changes in isotopic composition that were greater than twice instrumental analytical error (2 × ±0.2‰ for δ13C, 2 × ±0.3‰ for δ15N). Values of δ13CColl decreased with antler growth in YG 109.9 (−0.5‰; Fig. 4B) and YG 404.657 (−1.1‰; Fig. 4C). Values of δ15NColl increased in YG 381.52 (+0.8‰; Fig. 4A) and YG 190.1 (+0.8‰; Fig. 4G) with progressive growth of the antler. There were no significant variations in the “along-antler” isotopic compositions for the other four samples (two elk, one caribou, and one moose). Paired bone and antler collagen samples from individual specimens had different isotopic compositions (n = 2; Alces alces and Rangifer tarandus) (Table 3).

Figure 4. Antler δ13CColl (left) and δ15NColl (right): A, female caribou antler, post-bomb, YG 381.52; B, female caribou antler, undated, YG 109.9; C, male caribou antler, >41,100 14C BP, YG 404.657; D, male caribou antler, 29,570 ± 970 14C BP, YG 306.468; E, male elk antler, 11,675 ± 45 14C BP, YG 104.4; F, male elk antler, 9064 14C BP, YG 420.1; G, male moose antler, undated, YG 190.1; and H, moose antler, 1363 ± 35/1197 ± 27 14C BP, YG 162.46. Black stars indicate specimens from Qikiqtaruk (Herschel Island). Variations greater than twice experimental error were measured for δ13CColl in YG 109.9 and YG 404.657 and for δ15NColl in YG 381.52 and YG 190.1.
Δ15NGlu-Phe
The δ15N of amino acids Phe and Glu were measured in several samples of caribou antler and one sample of dewclaw bone from an Ankole-Watusi bull. Both species are ruminants and originated from the Bowmanville Zoo (Table 5). The turnover rate of dewclaw bone, a vestigial digit, is unknown. These results are illustrated in Figure 5, together with data from the literature for bone, tooth dentin, and tooth cement collagen for mammalian herbivore species (Naito et al. Reference Naito, Honch, Chikaraishi, Ohkouchi and Yoneda2010, Reference Naito, Chikaraishi, Ohkouchi, Drucker and Bocherens2013; Styring et al. Reference Styring, Sealy and Evershed2010; Schwartz-Narbonne et al. Reference Schwartz-Narbonne, Longstaffe, Metcalfe and Zazula2015; Kendall et al. Reference Kendall, Lee and Evershed2017). The expanded dataset includes wild cervid bone collagen (Styring et al. Reference Styring, Sealy and Evershed2010; Naito et al. Reference Naito, Chikaraishi, Ohkouchi, Drucker and Bocherens2013) and tooth dentin collagen from pastured adult cattle (Kendall et al. Reference Kendall, Lee and Evershed2017).

Figure 5. Collagen Δ15NGlu-Phe from a variety of mammals. Caribou antler, open diamonds; ruminant bone and teeth, open circles; terrestrial carnivore bone, open triangles; high-marine-protein predator bone, filled triangles. The isotopic data for bone from ruminants, carnivores, and high-marine-protein consumers were obtained from the literature (Naito et al. Reference Naito, Honch, Chikaraishi, Ohkouchi and Yoneda2010, Reference Naito, Chikaraishi, Ohkouchi, Drucker and Bocherens2013; Styring et al. Reference Styring, Sealy and Evershed2010; Schwartz-Narbonne et al. Reference Schwartz-Narbonne, Longstaffe, Metcalfe and Zazula2015; Kendall et al. Reference Kendall, Lee and Evershed2017), with the exception of the Ankole-Watusi bull, which was analyzed in the present study. Herbivore Δ15NGlu-Phe values for specimens in this study are consistently lower than those of carnivores.
Discussion
Are Antler and Bone Metabolically Equivalent?
The impact of metabolic processes on antler tissue formation must be understood before interpreting antler collagen carbon and nitrogen isotope signals. We first needed to establish if the isotopic offset between diet and collagen is the same for both bone and antler or the offset for antler includes an additional shift caused by its faster growth rate than bone. If the offset is the same, it can be reasonably assumed that the δ13C and δ15N of both bone and antler tissues correlate with diet or seasonally determined physiological changes (i.e., starvation), rather than additional tissue-specific metabolic processes. Prior studies discuss rapid growth rate as a potential control on the δ15N of collagenous tissues (Trueman et al. Reference Trueman, McGill and Guyard2005; Waters-Rist and Katzenberg Reference Waters-Rist and Katzenberg2010; Madgwick et al. Reference Madgwick, Sykes, Miller, Symmons, Morris and Lamb2013; Osborne Reference Osborne2017); accordingly, nitrogen isotopes were the focus of our investigation.
Our examination of caribou antler collagen Δ15NGlu-Phe used animals from a zoo population that consumed grass present in their enclosure as well as feed (e.g., grain) provided as a supplement. The antler bulk collagen δ13C suggests a mixed C3/C4 diet (unpublished data), which is consistent with both C3 and C4 plants growing in Ontario. Use of a captive population allowed us to control for physiological sources of 15N enrichment in antlers other than rapid growth, as these animals did not experience dietary stress or nutritional deficiencies. Only one bone specimen was available from Bowmanville Zoo, and it was from a non-cervid species not indigenous to North America (Ankole-Watusi bull). We therefore supplemented our results with published values for bone and tooth collagen Δ15NGlu-Phe, which included ruminant herbivores (cow, buffalo, sheep, steenbok, deer, elk, and auroch), as well as terrestrial carnivores and high-marine-protein consumers (Naito et al. Reference Naito, Honch, Chikaraishi, Ohkouchi and Yoneda2010, Reference Naito, Chikaraishi, Ohkouchi, Drucker and Bocherens2013; Styring et al. Reference Styring, Sealy and Evershed2010; Schwartz-Narbonne et al. Reference Schwartz-Narbonne, Longstaffe, Metcalfe and Zazula2015; Kendall et al. Reference Kendall, Lee and Evershed2017) (Fig. 5). The use of Δ15NGlu-Phe largely corrects for the variability in isotopic composition among diets, thus allowing for more direct comparisons to be made. The Bowmanville Zoo caribou antler collagen Δ15NGlu-Phe values lie within the range previously reported for ruminant collagenous tissues (Fig. 5). While variation in herbivore diets may have increased the range of Δ15NGlu-Phe (Kendall et al. Reference Kendall, Woodward, Clark, Styring, Hanna and Evershed2019), all the herbivore collagenous tissues (antler, bone, and teeth) have lower Δ15NGlu-Phe than carnivorous species from higher trophic levels (Fig. 5), both in modern and Pleistocene specimens. In particular, the caribou antler collagen had Δ15NGlu-Phe similar to modern adult pastured-cow dentin collagen (M3 molar) (Kendall et al. Reference Kendall, Lee and Evershed2017). This outcome suggests that nitrogen recycling did not occur in antlers more than in other collagenous tissues and that the 15N enrichment of antlers is controlled by diet, and largely unaffected by additional metabolic process.
Our findings are consistent with those of prior bulk collagen isotopic studies. Stevens and O'Connell (Reference Stevens and O'Connell2016) noted that the pattern of increasing δ15N from antler base to the tip was not consistent with rapid growth as the primary control on the nitrogen isotope signal. If such was the case, an S-shaped δ15N pattern would be expected, as initial antler growth is relatively slow, followed by a period of exponential growth and then a final period of slow growth before antler death (Stevens and O'Connell Reference Stevens and O'Connell2016). Darr and Hewitt's (Reference Darr and Hewitt2008) feeding study also suggests that physiological mechanisms are not the primary control on antler δ13C and δ15N. Their measured enrichments in 13C and 15N from diet to antler were consistent with such increases from diet to bone reported in similar studies (Cormie and Schwarcz Reference Cormie and Schwarcz1994; Koch et al. Reference Koch, Fogel, Tuross, Lajtha and Michener1994).
Are Antler and Bone Isotopically Equivalent?
Prior work established that antler and bone collagen are not isotopically equivalent (Miller et al. Reference Miller, Carden, Evans, Lamb, Madgwick, Osborne, Symmons and Sykes2016; Stevens and O'Connell Reference Stevens and O'Connell2016), as was also observed in this study (Table 3). Antler and bone incorporate dietary signals on different temporal scales. Seasonal changes in diet and physiology (e.g., winter nutritional stress) may influence the signals. In our study, undated moose bone collagen δ15N was higher than antler collagen δ15N, without an accompanying increase in δ13C (Table 3). Modern Klondike-region moose forage on aquatic plants in wetlands (Clarke Reference Clarke2012), which would be expected to result in lower rather than higher bone collagen δ15N. However, wetland extent varies with climate (Malcolm Reference Malcolm, Gjørv, Bazely, Goloviznina and Tanentzap2013), and even when aquatic plants are available, they can compose variable proportions of the moose diet (McMillan Reference McMillan1953; Drucker et al. Reference Drucker, Hobson, Ouellet and Courtois2010). Even moderate winter dietary stress is known to cause 15N enrichment in cervid tissues (Parker et al. Reference Parker, Barboza and Stephenson2005), though the magnitude of the effect is disputed by some (see Drucker et al. Reference Drucker, Hobson, Münzel and Pike-Tay2012). Such signals would be recorded in annually deposited bone, but not seasonally deposited antler collagen, as antler is either shed, or is dead tissue, during the winter. Dietary stress seems the most parsimonious explanation for the isotopic compositions of undated moose YG 193.1. Qikiqtaruk caribou bone collagen was enriched in 13C and 15N relative to antler from the same individual. The δ13C results are consistent with other isotopic studies of seasonal changes in caribou proteinaceous tissues (bone collagen, tooth dentin collagen, and hoof keratin), potentially relating to winter consumption of 13C-rich lichen (Barnett Reference Barnett1994; Drucker et al. Reference Drucker, Bocherens, Pike-Tay and Mariotti2001, Reference Drucker, Hobson, Münzel and Pike-Tay2012). Previous studies found varying, or no, seasonal patterns in caribou tissue δ15N (Barnett Reference Barnett1994; Drucker et al. Reference Drucker, Bocherens, Pike-Tay and Mariotti2001, Reference Drucker, Hobson, Münzel and Pike-Tay2012). Our work supports the hypothesis that winter dietary stress is recorded in bone collagen δ15N and that these high-latitude individuals experienced such stress.
Do Intra-antler Isotopic Differences Reflect Changes in Diet?
The small sample set, covering a range of species, locations, and time intervals within the Quaternary renders it difficult to discern a consistent pattern in the stable carbon and nitrogen isotope variations. Consideration of these results plus prior isotopic studies of antlers and other temporally variable tissues, however, suggests some general observations:
1. Antler collagen δ13C and δ15N can be indicative of trophic niche width, where less isotopic variation equates to less available dietary choice or participation in specialist feeding behavior. Both Darr and Hewitt's (Reference Darr and Hewitt2008) controlled feeding study of white-tailed deer and Finstad and Kielland's (Reference Finstad and Kielland2011) study of captive versus free-ranging caribou populations observed small, or no, isotopic changes within antlers from individuals with reduced dietary variability. Based on this concept, the four antlers that displayed no notable change in δ13C and δ15N (Pleistocene male caribou, Fig. 4D, YG 306.468; Pleistocene–Holocene boundary elk, Fig. 4E, YG 104.4; early Holocene elk, Fig. 4F, YG420.1; an undated moose antler, Fig. 4H, YG 162.46) may reflect dietary specialists. Dietary specialization may be caused by a number of factors such as interspecies or intraspecies competition for resources, individual dietary preferences, small range sizes, or lack of varied forage types within a large habitat. Contemporary climate change is causing terrestrial herbivores to migrate northward to track their optimal habitat, with adverse effects for species unable to colonize new habitats (Gilg et al. Reference Gilg, Kovacs, Aars, Fort, Gauthier, Grémillet, Ims, Meltofte, Moreau, Post and Schmidt2012). Small range sizes and dependence on specialized diets may therefore be risk factors for cervid populations adapting to climate change.
2. Changes in antler collagen δ13C and δ15N can produce results generally consistent with expected dietary shifts in δ13C and/or δ15N. Finstad and Kielland (Reference Finstad and Kielland2011) observed an increase in antler δ15N over time consistent with increased consumption of graminoids and forbs during the transition of spring to summer, and a similar increase in antler δ15N was observed for one female caribou antler in this study (post-bomb, Fig. 4A, YG 381.52). In a modern Alaskan caribou herd, low δ15NColl in antler deposited in early spring correlated with winter dietary stress, likely because these individuals sought out high-protein shrubs rather than grasses to consume (Finstad and Kielland Reference Finstad and Kielland2011). Unfortunately, without a larger dataset with strong temporal control, similar comparisions between Pleistocene antler δ15NColl cannot be made here. Only limited research has been done correlating antler δ13C to diet; however, temporally based shifts in caribou δ13C of hoof keratin and tooth dentin collagen (Barnett Reference Barnett1994; Drucker et al. Reference Drucker, Bocherens, Pike-Tay and Mariotti2001, Reference Drucker, Hobson, Münzel and Pike-Tay2012) have been observed and attributed in part to a reduction in consumption of 13C-rich lichen as other, more protein-rich forage became available in spring and summer. This shift is consistent with one female caribou antler (undated, Fig. 4B, YG 109.9), and one male caribou antler (nonfinite date, Fig. 4C, YG 404.657) measured here. Differences in caribou δ13C of hair keratin grown in summer were related to differing summer avaliability of nonmycorrhizal vascular plants between sites (Zhao et al. Reference Zhao, Colman, Irvine, Karlsen, Olack and Hobbie2019); again, a larger sample set with strong temporal control is needed for similar comparisons within a Pleistocene dataset. Similarly, studies of serially sampled moose hooves found higher δ15N in layers grown during the summer, related to increased consumption of aquatic plants (see Fig. 2) (Kielland Reference Kielland2001; Tischler et al. Reference Tischler, Severud, Peterson and Bump2019). This is consistent with the pattern observed here for the undated moose antler (Fig. 4G, YG 190.1). Seasonal shifts in Pleistocene caribou diet, as observed in specimen YG 404.657, would be consistent with the hypothesis of Schwartz-Narbonne et al. (Reference Schwartz-Narbonne, Longstaffe, Kardynal, Druckenmiller, Hobson, Jass, Metcalfe and Zazula2019) that the Pleistocene dietary niche of caribou changed seasonally. However, a seasonal dietary shift was not observed in Pleistocene caribou antler specimen YG 306.468. Further study of dated caribou antlers is necessary to test this hypothesis.
Results of previous studies are currently insufficent to explain the entirety of our intra-antler variability, particularly where the expected signal response in one isotope was observed, but the corresponding signal in the other isotope was not. For example, an increasing δ15N consistent with summer consumption of 15N-rich aquatic plants was observed for the undated moose antler (Fig. 4G, YG 190.1); however, the expected corresponding increase in δ13C from consumption of 13C-rich aquatic plants did not occur. Such decoupling of the stable carbon and nitrogen isotope signals has been observed previously for cervid tissues (Drucker et al. Reference Drucker, Bocherens, Pike-Tay and Mariotti2001, Reference Drucker, Hobson, Ouellet and Courtois2010; Walter and Leslie Reference Walter and Leslie2009) and merits further study. A more comprehensive model incorporating a range of controls, including forage isotopic composition, protein content, and nutritional stress, may be needed to fully deconvolute antler isotopic signals. Our work is insufficient to resolve these questions, but it highlights the value of such an investigative approach to paleoecological and modern ecological studies.
Conclusion
Antler collagen Δ15NGlu-Phe is consistent with ruminant bone and tooth collagen Δ5NGlu-Phe, suggesting that rapid growth is not a primary isotopic control on antler δ15N and that the metabolic processes affecting antlers are similar to those occurring in other collagenous tissues. We therefore suggest two applications of antler δ13CColl and δ15NColl measurements. First, antlers can be used to assess changes in diet during the spring and early summer. Antlers with lower isotopic variability likely represent dietary/habitat specializations or limited dietary choice during the spring and summer months. Second, antler δ13CColl and δ15NColl reflect environmental and dietary signals acquired during spring and early summer, while bone collagen records an average multiyear signal. Hence, antler isotopic signals can be used to compare spring and early summer conditions to yearly conditions in ancient ecosystems. Additional studies employing larger sample sizes of both wild and captive cervid populations are needed to better understand the causes of variability in antler stable carbon and nitrogen isotope compositions before this tissue can be fully integrated in the isotopic toolbox for paleoenvironmental studies.
Acknowledgments
We thank K. Law and L. Huang for technical advice. Samples were collected with the permission of the Yukon Government Palaeontology Program and the Bowmanville Zoo. We are grateful to the placer gold mining community and the Tr'ondëk Hwëch'in First Nation for their continued support and partnership with our research in the Klondike goldfields region. We thank the people of the Inuvialuit Settlement Region, along with the Herschel/Qikiqtaruk Territorial Park Management Committee, which includes Yukon Parks, the Wildlife Management Advisory Committee, the Aklavik Hunters and Trappers Committee, the Aklavik Community Corporation, and the Yukon Government Cultural Services Branch, for support of research at Qikiqtaruk/Herschel Island. We thank Bowmanville Zoo staff for information on animal diets. G. Hodgins and the staff at the National Science Foundation Arizona AMS Laboratory assisted with the radiocarbon dating. K. Allan drew the artwork for Figures 1 and 3. We thank the editor and two anonymous reviewers for constructive comments that improved the article. Funding was provided by a Natural Sciences and Engineering Research Council of Canada (NSERC) Discovery Grant (F.J.L.), and an NSERC Canada Graduate Scholarship, an NSERC Postgraduate Scholarship, and an Ontario Graduate Scholarship (all to R.S.-N.). Laboratory infrastructure was funded by the Canada Foundation for Innovation (F.J.L.) and the Ontario Research Fund (F.J.L.). Additional time for research was funded through the Canada Research Chairs program (F.J.L.). The Western Graduate Research Fund (R.S.-N.) funded one radiocarbon date. This is Laboratory for Stable Isotope Science Contribution no. 340.


 Open access