


Non-technical Summary
Conodonts were marine vertebrates with tooth-like structures that are commonly preserved in the fossil record. The Late Triassic conodont species Mockina ex gr. carinata and Mockina ex gr. englandi were exceptionally prevalent among marine animals from the middle Norian through to the Rhaetian stages of geologic time. Leading into the complete extinction of conodonts near the Triassic/Jurassic boundary, a significant change in conodont forms occurred across the Norian/Rhaetian boundary (NRB), with the common Rhaetian varieties from Europe exhibiting thinner shapes. This trend is not as evident in North America, where these varieties are very rare, but analyses on M. ex gr. carinata and M. ex gr. englandi specimens from across western Canadian demonstrate that comparable shifts in form occurred in North America across the NRB, confirming the global extent of these trends. The specimens of M. ex gr. carinata display a sequential width reduction from the middle Norian to late Norian to Rhaetian, whereas the specimens of M. ex gr. englandi display a width reduction only from the late Norian to Rhaetian. Specimens of both species that have a length to mid-breadth ratio greater than 3:1 are restricted to the Rhaetian. Specimens from the Kennecott Point section on Haida Gwaii, British Columbia, demonstrate that this shift in form occurred somewhat later than other events and changes associated with the NRB. The global trend of width reduction in many conodonts may reflect a change in diet away from hard food sources, perhaps suggesting some degree of pressure on the biological precipitation of minerals beginning around the NRB. This interpretation would support CO2 release as the causal mechanism of the environmental disturbance at the NRB and identify the NRB as a significant turning point for Late Triassic ecosystems, marking the beginning of a protracted, multiphase end-Triassic mass extinction.
Introduction
The Middle to Late Triassic was a unique time in geologic history in which “modern fauna” was first able to extensively radiate and thrive following the drawn-out aftermath of the Permian/Triassic mass extinction (e.g., Sepkoski Reference Sepkoski1981; Raup and Sepkoski Reference Raup and Sepkoski1982). During this interval, the global biosphere experienced a short-lived diversity peak in the Late Triassic, before being devastated by the subsequent end-Triassic mass extinction (ETME) (e.g., Sepkoski Reference Sepkoski1981; Raup and Sepkoski Reference Raup and Sepkoski1982). Much emphasis has been placed on investigating both of these mass extinctions, but research on the broader paleobiologic trends across the Late Triassic has been much less common. Mass extinction events are traditionally thought of as geologically instantaneous, but there is considerable evidence that the paleoenvironmental disturbance and biotic distress associated with the ETME began before the actual Triassic/Jurassic boundary (e.g., Hesselbo et al. Reference Hesselbo, Robinson, Surlyk and Piasecki2002; Ward et al. Reference Ward, Garrison, Haggart, Kring and Beattie2004; Ruhl and Kürschner Reference Ruhl and Kürschner2011; Schoepfer et al. Reference Schoepfer, Algeo, Ward, Williford and Haggart2016; Davies et al. Reference Davies, Marzoli, Bertrand, Youbi, Ernesto and Schaltegger2017; Yager et al. Reference Yager, West, Corsetti, Berelson, Rollins, Rosas and Bottjer2017; Larina et al. Reference Larina, Bottjer, Corsetti, Zonneveld, Celestian and Bailey2019). Some have even argued that the ETME may be better characterized as the aggregation of multiple temporally disparate biotic turnover events throughout the latest Triassic, beginning as early as the Norian/Rhaetian boundary (NRB) (e.g., Hallam Reference Hallam2002; Tanner et al. Reference Tanner, Lucas and Chapman2004; Lucas Reference Lucas and Tanner2018; Rigo et al. Reference Rigo, Mazza, Karádi, Nicora and Tanner2018, Reference Rigo, Onoue, Tanner, Lucas, Godfrey, Katz and Zaffani2020). Many faunal groups experienced significant turnover at the NRB, including bivalves, conodonts, radiolarians, and ammonoids (e.g., Ward et al. Reference Ward, Haggart, Carter, Wilbur, Tipper and Evans2001, Reference Ward, Garrison, Haggart, Kring and Beattie2004; Tanner et al. Reference Tanner, Lucas and Chapman2004; Carter and Orchard Reference Carter and Orchard2007; Lucas Reference Lucas and Tanner2018; Rigo et al. Reference Rigo, Mazza, Karádi, Nicora and Tanner2018, Reference Rigo, Onoue, Tanner, Lucas, Godfrey, Katz and Zaffani2020). Recovery within these faunal groups was limited during the Rhaetian, potentially suggesting a prolonged interval of elevated environmental stress persisting after the NRB, which in turn contributed to the severity of the ETME, because a fragile biosphere would be more vulnerable to extinction pressures (e.g., Hallam Reference Hallam2002; Tanner et al. Reference Tanner, Lucas and Chapman2004; Lucas Reference Lucas and Tanner2018; Rigo et al. Reference Rigo, Mazza, Karádi, Nicora and Tanner2018, Reference Rigo, Onoue, Tanner, Lucas, Godfrey, Katz and Zaffani2020). For example, although coral reefs are present in Rhaetian strata, they are considerably smaller in size and less widespread compared with their Norian counterparts, with the latter representing peak diversity in the Triassic (e.g., Flügel and Kiessling Reference Flügel and Kiessling2002; Stanley Reference Stanley2003; Rigo et al. Reference Rigo, Onoue, Tanner, Lucas, Godfrey, Katz and Zaffani2020). It was these relatively less robust Rhaetian communities that were then subsequently devastated during the ETME (e.g., Flügel and Kiessling Reference Flügel and Kiessling2002; Stanley Reference Stanley2003; Rigo et al. Reference Rigo, Onoue, Tanner, Lucas, Godfrey, Katz and Zaffani2020).
While the primary trigger of the ETME has been broadly accepted as enhanced volcanic outgassing associated with the Central Atlantic Magmatic Province (CAMP) (Marzoli et al. Reference Marzoli, Renne, Piccirillo, Ernesto, Bellieni and De Min1999, Reference Marzoli, Bertrand, Knight, Cirilli, Buratti, Vérati and Nomade2004; Blackburn et al. Reference Blackburn, Olsen, Bowring, McLean, Kent, Puffer, McHone, Rasbury and Et-Touhami2013), the causal mechanism for disturbance at the NRB has remained elusive. A potential mechanism is volcanism preceding CAMP emplacement (e.g., Zaffani et al. Reference Zaffani, Agnini, Concheri, Godfrey, Katz, Maron and Rigo2017; Rigo et al. Reference Rigo, Onoue, Tanner, Lucas, Godfrey, Katz and Zaffani2020). This hypothesis is supported indirectly by decreasing 87Sr/86Sr ratios in seawater across the NRB, interpreted as an increase in weathering input of mantle-derived volcanics (Korte et al. Reference Korte, Kozur, Bruckschen and Veizer2003; Callegaro et al. Reference Callegaro, Rigo, Chiaradia and Marzoli2012; Tackett et al. Reference Tackett, Kaufman, Corsetti and Bottjer2014). However, this signal from the Tethyan realm (marine environment on the eastern margin of Pangea) has not been convincingly documented in the Panthalassan realm (marine environment on the western margin of Pangea), arguably undermining its supposed global extent (Lei et al. Reference Lei, Golding and Husson2022). Emplacement of the Angayucham Province in Alaska has been proposed as the source of this hypothetical volcanism at the NRB (Zaffani et al. Reference Zaffani, Agnini, Concheri, Godfrey, Katz, Maron and Rigo2017; Rigo et al. Reference Rigo, Onoue, Tanner, Lucas, Godfrey, Katz and Zaffani2020), but the poor precision of current age constraints (Ernst and Buchan Reference Ernst and Buchan2001) makes this link tenuous. The true driver of the NRB disturbance and faunal turnover therefore remains uncertain.
The ETME has long been held to mark the total extinction of the long-ranging class Conodonta (e.g., Clark Reference Clark1983), with perhaps just a handful of examples globally where rare conodont specimens are found in the earliest Hettangian (Pálfy et al. Reference Pálfy, Demény, Haas, Carter, Görög, Halász and Oravecz-Scheffer2007; Du et al. Reference Du, Chiari, Karádi, Nicora, Onoue, Pálfy, Roghi, Tomimatsu and Rigo2020b, Reference Du, Onoue, Tomimatsu, Wu and Rigo2023; Caruthers et al. Reference Caruthers, Marroquín, Gröcke, Golding, Aberhan, Them and Veenma2022). A general trend of declining conodont diversity is observed throughout the Late Triassic, indicating that the final extinction of the class may be better interpreted as the culmination of a multi-million-year process of deterioration rather than solely as the result of a sudden cataclysmic event (Martínez-Pérez et al. Reference Martínez-Pérez, Plasencia, Cascales-Miñana, Mazza and Botella2014a; Rigo et al. Reference Rigo, Mazza, Karádi, Nicora and Tanner2018). The latest Norian represents the last significant peak of conodont standing diversity, which then dropped precipitously across the Rhaetian Stage (Martínez-Pérez et al. Reference Martínez-Pérez, Plasencia, Cascales-Miñana, Mazza and Botella2014a; Rigo et al. Reference Rigo, Mazza, Karádi, Nicora and Tanner2018). This diversity trend points toward the NRB as being a crucially important interval in conodont evolutionary history, the study of which could lead to a better understanding of the ETME and paleoenvironmental conditions preceding it. This in turn may help in determining why the class went extinct during the ETME, after having survived the more severe Permian/Triassic mass extinction (e.g., Sepkoski Reference Sepkoski1981; Raup and Sepkoski Reference Raup and Sepkoski1982).
Conodont pectiniform element morphology displays a general trend of simplification across the NRB, with the forms of genera like Misikella and Parvigondolella, which dominate Rhaetian fauna, having minimal platforms or none at all (e.g., Orchard et al. Reference Orchard, Carter, Lucas and Taylor2007; Giordano et al. Reference Giordano, Rigo, Ciarapica and Bertinelli2010; Mazza et al. Reference Mazza, Rigo and Gullo2012; Rigo et al. Reference Rigo, Mazza, Karádi, Nicora and Tanner2018; Karádi et al. Reference Karádi, Cau, Mazza and Rigo2020; Du et al. Reference Du, Onoue, Karádi, Williams and Rigo2021, Reference Du, Onoue, Tomimatsu, Wu and Rigo2023). This is in contrast to the forms that dominate Norian fauna, such as the genera Epigondolella and Mockina, both of which commonly display prominent platforms hosting sharp and discrete platform denticles; another Norian example is the genus Norigondolella, which displays forms with prominent and anteriorly extended platforms, typically resulting in the absence of any free blade (e.g., Orchard Reference Orchard1991a,Reference Orchardb, Reference Orchard2018; Mazza et al. Reference Mazza, Rigo and Gullo2012; Rigo et al. Reference Rigo, Mazza, Karádi, Nicora and Tanner2018; Du et al. Reference Du, Onoue, Karádi, Williams and Rigo2021). The genus Misikella is commonly found in the Rhaetian of Tethys, but is extremely rare in the Rhaetian of Panthalassa, such that it has limited biostratigraphic utility in the latter region (Carter and Orchard Reference Carter and Orchard2007; Orchard et al. Reference Orchard, Carter, Lucas and Taylor2007). Comparable trends of platform reduction within pectiniform elements across the NRB interval can potentially still be observed in the morphologies of genera and species that are more abundant in Panthalassa, such as within Mockina mosheri. Morphotype B of this species ranges from the latest Norian through Rhaetian, in contrast with morphotypes A and C, which are exclusively Rhaetian (Orchard Reference Orchard and Stanley1994; Carter and Orchard Reference Carter and Orchard2007; Orchard et al. Reference Orchard, Carter, Lucas and Taylor2007). Morphotype B is unique in possessing accessory platform denticles, resulting in wider platforms overall compared with the exclusively Rhaetian forms (Orchard Reference Orchard and Stanley1994; Carter and Orchard Reference Carter and Orchard2007; Orchard et al. Reference Orchard, Carter, Lucas and Taylor2007). However, any platform reduction exhibited by M. mosheri is considerably less clear than the intergeneric Tethyan trends, as the stratigraphic ranges of all three morphotypes are nearly identical, with morphotype B only differing from the others by extending slightly earlier into the latest Norian. Also, M. mosheri may not be the most representative species of Panthalassan fauna, as none of the morphotypes are particularly common in either the Norian or the Rhaetian.
The present study aims to investigate morphological shifts displayed by Mockina ex gr. carinata and Mockina ex gr. englandi as these conodont species cross the NRB. Pectiniform elements of these two conodont species have been recovered in exceptionally high abundance from North American strata (Panthalassan realm) ranging from the middle Norian through Rhaetian. Therefore, they make excellent candidates for the application of morphometric analysis to investigate trends in Panthalassan conodont pectiniform morphology across the NRB interval. No prior morphometric studies have been conducted on these two conodont species or on any conodont species crossing the NRB. If the intergeneric trends of pectiniform platform reduction largely observed in Tethys can also be recognized intraspecifically in species that dominate Panthalassa, this would greatly reinforce the hypothesis that these morphological shifts occurred in response to global-scale stressors.
Materials and Methods
The present study utilizes new and archival collections of Mockina ex gr. carinata and Mockina ex gr. englandi from across the Canadian Cordillera (Fig. 1). Limestone samples were processed for conodonts at the Geological Survey of Canada Pacific Division in Vancouver, British Columbia, using standard techniques as outlined by Stone (Reference Stone and Austin1987). Individual samples were crushed into ~3 cm fragments before being dissolved in acetic acid for 10–14 days. Per ~1 kg of sample, a solution of 6.0 liters of water, 3.2 liters of 10–15% acetic acid (to create a buffer), and 0.8–1.0 liter of 99.5% glacial acetic acid was used. The residues that remained after treatment were then sieved to collect the 90–850 μm fraction. The isolated fraction was rinsed, dried, and put through heavy-liquid separation using sodium polytungstate (specific gravity of 2.85 kg/L), with the heavy fraction collected.

Figure 1. Locations of all samples across western Canada from which specimens in the present study were recovered, color-coded by their terrane affinity. Select localities containing particularly productive sections are labeled by name. The western margin of Laurentia is in blue, including the Williston Lake sections. The Stikine Terrane is in green, including the Mount Sinwa and Hill 4308 sections. The Wrangell Terrane is in purple, including the Kyuquot Sound and Kennecott Point sections. The displayed extent of each terrane is from Colpron and Nelson (Reference Colpron and Nelson2011).
As the Canadian Cordillera comprises a multitude of allochthonous terranes (e.g., Monger and Ross Reference Monger and Ross1971; Jones et al. Reference Jones, Silberling and Hillhouse1977; Mihalynuk et al. Reference Mihalynuk, Nelson and Diakow1994; Belasky et al. Reference Belasky, Stevens and Hanger2002; Johnston and Borel Reference Johnston and Borel2007; Johnston Reference Johnston2008; Colpron and Nelson Reference Colpron and Nelson2009, Reference Colpron and Nelson2011; Kent and Irving Reference Kent and Irving2010; Beranek and Mortensen Reference Beranek and Mortensen2011), this sampling of specimens represents a wide paleogeographic distribution stretching from the western margin of Laurentia to the open Panthalassic Ocean during the Late Triassic (Fig. 1). Specimen counts classified by terrane affinity and age are summarized in Table 1, and a detailed list of samples can be found in the Supplementary Appendix. Particularly productive localities include the Black Bear Ridge section at Williston Lake representing the Laurentian margin, the Sinwa East section on Mount Sinwa representing the Stikine Terrane imminently converging with Laurentia, and the Kennecott Point section on Haida Gwaii representing the Wrangell Terrane in open ocean (e.g., Colpron and Nelson Reference Colpron and Nelson2009, Reference Colpron and Nelson2011; Fig. 1).
Table 1. Specimen counts of Mockina carinata and Mockina englandi grouped by terrane affinity and age.

Both M. ex gr. carinata and M. ex gr. englandi have previously been included in the genus Epigondolella, under a more expansive interpretation of that genus diagnosed by tall and discrete anterior platform denticles (e.g., Orchard Reference Orchard1991b; Carter and Orchard Reference Carter and Orchard2007; Orchard et al. Reference Orchard, Carter, Lucas and Taylor2007). More recent studies have generally reinterpreted these two species as belonging to the genus Mockina (e.g., Mazza et al. Reference Mazza, Rigo and Gullo2012; Orchard Reference Orchard2018; Du et al. Reference Du, Bertinelli, Jin, Shi, Karádi, Yin, Han, Wu and Rigo2020a; Caruthers et al. Reference Caruthers, Marroquín, Gröcke, Golding, Aberhan, Them and Veenma2022; Lei et al. Reference Lei, Golding and Husson2022). Mockina was initially proposed as a derivative of Epigondolella in which the bifurcated keel was lost entirely, resulting in a keel that terminates posteriorly in a single point (Kozur Reference Kozur1989a,Reference Kozurb). Current differentiation between these two genera also emphasizes the less-ornamented platforms of Mockina relative to those of Epigondolella (e.g., Mazza et al. Reference Mazza, Rigo and Gullo2012; Orchard Reference Orchard2018; Du et al. Reference Du, Bertinelli, Jin, Shi, Karádi, Yin, Han, Wu and Rigo2020a). Orchard (Reference Orchard1991b) initially defined M. carinata as a short species of Epigondolella with two large denticles on one anterior platform margin and one large denticle on the other (Fig. 2A). Additional smaller platform denticles continue posteriorly of the large main set (Orchard Reference Orchard1991b). Orchard (Reference Orchard1991b) defined the species M. englandi similarly, primarily differentiated from M. carinata by possessing only a single pair of large anterior platform denticles (one on each side of the element), typically resulting in a comparatively more bilaterally symmetric platform outline (Fig. 2B). Although M. englandi was originally defined by specimens displaying an ovoid platform, an abundance of specimens have since been recovered across western Canada that exhibit the strong anterior platform denticle pair, but with a wide variety of platform shapes. These varieties that deviate from the original diagnosis have been referred to as M. cf. englandi (Lei et al. Reference Lei, Golding and Husson2022). Initially, M. englandi was proposed to have developed from M. carinata in the late Norian via the loss of one anterior platform denticle (Orchard Reference Orchard1991b), but significant numbers of M. cf. englandi have subsequently been recovered from middle Norian strata. The present study does not differentiate M. cf. englandi from M. englandi for the purposes of analysis, resulting in M. ex gr. englandi being present in the middle Norian, late Norian, and Rhaetian. Similarly, the present study considers all specimens with the anterior platform denticle arrangement consistent with M. carinata as M. ex gr. carinata.
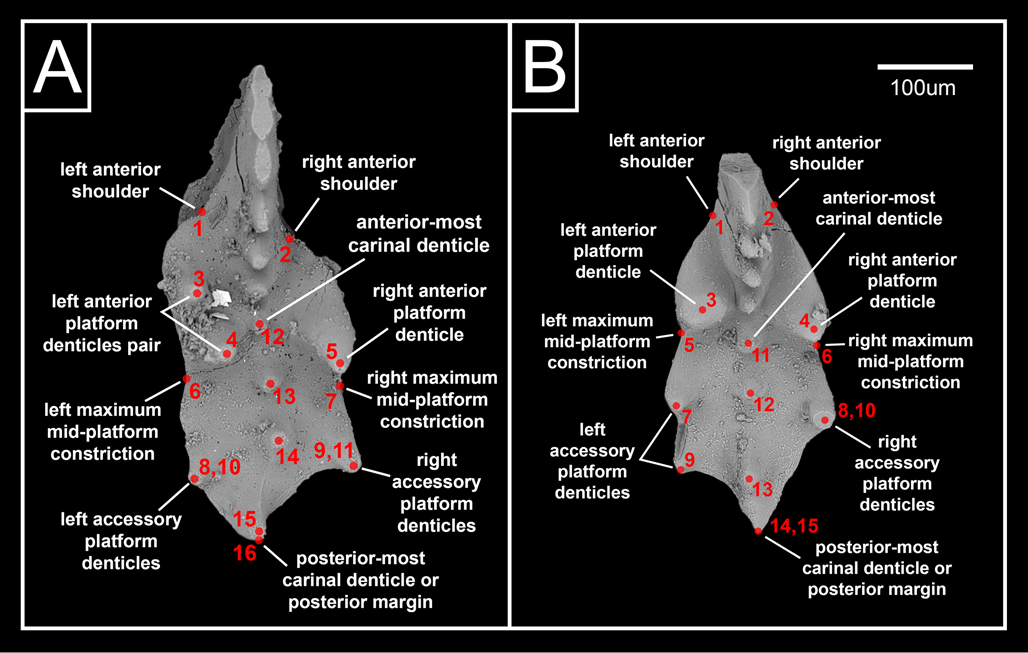
Figure 2. Geometric landmark models for (A) Mockina ex gr. carinata and (B) Mockina ex gr. englandi displayed on example specimens.
Morphometric techniques have been widely utilized in both biology and paleontology to investigate the geometric form of specimens (e.g., Bookstein Reference Bookstein1991). The platform landmark analysis methodology employed by the present study follows that utilized by prior morphometric analyses of Late Pennsylvanian conodont pectiniform elements (Hogancamp et al. Reference Hogancamp, Barrick and Strauss2016; Hogancamp and Barrick Reference Hogancamp and Barrick2018; Hogancamp Reference Hogancamp2020). This landmarking methodology emphasizes the positions of distinct anatomical features, in contrast to morphometric studies of conodont pectiniform elements that focus more on the traced outline of elements (Klapper and Foster Reference Klapper and Foster1986, Reference Klapper and Foster1993; Renaud and Girard Reference Renaud and Girard1999; Girard et al. Reference Girard, Renaud and Feist2007; Zimmerman et al. Reference Zimmerman, Johnson and Polly2018; Guenser et al. Reference Guenser, Souquet, Dolédec, Mazza, Rigo and Goudemand2019). The outline-focused methodology has the advantage of not requiring identification of many common point features, resulting in specimen pools for analysis that accommodate a greater degree of morphological variability, potentially even including multiple genera. This methodology also produces a more precise representation of an element's outline shape, but can overlook crucial variation that does not affect the outline, which the feature-focused method would better capture. Both methods have been shown to be equally effective in detecting the pectiniform morphological variation that distinguishes species of the Late Devonian Palmatolepis winchelli group when employed on the same specimen pool (Hogancamp and Manship Reference Hogancamp and Manship2016). Given the universally prominent denticulation observed in both M. ex gr. carinata and M. ex gr. englandi, the feature-focused methodology is more appropriate for the present study.
Two similar geometric landmark models are utilized for the two species in the present study, composed predominantly of Type 1 landmarks, as defined by Bookstein (Reference Bookstein1991). Type 1 landmarks are points readily identifiable as homologous between specimens by being defined by a discrete junction of anatomical features; Type 2 landmarks are points of reliable maxima/minima along a boundary, typically with biomechanical implications (Bookstein Reference Bookstein1991). For M. ex gr. carinata (Fig. 2A), these landmarks are the anterior shoulders where the platform meets the blade (1, 2, Type 1), the positions of the large anterior platform denticles (3–5, Type 1), the points of maximum mid-platform constriction between the main and accessory platform denticles (6, 7, Type 2), smaller accessory platform denticles posterior of the main set (8–11, Type 1), the positions of the carina denticles (12–15, Type 1), and the posterior margin of the carina (16, Type 1). For M. ex gr. englandi (Fig. 2B), these landmarks are the anterior shoulders where the platform meets the blade (1, 2, Type 1), the positions of the large anterior platform denticles (3, 4, Type 1), the points of maximum mid-platform constriction between the main and accessory platform denticles (5, 6, Type 2), smaller accessory platform denticles posterior of the main set (7–10, Type 1), the positions of the carina denticles (11–14, Type 1), and the posterior margin of the carina (15, Type 1).
For the landmark models to accommodate an adequately large specimen pool despite the variability in the number of carina and accessory platform denticles in both species, it is necessary that any “leftover” platform denticle landmarks are overlapped on the posterior-most platform denticle of the same side, and any “leftover” carina denticles are overlapped on the posterior margin of the carina (Fig. 2A,B). Any loss in the quantity of carina and accessory platform denticles would therefore be expressed in analytical results by the convergence and overlapping of those landmarks in question, and vice versa for any gain in denticle quantity. This overlapping and de-overlapping of landmark positions would not be easily confused with results reflecting other aspects of morphological variance. Specimens of M. ex gr. carinata where the large anterior platform denticle set is mirrored from the landmark model displayed in Figure 2B were flipped horizontally for consistent chirality. All landmarks across both geometric models are based on the positions of various features within each conodont element as seen in upper view (lying on base and denticles pointing up toward the camera). Other potentially important morphological features that are only visible in other views, such as denticle height, keel shape, and basal pit location, are therefore not considered in the present study. More complicated geometric models incorporating additional landmarks from lateral and lower views would be impractical for the present study given the large specimen pool size, but could be the focus of more targeted future investigations.
With the geometric landmark models as defined, the number of suitable specimens utilized in the present study totals 154 for M. ex gr. carinata and 339 for M. ex gr. englandi across all localities (Table 1, Supplementary Appendix). The primary criteria for including specimens in the present study was applicability of the respective geometric landmark models as defined above, as opposed to coherence with any species diagnoses. For example, specimens of both species required at least a single accessory platform denticle on each side to be included in the analyses, but all manner of platform shapes were included regardless of whether such forms are typical for M. carinata, M. englandi, or even other similar species within Mockina. The requirement for prominent accessory platform denticulation screens out juvenile Mockina specimens, as these features generally only develop in adulthood (e.g., Orchard Reference Orchard1983; Rigo et al. Reference Rigo, Mazza, Karádi, Nicora and Tanner2018). The juvenile forms of many Mockina species can be indistinguishable from one another (e.g., Orchard Reference Orchard1983; Rigo et al. Reference Rigo, Mazza, Karádi, Nicora and Tanner2018), so the inclusion of juveniles would have introduced unnecessary taxonomic confusion in the specimen-selection process. A more detailed exploration of Mockina taxa and phylogeny can be found in a number of past studies (Orchard Reference Orchard1983, Reference Orchard1991a,Reference Orchardb, Reference Orchard and Stanley1994, Reference Orchard2018; Orchard et al. Reference Orchard, Carter, Lucas and Taylor2007; Mazza et al. Reference Mazza, Rigo and Gullo2012; Rigo et al. Reference Rigo, Mazza, Karádi, Nicora and Tanner2018). Digital photographs were taken of each specimen using a Nikon SMZ1270 microscope with integrally connected Canon Vixia HF G20 camcorder. All photography was conducted at 120× magnification, and specimens were positioned at a consistent orientation. The JPEG files were converted to TPS files using the software TpsUtil (Rohlf Reference Rohlf2010a), and then the positions of all landmarks were identified per specimen in the software TpsDig (Rohlf Reference Rohlf2010b). Morphometric analyses were conducted using the software MorphoJ (Klingenberg Reference Klingenberg2011). First, a generalized Procrustes analysis was conducted on each species dataset, which minimizes all variation in specimen position, size, and rotation, in order to conserve only variation in specimen shape. Then, a wireframe model was created for each species, where landmark points are linked in a consistent manner to better facilitate visualization of form changes.
Finally, eigenanalyses were conducted. Canonical variate analysis (CVA) is a specific discriminatory eigenanalysis that produces eigenvectors (canonical variates) that represent axes that maximize separation of sets in multivariate space, with the sets externally predefined by classifiers. CVA was utilized in the present study, with the age of each specimen binned into middle Norian, late Norian, or Rhaetian as the predefined classifier. Therefore, the canonical variates (CV 1, CV 2) represent the factors of morphological variance that most significantly differentiate these age bins, each responsible for a certain proportion of total variance and summing to 100%. Each individual specimen has an eigenscore for each eigenvector, reflecting its morphology relative to the rest of the specimen pool for the given morphological factor. The changes in form along the scaling of these canonical variates are displayed using the wireframe models across the ranges of eigenscores exhibited by the specimens, connecting each eigenvector to tangible qualities in morphology.
Results
CVA of Mockina ex gr. carinata with Age as the Group Classifier
Conducting a CVA on the Mockina ex gr. carinata specimen pool with age as the group classifier (middle Norian, late Norian, Rhaetian) results in CV 1 explaining 69% of variance maximizing separation between the three age bins, whereas CV 2 explains 31%. More positive eigenscores along the CV 1 axis correspond to forms with a broader platform width, additional accessory platform denticles, and a slightly shortened carina (Fig. 3). More positive eigenscores along the CV 2 axis correspond to forms with an elongated carina, additional carina denticles, a constricted mid-platform between the anterior and accessory platform denticles, and posteriorly shifted accessory platform denticles (Fig. 3). A continuous range of specimens are observed across both CV axes, but generally the most positive CV 1 scores are from middle Norian specimens (Fig. 3). CV 1 scores are more negative in late Norian specimens, and most negative in Rhaetian specimens (Fig. 3). Specimens from the middle Norian have a mean CV 1 score of 1.69, with values more positive than that almost exclusively associated with middle Norian specimens (Fig. 3). Specimens from the late Norian have a mean CV 1 score of −0.09 (Fig. 3). Specimens from the Rhaetian have a mean CV 1 score of −1.52, with values more negative than that almost exclusively associated with Rhaetian specimens (Fig. 3). There is overlap among the three age bins along the CV 2 axis, and no considerable separation between middle Norian and Rhaetian ranges, but CV 2 scores more negative than −1.12 are exclusively associated with late Norian specimens (Fig. 3).

Figure 3. Canonical variate analysis (CVA) biplots for Mockina ex gr. carinata with age as the group classifier. The percentages along each axis label refers to the proportion of variance explained by each eigenvector. Also plotted for each age bin is a centroid representing the mean values of each age bin along both axes, and ellipses representing 2σ from each centroid. Dark blue wireframe models illustrate the extremes of each CV eigenscore still exhibited by natural specimens, overlaid on light blue wireframe models where all CV eigenscores are zero.
CVA of Mockina ex gr. englandi with Age as the Group Classifier
Conducting a CVA on the Mockina ex gr. englandi specimen pool with age as the group classifier (middle Norian, late Norian, Rhaetian) results in CV 1 explaining 73% of variance maximizing separation between the three age bins, whereas CV 2 explains 27%. More positive eigenscores along the CV 1 axis correspond to forms with a narrower platform width, an elongated carina, and additional carina denticles (Fig. 4). More positive eigenscores along the CV 2 axis correspond to forms with a shortened carina, a posterior carina curvature, and posteriorly shifted accessory platform denticles on the concave side of said curvature (Fig. 4). A continuous range of specimens are observed across both CV axes, but generally the most positive CV 1 scores are from Rhaetian specimens, whereas middle Norian and late Norian specimens tend to have more negative scores (Fig. 4). Specimens from the middle Norian have a mean CV 1 score of −0.45, whereas specimens from the late Norian have a mean CV 1 score of −0.26, with considerable overlap between the ranges of these two groups (Fig. 4). Specimens from the Rhaetian have a mean CV 1 score of 1.41, with values more positive than that almost exclusively associated with Rhaetian specimens (Fig. 4). There is overlap among the three age bins along the CV 2 axis, and no considerable separation between late Norian and Rhaetian ranges, but middle Norian specimens tend toward more positive values (Fig. 4). It is notable that overall separation of age bins for M. ex gr. englandi morphologies is less than that observed for M. ex gr. carinata (Figs. 3, 4).

Figure 4. Canonical variate analysis (CVA) biplots for Mockina ex gr. englandi with age as the group classifier. The percentages along each axis label refers to the proportion of variance explained by each eigenvector. Also plotted for each age bin is a centroid representing the mean values of each age bin along both axes, and ellipses representing 2σ from each centroid. Dark blue wireframe models illustrate the extremes of each CV eigenscore still exhibited by natural specimens, overlaid on light blue wireframe models where all CV eigenscores are zero.
Discussion
Evidence for Morphotype Origination or Subspeciation
It is notable that for both Mockina ex gr. carinata and Mockina ex gr. englandi, the holotype of each species has extreme CV 1 eigenscores far from the mean, with both late Norian and Rhaetian forms of M. ex gr. carinata progressing to more negative values than that of the middle Norian holotype, and Rhaetian forms of M. ex gr. englandi progressing to more positive values than that of the late Norian holotype (Figs. 3, 4). Although the holotype of M. englandi is generally assumed to be late Norian, the lack of independent age constraints for the specimen means it could potentially be Rhaetian instead (Orchard Reference Orchard1991b). Based on the present study, the broader platform of the M. englandi holotype indicates that it resembles late Norian forms much more than Rhaetian forms (Fig. 4). The topotypes of M. ex gr. carinata are largely restricted to more positive CV 1 values indicative of the middle Norian forms of that species (Fig. 3), whereas the topotypes of M. ex gr. englandi span a large portion of the CV 1 axis variability but largely do not encroach into the more positive CV 1 values indicative of the Rhaetian forms of that species (Fig. 4). There are multiple potential explanations for the outlier morphologies of both holotypes. It is possible that the holotypes were selected precisely due to their aberrant forms, being distinct within the species. Alternatively, they may have been selected due to their particularly broad platforms, as reflected in their CV 1 eigenscores. The arrangement and height of platform denticles are key to the diagnoses of both species, such that a specimen with a broader platform would likely display these features more clearly. Nevertheless, both species are now defined by holotypes that are not representative of the species as a whole in terms of platform width, with CV 1 distribution as evidence for morphotype origination or subspeciation away from the holotypes toward reduced platform morphologies across the NRB.
From the CVA results, thresholds of platform width can be determined for both M. ex gr. carinata and M. ex gr. englandi, past which specimens can be reliably identified as Rhaetian in age. For M. ex gr. carinata, the most negative CV 1 score for a late Norian specimen is −2.10, with all values more negative than that associated with Rhaetian specimens (Figs. 3, 5A). This CV 1 score threshold represents a mid-platform length to breadth ratio of 2.9:1. For M. ex gr. englandi, the most positive CV 1 score for a late Norian specimen is 2.61, with all values more positive than that associated with Rhaetian specimens (Figs. 4, 5B). This CV 1 score threshold represents a mid-platform length to breadth ratio of 3.1:1. Therefore, specimens of these two species with ratios greater than this threshold ratio of ~3:1 can be reliably identified as Rhaetian in age; however, given the overlap between the Norian and Rhaetian CV 1 score ranges of both species, specimens displaying ratios lower than ~3:1 are not exclusively Norian (Figs. 3–5). These determinations will have biostratigraphic utility for future studies involving Norian and Rhaetian conodonts from the Canadian Cordillera, and with wider testing may even prove to have global utility.

Figure 5. CV 1 eigenscore distribution from canonical variate analysis (CVA) with age as the group classifier of (A) Mockina ex gr. carinata and (B) Mockina ex gr. englandi for specimens of each age bin.
Correlation to the NRB at Kennecott Point
The exact position of the NRB remains uncertain and contentious, with a number of different biostratigraphic proxies having been proposed and utilized, despite the asynchroneity between some if not all of these proxies (e.g., Carter and Orchard Reference Carter and Orchard2007; Orchard et al. Reference Orchard, Carter, Lucas and Taylor2007; Krystyn Reference Krystyn2010; Rigo et al. Reference Rigo, Bertinelli, Concheri, Gattolin, Godfrey, Katz and Maron2016, Reference Rigo, Onoue, Tanner, Lucas, Godfrey, Katz and Zaffani2020; Taylor et al., Reference Taylor, Guex and Lucas2021; Lei et al. Reference Lei, Golding and Husson2022; Rigo and Campbell Reference Rigo and Campbell2022). As such, understanding the timing of pectiniform platform reduction in M. ex gr. carinata and M. ex gr. englandi requires precise correlation of conodont morphology shifts to these various NRB proxies. Many of the specimens utilized in the present study do not have age constraints more precise than their age bins (middle Norian, late Norian, Rhaetian), but the composite Kennecott Point section on Haida Gwaii compiled by Carter and Orchard (Reference Carter and Orchard2007) represents an opportunity to extract a subset of the specimen pool and observe how the forms of both these species change within a continuous stratigraphic section. These specimens can be situated precisely within the Kennecott Point section, spanning a large variety of stratigraphic positions relative to a well-constrained NRB primarily defined by the first occurrence of the Rhaetian radiolarian Proparvicingula moniliformis at 10.7 m, supported by the slightly higher first occurrence of the Rhaetian conodont Mockina mosheri morphotype A at 13.0 m (Carter and Orchard Reference Carter and Orchard2007; Fig. 6).

Figure 6. CV 1 eigenscores from canonical variate analysis (CVA) with age as the group classifier of Mockina ex gr. carinata and Mockina ex gr. englandi across the Kennecott Point section from Carter and Orchard (Reference Carter and Orchard2007). The Norian/Rhaetian boundary (NRB) is drawn at the base of the Proparvicingula moniliformis Zone. The range of CV 1 eigenscores exclusively exhibited by Rhaetian specimens are highlighted in red for each species. A linear line of best fit is displayed in purple for M. ex gr. carinata, and in green for M. ex gr. englandi, with each regression surrounded by its respective 98% confidence interval.
Lower in the Kennecott Point section (0.9 m in Fig. 6), Ward et al. (Reference Ward, Haggart, Carter, Wilbur, Tipper and Evans2001, Reference Ward, Garrison, Haggart, Kring and Beattie2004) previously identified the NRB as defined by the conspicuous disappearance of the bivalve genus Monotis, coinciding with a positive excursion in δ13C values of organic carbon, interpreted together to indicate environmental stress via deoxygenation. The positive excursion of ~1.5‰ is arguably dubious, because it is largely defined by a single data point. However, the disappearance of Monotis, which often dominates among Norian fauna, is unambiguous (e.g., Ward et al. Reference Ward, Haggart, Carter, Wilbur, Tipper and Evans2001, Reference Ward, Garrison, Haggart, Kring and Beattie2004; Wignall et al. Reference Wignall, Zonneveld, Newton, Amor, Sephton and Hartley2007; Rigo et al. Reference Rigo, Bertinelli, Concheri, Gattolin, Godfrey, Katz and Maron2016, Reference Rigo, Onoue, Tanner, Lucas, Godfrey, Katz and Zaffani2020). The last occurrence of Monotis has been used as a proxy approximating the NRB in many sections globally, despite being understood to be somewhat older than many other proxies (e.g., Ward et al. Reference Ward, Haggart, Carter, Wilbur, Tipper and Evans2001, Reference Ward, Garrison, Haggart, Kring and Beattie2004; Wignall et al. Reference Wignall, Zonneveld, Newton, Amor, Sephton and Hartley2007; Rigo et al. Reference Rigo, Bertinelli, Concheri, Gattolin, Godfrey, Katz and Maron2016, Reference Rigo, Onoue, Tanner, Lucas, Godfrey, Katz and Zaffani2020; Lei et al. Reference Lei, Golding and Husson2022). The Kennecott Point section also hosts a rare occurrence of Misikella posthernsteini in Panthalassa, at ~77 m extrapolating from Figure 6 (Orchard Reference Orchard1991a; Carter and Orchard Reference Carter and Orchard2007; Orchard et al. Reference Orchard, Carter, Lucas and Taylor2007). The first occurrence of this conodont species is widely used to mark the NRB in Tethys (e.g., Krystyn Reference Krystyn2010; Rigo et al. Reference Rigo, Bertinelli, Concheri, Gattolin, Godfrey, Katz and Maron2016, Reference Rigo, Mazza, Karádi, Nicora and Tanner2018; Karádi et al. Reference Karádi, Cau, Mazza and Rigo2020), but co-occurrence with the ammonoid Chorisoceras nobile at Kennecott Point suggests this occurrence of M. posthernsteini is well into the Rhaetian Stage (Orchard Reference Orchard1991a; Tipper et al. Reference Tipper, Carter, Orchard and Tozer1994; Carter and Orchard Reference Carter and Orchard2007; Orchard et al. Reference Orchard, Carter, Lucas and Taylor2007).
Deposition at the Kennecott Point section has been interpreted as having occurred in an open ocean slope setting (e.g., Desrochers and Orchard Reference Desrochers, Orchard and Woodsworth1991; Kasprak et al. Reference Kasprak, Sepúlveda, Price-Waldman, Williford, Schoepfer, Haggart, Ward, Summons and Whiteside2015; Schoepfer et al. Reference Schoepfer, Algeo, Ward, Williford and Haggart2016). A number of past studies have utilized a wide variety geochemical proxies to investigate the paleoenvironmental conditions spanning the Norian–Hettangian interval of Kennecott Point and generally proposed expanding anoxic conditions and biotic distress at the Triassic/Jurassic boundary, as well as for variable portions of the late Rhaetian, but did not suggest that these disturbances extend back to the NRB (e.g., Ward et al. Reference Ward, Haggart, Carter, Wilbur, Tipper and Evans2001, Reference Ward, Garrison, Haggart, Kring and Beattie2004; Williford et al. Reference Williford, Ward, Garrison and Buick2007, Reference Williford, Foriel, Ward and Steig2009; Kasprak et al. Reference Kasprak, Sepúlveda, Price-Waldman, Williford, Schoepfer, Haggart, Ward, Summons and Whiteside2015; Schoepfer et al. Reference Schoepfer, Algeo, Ward, Williford and Haggart2016).
The occurrence of reduced platform morphologies in M. ex gr. carinata begins at 16.8 m within the Kennecott Point section, and in M. ex gr. englandi at 18.0 m, both situated higher than the radiolarian-defined NRB at 10.7 m (Fig. 6). Although these reduced platform morphologies emerge in the Rhaetian, it is notable that the late Norian forms still occur in the highest conodont sample recovered from the section (Fig. 6). Although limited by the absence of middle Norian specimens at Kennecott Point, the lack of a clear gradual trend toward more negative CV 1 values for M. ex gr. carinata may suggest pectiniform platform reduction did not occur continuously from the middle Norian through to the Rhaetian as could be interpreted from the CVA results, but perhaps stepwise instead. Although the emergence of reduced platform morphologies in both conodont species occur somewhat later than other NRB proxies, this shift is likely still associated with the NRB, as all these biotic changes are clustered much closer to each other stratigraphically than to the Triassic/Jurassic boundary located significantly higher in the Kennecott Point section (99.9 m, extrapolating from Fig. 6) (Ward et al. Reference Ward, Haggart, Carter, Wilbur, Tipper and Evans2001, Reference Ward, Garrison, Haggart, Kring and Beattie2004; Carter and Orchard Reference Carter and Orchard2007; Williford et al. Reference Williford, Ward, Garrison and Buick2007, Reference Williford, Foriel, Ward and Steig2009; Kasprak et al. Reference Kasprak, Sepúlveda, Price-Waldman, Williford, Schoepfer, Haggart, Ward, Summons and Whiteside2015; Schoepfer et al. Reference Schoepfer, Algeo, Ward, Williford and Haggart2016). The apparent asynchroneity of response to the disturbance around the NRB could be interpreted as evidence for different biotic groups having differing degrees of susceptibility to the environmental changes associated with the boundary, as motile organisms such as conodonts (e.g., Briggs et al. Reference Briggs, Clarkson and Aldridge1983; Purnell Reference Purnell1995) were perhaps able to endure the abiotic stress better than benthic, sessile communities.
Paleoenvironmental Implications
Shifts in conodont element morphology may reflect the changing needs of food resource acquisition, as it has been widely suggested that conodont elements comprised a feeding apparatus that functioned by grasping and masticating food material (e.g., Briggs et al. Reference Briggs, Clarkson and Aldridge1983; Purnell and von Bitter Reference Purnell and von Bitter1992; Purnell Reference Purnell1993, Reference Purnell1995; Donoghue and Purnell Reference Donoghue and Purnell1999; Purnell and Jones Reference Purnell and Jones2012; Martínez-Pérez et al. Reference Martínez-Pérez, Rayfield, Purnell and Donoghue2014b, Reference Martínez-Pérez, Rayfield, Botella and Donoghue2016; Kelz et al. Reference Kelz, Guenser, Rigo and Jarochowska2023). Conodont survivorship across the Permian/Triassic mass extinction was remarkably high, and this may have been due in some degree to adaptations made in response to the extreme environmental pressures of this time interval, such as decreasing pectiniform element size in response to previous food sources becoming compromised (e.g., Clark et al. Reference Clark, Wang, Orth and Gilmore1986; Luo et al. Reference Luo, Lai, Jiang and Zhang2006; Schaal et al. Reference Schaal, Clapham, Rego, Wang and Payne2016; Zhang et al. Reference Zhang, Jiang, Purnell and Lai2017; Lai et al. Reference Lai, Jiang and Wignall2018). The platform reduction observed across the NRB in both M. ex gr. carinata and M. ex gr. englandi, even when controlling for specimen size, may similarly reflect a response to environmental disturbance impacting food availability.
While changes in the overall size or complexity of conodont elements can indicate some manner of disruption to feeding habits, the presence/absence of platforms on pectiniform elements is not wholly dependent on element size, but instead likely reflects diversity in ecological niche (e.g., Ginot and Goudemand Reference Ginot and Goudemand2019). Therefore, the platform width reduction observed across the NRB may allow for more specific inferences regarding mode of life shifts, due to the greater linkage between morphology and function, than consideration of element size alone. It has long been proposed that pectiniform conodont elements were somewhat analogous in function to mammalian molars, in the sense of being specialized for grinding motions as opposed to grasping or shearing motions, based on multiple lines of evidence, including growth allometry, patterns of microwear, and occlusion modeling (e.g., Purnell Reference Purnell1993, Reference Purnell1995; Donoghue and Purnell Reference Donoghue and Purnell1999; Purnell and Jones Reference Purnell and Jones2012; Martínez-Pérez et al. Reference Martínez-Pérez, Rayfield, Purnell and Donoghue2014b; Kelz et al. Reference Kelz, Guenser, Rigo and Jarochowska2023). Although food sources for conodonts remain largely speculative, Martínez-Pérez et al. (Reference Martínez-Pérez, Rayfield, Botella and Donoghue2016) demonstrate how the gradual evolutionary expansion of a wider platform in the conodont genus Polygnathus would work to distribute stress such that greater forces can be endured during element function, opening up the viability of processing harder materials. The platform reduction in pectiniform elements across the NRB, both intraspecifically in Panthalassa and intergenerically in Tethys, may therefore indicate a trend in which some conodonts shifted away from mineralized food sources in the Rhaetian. This response may have been due to a change in availability of different food sources as compared with the Norian.
An alternative driver for the pectiniform platform reduction across the NRB would be elevated bioapatite mineralization pressure, directly inhibiting the growth of robust conodont elements. However, there is no evidence of phosphatic mineralization suppression around the Norian–Rhaetian interval. For example, at Williston Lake in British Columbia, the presence of abiotically precipitated phosphatic pebble conglomerate beds commonly mark the Rhaetian and are interpreted to indicate spreading anoxic conditions off the western margin of Laurentia in the leadup to the ETME (Larina et al. Reference Larina, Bottjer, Corsetti, Zonneveld, Celestian and Bailey2019).
Global carbonate mineralization suppression has long been associated with the ETME, caused by ocean acidification linked to the enhanced volcanic outgassing of CAMP emplacement (e.g., Stanley Reference Stanley1988; Hautmann Reference Hautmann2004). The decline of faunal groups such as bivalves and corals at the NRB may suggest that this carbonate suppression began to occur much earlier, albeit to a lesser degree (Ward et al. Reference Ward, Haggart, Carter, Wilbur, Tipper and Evans2001, Reference Ward, Garrison, Haggart, Kring and Beattie2004; Flügel and Kiessling Reference Flügel and Kiessling2002; Stanley Reference Stanley2003; Wignall et al. Reference Wignall, Zonneveld, Newton, Amor, Sephton and Hartley2007; Rigo et al. Reference Rigo, Bertinelli, Concheri, Gattolin, Godfrey, Katz and Maron2016, Reference Rigo, Onoue, Tanner, Lucas, Godfrey, Katz and Zaffani2020; Lei et al. Reference Lei, Golding and Husson2022). If carbonate biomineralization was suppressed in these groups, it is possible that the same pressures were being exerted on potential conodont food sources at the NRB. A decrease in the prevalence of mineralized food sources would render robust pectiniform elements unnecessary. This interpretation involving carbonate suppression would support the hypothesis of large-scale CO2 emission being the causal mechanism of the environmental disturbance at the NRB, as has been previously proposed by a number of studies (e.g., Korte et al. Reference Korte, Kozur, Bruckschen and Veizer2003; Callegaro et al. Reference Callegaro, Rigo, Chiaradia and Marzoli2012; Tackett et al. Reference Tackett, Kaufman, Corsetti and Bottjer2014; Zaffani et al. Reference Zaffani, Agnini, Concheri, Godfrey, Katz, Maron and Rigo2017; Rigo et al. Reference Rigo, Onoue, Tanner, Lucas, Godfrey, Katz and Zaffani2020). However, with the absence of any large igneous province convincingly associated with the NRB, the source of this hypothetical episode of enhanced greenhouse gas emission remains speculative.
Conclusions
Morphometric analyses conducted on the pectiniform elements of the conodont species Mockina ex gr. carinata and Mockina ex gr. englandi spanning the middle Norian through Rhaetian of many localities in western Canada demonstrate that both species exhibit platform width reduction across the NRB. In regard to M. ex gr. carinata, this platform reduction occurs sequentially from middle Norian to late Norian to Rhaetian, whereas in M. ex gr. englandi, the shift only occurs across the NRB. Overall, M. ex gr. englandi seems to be more conservative in terms of morphological change than M. ex gr. carinata, as the former's morphologies do not separate the age bin clusters as prominently as the latter's along CV axes. With the reduced platform morphologies of both species arising in the Rhaetian, specimens of M. ex gr. carinata and M. ex gr. englandi from the Canadian Cordillera that have a mid-platform length to breadth ratio greater than 3:1 can be reliably identified as Rhaetian in age. It is notable that many of the Norian forms are still conserved across the NRB, so specimens with a lower ratio can still potentially be Rhaetian. At Kennecott Point specifically, the emergence of the reduced platform morphologies does not occur until somewhat after many other disturbances and biostratigraphic proxies associated with the NRB, such as the disappearance of the bivalve genus Monotis (Ward et al. Reference Ward, Haggart, Carter, Wilbur, Tipper and Evans2001, Reference Ward, Garrison, Haggart, Kring and Beattie2004). This new intraspecific platform reduction observed in Panthalassa is consistent with intergeneric trends largely observed in many conodonts from the Tethys (e.g., Orchard et al. Reference Orchard, Carter, Lucas and Taylor2007; Giordano et al. Reference Giordano, Rigo, Ciarapica and Bertinelli2010; Mazza et al. Reference Mazza, Rigo and Gullo2012; Rigo et al. Reference Rigo, Mazza, Karádi, Nicora and Tanner2018; Karádi et al. Reference Karádi, Cau, Mazza and Rigo2020; Du et al. Reference Du, Onoue, Karádi, Williams and Rigo2021, Reference Du, Onoue, Tomimatsu, Wu and Rigo2023), suggesting that these morphological trends (as well as their driving mechanisms) are global in extent. A potential explanation for the pectiniform platform reduction is a shift in primary diet away from hard materials, perhaps reflecting elevated carbonate mineralization pressure beginning around the NRB. Biomineralization suppression is typically associated with the ETME (e.g., Stanley Reference Stanley1988; Hautmann Reference Hautmann2004), but if this pressure began at a lesser severity as far back as the NRB, this would support the concept of a drawn-out multiphase mass extinction leading into the end-Triassic.
Acknowledgments
The authors would like to thank N. Hogancamp (Hess Corporation) for providing absolutely instrumental guidance on conodont morphometric techniques; T. Lacourse (University of Victoria) for providing comprehensive feedback on an earlier draft of the article; A. Fraass (University of Victoria) for providing feedback regarding general utilization of morphometric techniques; M. Orchard (Geological Survey of Canada) for providing Canadian Cordillera conodont expertise and for collecting much of the specimen pool utilized; H. Taylor (Geological Survey of Canada) for conducting the conodont preparation work and curation. We would also like to thank the editor C. K. Boyce, reviewer M. Orchard, and an anonymous reviewer for constructive reviews that greatly improved the article. This research was funded by the Geological Survey of Canada Geo-Mapping for Energy and Minerals (GEM-2 and GEM-GeoNorth) program and by a Natural Sciences and Engineering Research Council of Canada (NSERC) Discovery Grant to J. Husson (RGPIN-2017-03887).
Competing Interests
The authors declare that they have no competing interests that could influence the work reported in this paper.
Data Availability Statement
Data available from the Zenodo Digital Repository: https://doi.org/10.5281/zenodo.8339714.


 Open access