


Introduction
The transition from jawless to jawed vertebrates (agnathans to gnathostomes) is one of the most important events in the history of life on Earth, yet the mechanisms that drove the transition from agnathan-dominated to gnathostome-dominated faunas are unknown. No mass extinctions are associated with the transition. Instead, the appearance of an evolutionary novelty (jaws) and subsequent novel characteristics (Janvier Reference Janvier1996) are associated with a broad faunal changeover. The time lag between the appearance of gnathostomes and extinction of nearly all agnathans (specifically, all jawless stem gnathostomes, a.k.a. ostracoderms) represents a transitional period in which vertebrate faunas changed from agnathan-dominated to gnathostome-dominated across the late Silurian and the Devonian Periods (Anderson et al. Reference Anderson, Friedman, Brazeau and Rayfield2011). Competition is the most commonly hypothesized cause of this slow transition (Janvier Reference Janvier1996; Pough et al. [Reference Pough, Heiser and McFarland1996] in Purnell Reference Purnell and Ahlberg2001b; Long Reference Long2011). The goal of this study is to develop a framework by which this hypothesis can be tested and the most and least likely agnathan and gnathostome competitors can be identified.
The competition hypothesis posits that gnathostomes, benefiting from evolutionary novelties, demonstrated improved performance across many of the niches already occupied by jawless vertebrates and thereby drove them to extinction. An alternative set of hypotheses assert that gnathostomes’ evolutionary novelties expanded their access to niches unavailable to agnathans (Raff Reference Raff1996; Janvier and Newman Reference Janvier and Newman2005), and therefore gnathostomes persisted while agnathans went extinct from environmental change (Janvier et al. Reference Janvier, Halstead and Westoll1985) and greater endemism of agnathans (Sansom Reference Sansom2009), or predation from gnathostomes (Lebedev et al. Reference Lebedev, Mark-Kurik, Karatajute-Talimaa, Luksevics and Ivanov2009; Randle and Sansom Reference Randle and Sansom2019). Support for competition between agnathans and gnathostomes is based on general trends in diversity through time (Purnell Reference Purnell and Ahlberg2001b) or specific trends in the disappearance of an agnathan from the fossil record and subsequent appearance of a gnathostome that is superficially similar in appearance (Janvier Reference Janvier1996; Long Reference Long2011). Such circumstantial evidence of competition, based on biostratigraphic and paleogeographic trends, fails to reject alternative hypotheses—predation, environmental alteration (Janvier and Blieck Reference Janvier, Blieck and Long1993; Menge Reference Menge1995; Gonzalez et al. Reference Gonzalez, Lambert and Ricciardi2008; Randle and Sansom Reference Randle and Sansom2019), and/or coexistence—leading to concerns about whether competition is testable (Purnell Reference Purnell and Ahlberg2001b).
Defining Competition
To test competition, we must constrain the definition of competition to a falsifiable hypothesis and determine which groups of agnathans and gnathostomes are most and least likely to have competed with each other. Because of the uncertainty of the fossil record, a definition of competition must be clear, and falsifying competition or alternative hypotheses of faunal changes must be possible from fossil evidence. To date, studies of the agnathan/gnathostome transition have not defined competition (Purnell Reference Purnell and Ahlberg2001b; Long Reference Long2011). Competition can be generally agreed upon as interactions between two or more taxa that negatively impact the fitness of those taxa. However, fitness can be negatively impacted by a variety of direct and indirect interactions, for example, predation, disruption of reproduction, indirect removal of resources or habitat (environmental alteration), occupation of space (habitat), and consumption of resources (Birch Reference Birch1957; Tilman Reference Tilman1987; Holbrook and Petranka Reference Holbrook and Petranka2004; Abrams and Cortez Reference Abrams and Cortez2015). There is considerable dispute as to which interactions qualify as competition, and definitions vary among ecologists (Birch Reference Birch1957; Abrams and Cortez Reference Abrams and Cortez2015). Competition is typically identified by experiments (Holbrook and Petranka Reference Holbrook and Petranka2004; Anderson and Whiteman Reference Anderson and Whiteman2015) or inferred from observed interactions among organisms (Tilman Reference Tilman1987), but neither approach is typically possible with fossil specimens
Here we define competition as the use of the same resources (food or habitat) by more than one taxon in the same place at the same time. If two or more taxa cannot share all four parameters (food, habitat, location, time) then competition between those taxa would not be possible. Our definition rejects competition between taxa through four possible scenarios: (1) taxa are not present at the same time, (2) taxa are not present in the same place, (3) taxa do not use the same habitat, and (4) taxa do not consume the same food. Failure to reject these criteria does not reject alternative hypotheses but does suggest that competition is possible. In contrast, rejection of competition does not exclude other negative impacts of one taxon on another, for example, taxa that meet scenarios 3 and/or 4 can still impact each other by disrupting food or habitat (Menge Reference Menge1995; Gonzalez et al. Reference Gonzalez, Lambert and Ricciardi2008) or by predation on at least one life stage (Holbrook and Petranka Reference Holbrook and Petranka2004), and taxa that meet scenarios 1 and/or 2 can exclude one another through environmental alterations.
Stratigraphy and Geography
Biostratigraphic and paleogeographic patterns (scenarios 1 and 2) rely on presence data that are incomplete and uncertain (Janvier and Blieck Reference Janvier, Blieck and Long1993), making it difficult to reject or support competition using these criteria. A taxon's range is based on whether it is preserved in a particular layer or a particular region; however, decreasing abundance of taxa can result in tails of stratigraphic and/or geographic ranges that are missed entirely due to incomplete sampling of a taxon (Weiss and Marshall Reference Weiss and Marshall1999; Warnock et al. Reference Warnock, Heath and Stadler2020). The chance of a taxon being preserved in the fossil record near the edges of its range (end or the beginning stratigraphically) are low (Weiss and Marshall Reference Weiss and Marshall1999). Therefore, the lack of fossils of a taxon stratigraphically or geographically in the fossil record does not necessarily indicate its absence in a region or at a given time. The farther apart taxa are stratigraphically and paleogeographically, the less likely it is that they overlapped in time and space.
Overlaps in stratigraphy and paleobiogeography do not ensure competition. Time averaging allows for taxa that did not live together to be found in the same strata/facies/locality (with very rare exceptions; e.g., Maisey Reference Maisey1994), while allochthonous deposition can cause taxa that did not live in the same environment to also be found in the same locality (Behrensmeyer et al. Reference Behrensmeyer, Kidwell and Gastaldo2000). A framework for testing competition in the fossil record should therefore include data independent of stratigraphy and paleogeography. Agnathan classes considered in this study (Anaspida, Heterostraci, Osteostraci, and Thelodonti) overlap stratigraphically (Dineley and Loeffler Reference Dineley, Loeffler and Long1993; Janvier and Blieck Reference Janvier, Blieck and Long1993; Zhu et al. Reference Zhu, Zhao, Jia, Qiao and Qu2009; Lu et al. Reference Lu, Giles, Friedman, den Blaauwen and Zhu2016; Supplementary Fig. S1) and geographically (specifically Euramerica; Dineley and Loeffler Reference Dineley, Loeffler and Long1993; Young Reference Young and Long1993; Newman and Trewin Reference Newman and Trewin2001) with each of the gnathostome classes (Acanthodii, Actinopterygii, Chondrichthyes, Placodermi, and Sarcopterygii), but not necessarily at finer taxonomic levels or at individual sites; therefore, we limit our comparisons to among classes, with the exception of the highly disparate orders of Placodermi (Young Reference Young2010) and the Furcaudiformes, a morphologically distinct order within Thelodonti (Wilson and Caldwell Reference Wilson and Caldwell1998). When potentially competing taxa are identified based on our functional-morphological criteria, we can use what stratigraphic or geographic data we have to further support or reject these hypotheses.
Morphological Similarity and Competition
Overlap in resource use (scenarios 3 and 4) cannot be observed directly from fossils but can be approximated based on the morphology of fossilized taxa. To assess niche overlap, and therefore competition (Pianka Reference Pianka1974), separate from stratigraphic and paleogeographic data, we compared morphologies among agnathans and gnathostomes. Morphological comparisons are not dependent on stratigraphic and paleogeographic overlap between species, but are dependent on the size and availability of complete specimens.
Form and function have been studied extensively in extant aquatic vertebrates (e.g., Motta and Wilga Reference Motta and Wilga2001; Lauder and Drucker Reference Lauder and Drucker2004; Wainwright Reference Wainwright2005). Adaptations for similar functions and performance often converge, such that taxa with similar niches have similar morphologies (e.g., Montana and Winemiller Reference Montana and Winemiller2013; Claverie and Wainwright Reference Claverie and Wainwright2014; Vidal-Garcia and Keogh Reference Vidal-Garcia and Keogh2015). Aquatic vertebrates with similar jaws eat similar foods (Albertson et al. Reference Albertson, Streelman and Kocher2003; Pos et al. Reference Pos, Farina, Kolmann and Gidmark2019), and taxa with similar body forms use similar habitats (Webb Reference Webb1988; Montana and Winemiller Reference Montana and Winemiller2013; Claverie and Wainwright Reference Claverie and Wainwright2014; Friedman et al. Reference Friedman, Price, Com, Larouche, Martinez and Wainwright2020). By definition, agnathans lack jaws, preventing the use of jaw morphology to approximate similarities or differences in feeding compared with gnathostomes (e.g., Anderson et al. Reference Anderson, Friedman, Brazeau and Rayfield2011). Agnathans do have tails, however, and many have paired and/or median fins and a flexible trunk (Wilson et al. Reference Wilson, Hanke, Märss, Anderson and Sues2007), features shared with aquatic gnathostomes and consistent with body–caudal fin locomotion (Webb Reference Webb1984). Therefore, similarity or difference in body form can serve as a proxy for similarity or difference in ecology and especially habitat use among agnathans and gnathostomes during the transition. Fish competing within a macrohabitat can converge on body form through a variety of different paths (Claverie and Wainwright Reference Claverie and Wainwright2014; Friedman et al. Reference Friedman, Price, Com, Larouche, Martinez and Wainwright2020).
To capture the broad range of potentially ecologically important variation in body form, we took measurements of position, shape, and size of each fin, the head, and the tail. Body shape, tail shape, and the size and shape of the median and paired fins can vary across habitat and foraging strategies in aquatic vertebrates in response to selective pressures on locomotor performance (Webb Reference Webb1984). For extant ecosystems, vertebrates in open water have streamlined bodies, large anterior dorsal fins, small posterior dorsal fins and anal fins, large narrow pectoral fins, a posterior narrow caudal peduncle, and a tall high aspect-ratio tail (Webb Reference Webb1984; Compagno Reference Compagno1990). More benthic vertebrates tend to have broader larger pelvic fins and posterior dorsal fins, and either long and slender or deep and laterally compressed bodies, especially in complex habitats such as reefs or vegetation (Webb Reference Webb1984; Compagno Reference Compagno1990; Mihalitsis and Bellwood Reference Mihalitsis and Bellwood2019; Friedman et al. Reference Friedman, Price, Com, Larouche, Martinez and Wainwright2020). When taxa specialize for specific diets, foraging strategies and/or habitats, such specialization can influence postcranial morphology, including overall body form, tail shape, and fin structures. As an example, large dorsal and anal fins shifted posteriorly and broad, low aspect-ratio tails are found in piscivorous or macroinvertebrate-eating ambush predators (Keast and Webb Reference Keast and Webb1966; Felley Reference Felley1984; Webb Reference Webb1984). Microceanic sharks have small fins and large eyes (Compagno Reference Compagno1990). Insectivorous freshwater teleosts have short laterally compressed bodies and short deep heads (Merigoux and Ponton Reference Merigoux and Ponton1998; Hjelm et al. Reference Hjelm, Svanback, Bystrom, Perrson and Wahlstrom2001). Planktivorous fish have long slender bodies for filter feeding in open water, some with long slender pectoral fins (Wainwright et al. Reference Wainwright, Bellwood and Westneat2002) and long narrow heads (Hjelm et al. Reference Hjelm, Svanback, Bystrom, Perrson and Wahlstrom2001). Larger heads (including expanded branchial arches) are also noted in hypoxic specialists (Compagno Reference Compagno1990). These modern examples illustrate strong connections between body form and ecology and verify that all of these features need to be considered when examining the ecomorphology of the wide morphological diversity of Silurian and Devonian vertebrates.
Size
Size is a significant factor in determining ecological niche (Wilson Reference Wilson1975; Colloca et al. Reference Colloca, Carpentieri, Balestri and Ardizzone2010), but fossil preservation can be biased toward preservation of particular sizes or ontogenetic stages of animals (Behrensmeyer et al. Reference Behrensmeyer, Kidwell and Gastaldo2000). For fossil fish, preservation of complete or mostly complete body fossils may not represent the maximum, minimum, or average size of those taxa. It is therefore necessary to focus on morphological similarities and differences that are not dependent on size. The core assumption being that vertebrate groups that are substantially different from each other, regardless of size, are unlikely to have competed, even if they are similar in size, while competition remains plausible between similar taxa, even if there is a difference in size of preserved specimens, because possible overlaps in size due to ontogeny cannot be excluded.
Completeness
Complete body fossils of Silurian and Devonian vertebrates are extremely rare. To capture as wide a range of taxa as possible, partial specimens were included; however, the necessary inclusion of incomplete specimens introduces missing data values for measurements. Geometric morphometric analyses can compensate for missing data using data estimation techniques (Brown et al. Reference Brown, Arbour and Jackson2012), but require many landmarks, either homologous or analogous. Unfortunately, there are few landmarks consistently present across all early vertebrate groups; some groups or taxa lack paired and median fins entirely, while others possess numerous fins and structures, and many taxa have some, but not all, of the paired or median fins. The high disparity and few landmarks among early vertebrate taxa can introduce incongruent data estimation. To address these concerns, we used the Gower's dissimilarity coefficient, a non-estimation morphometric technique that performs well, even with substantial amounts of missing data (Brown et al. Reference Brown, Arbour and Jackson2012).
Gnathostome groups that competed with agnathans should be more similar to agnathans, while gnathostome groups that did not compete with agnathans should be more different from agnathan groups. Because we used fossil specimens, missing data and restricted taxonomic sampling introduce uncertainty in our results; precise statements are therefore avoided in favor of broad comparisons between groups: which gnathostome groups are the most and least likely to have competed with agnathans and which agnathan groups are the most and least likely to have competed with gnathostomes. If all Devonian agnathans were excluded by jawed vertebrates through competition, we would predict that agnathan morphospace would be within gnathostome morphospace. Alternatively, if gnathostomes did not compete with agnathans at all, then there would be little overlap between agnathan and gnathostome morphospace.
Methods
Sampling
We sampled as much morphospace as possible by measuring specimens from as many early vertebrate classes and orders as were available. There are six agnathan classes and as many as five classes of gnathostomes from the Silurian and Devonian periods. We were able to measure specimens from four of the six agnathan classes (Anaspida, Heterostraci, Osteostraci, and Thelodonti). The remaining agnathan classes (Galeaspida and Pituriaspida) are known only from headshields and incomplete trunks (Janvier Reference Janvier1984; Young Reference Young, Chang, Liu and Zhang1991; Zhu and Gai Reference Zhu and Gai2006), except for Geraspis rara (Zhu Reference Zhu2015), but closely resemble Osteostraci (Ferron et al. Reference Ferron, Martinez-Perez, Rahman, de Lucas, Botella and Donoghue2021). All classes of gnathostome (Acanthodii, Actinopterygii, Chondrichthyes, Placodermi, and Sarcopterygii) were sampled. Note that Acanthodii and Placodermii are possibly para- or polyphyletic groups (Brazeau and Friedman Reference Brazeau and Friedman2015). The taxonomic breadth of this study was achieved by including incomplete specimens as long as standard length (rostrum to caudal peduncle; Fig. 1) could be measured. Multiple specimens of a taxon were measured when they were available. The placoderm orders Rhenanida and Petalichthyida were represented only by Gemuendina stuertzi and Lunaspis broili, respectively. Taxa included in this study were typically categorized by species, with the exception of indeterminate specimens (as Taxon sp. #); Cladoselache (specimens identified only to genus except for Cladoselache fyleri AMNH FF 240); and Ischnacanthus gracilis, because all full-body fossils of Ischnacanthus are assigned to I. gracilis, even though multiple species are likely present (Blais Reference Blais2017).
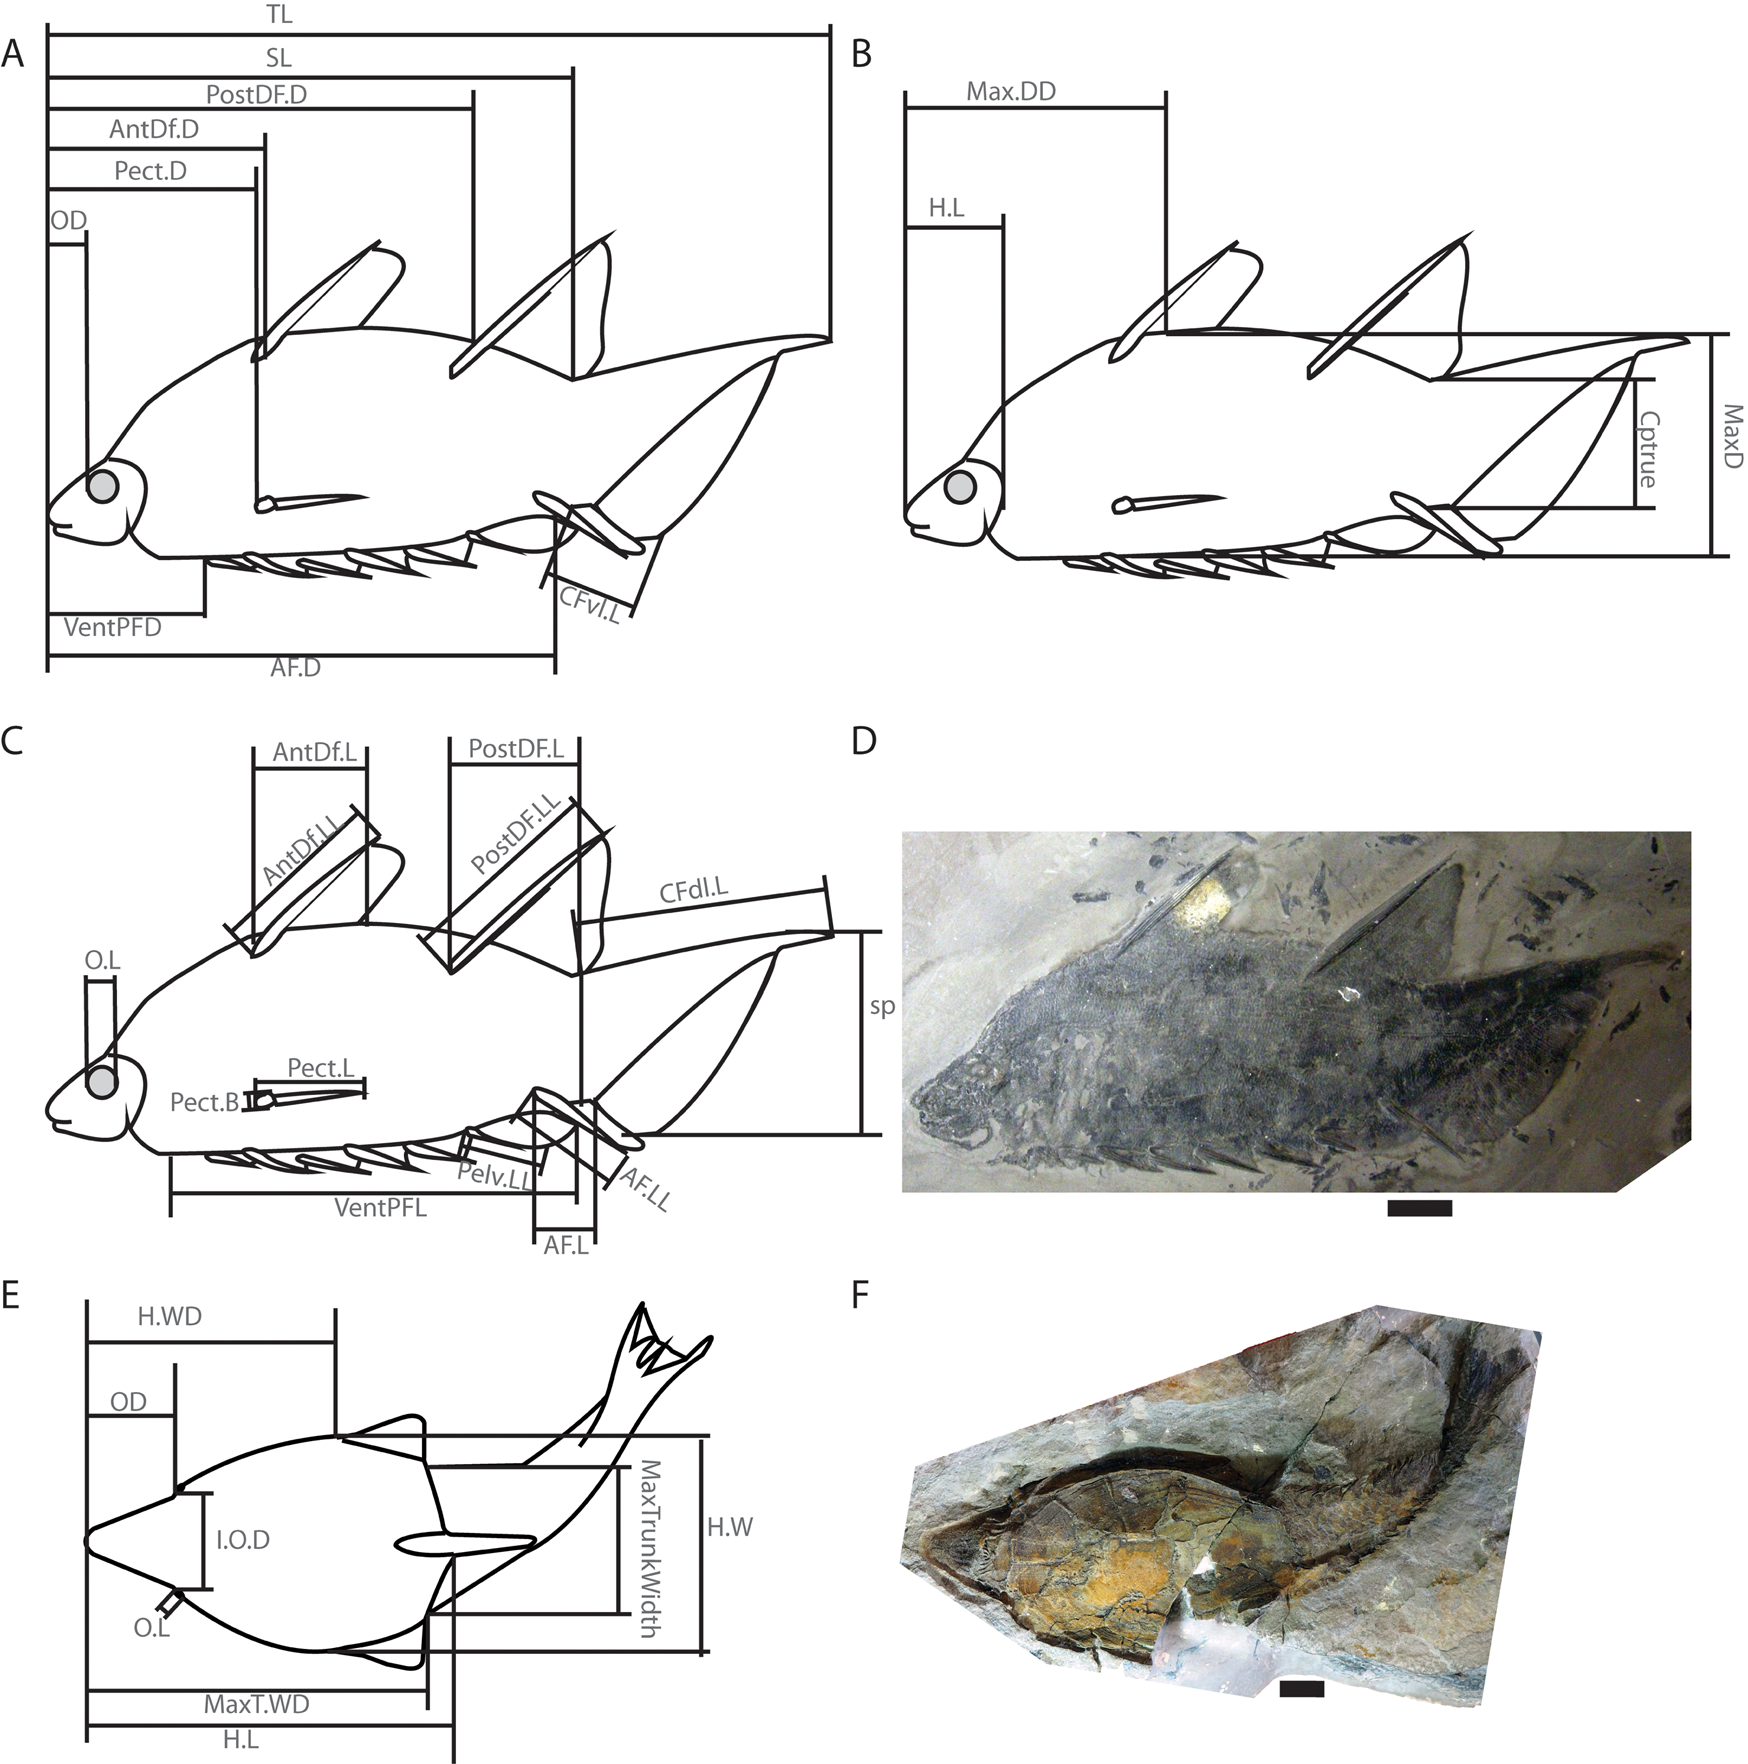
Figure 1. Diagrams showing measurements described in Supplementary Table T1 and taken from a wide range of Silurian and Devonian vertebrate fossils. A–C, A diagram of the acanthodian Brochoadmones milesi in lateral view based on UALVP 41495: A, distance measurements and caudal fin ventral lobe length; B, head length and depth measurements; and C, relative size measurements of fins, tail, and orbit. D, Photo of UALVP 41495. E, Diagram of the heterostracan Errivaspis waynensis based on several NHMUK specimens shown in dorsal view and displaying width measurements, as well as head length and orbit measurements. F, Photo of NHMUK P. 16789, one of the specimens used for E. Scale bars, 1 cm. Abbreviations: AF.D, anal fin distance; AF.L, anal fin length; AF.LL, anal fin leading-edge length; AntDf.D, anterior dorsal fin distance; AntDf.L, anterior dorsal fin length; AntDf.LL, anterior dorsal fin leading-edge length; Cptrue, caudal peduncle thickness; CFdl.L, caudal fin dorsal lobe length; CFvl.L, caudal fin ventral lobe length; H.L, head length; H.W, head width; H.WD, head width distance; I.O.D, interorbital distance; MaxD, maximum depth; Max.DD, maximum depth distance; MaxTrunkWidth, maximum trunk width; MaxT.WD, maximum trunk width distance; OD, orbit distance; O.L, orbit length; Pect.B, pectoral fin base; Pect.D, pectoral fin distance; Pect.L, pectoral fin length; Pelv.LL, pelvic fin leading-edge length; PostDF.D, Posterior Dorsal fin distance; PostDF.L, posterior dorsal fin length; PostDF.LL, posterior dorsal fin leading-edge length; sp, caudal fin span; SL, standard length; TL, total length; VentPFD, ventral paired fin distance; VentPFL, ventral paired fin length.
Sampling was biased by a need to measure complete or mostly complete articulate fossil vertebrates. Konservat-Lagerstätten are overrepresented, including the depositional environments and strata that result in such exceptional preservation. Large taxa are also underrepresented, because large specimens are less likely to be preserved in articulation for their entire length and are less likely to be completely collected when preserved. The bias against large taxa notably excludes from the dataset the large arthrodires (e.g., Dunkleosteus and Titanichthys) and the large chondrichthyan Ctenacanthus. The bias in size is unlikely to affect interpretations of competition between agnathans and gnathostomes, because the largest agnathans are estimated to be approximately 1.5 m in length (Janvier Reference Janvier1996), well within an order of magnitude of the taxa measured here, while large Devonian gnathostomes absent from our dataset were estimated to be several meters long (Carr Reference Carr2010) and therefore unlikely to have competed with agnathans. Agnathans and gnathostomes should be equally affected by biased stratigraphic and paleoenvironmental sampling. Competing taxa not preserved as body fossils are possible; therefore, our conjectures are limited to the agnathan and gnathostome groups represented in this study.
Measurements
Measurements were selected with the intent to record morphological aspects of the body relative to standard length: specifically, the size and shape of the fins, the tail, and the head. We took 29 measurements (Fig. 1, Supplementary Table T1) from 254 nearly complete fossil specimens representing 120 taxa. The measurements chosen are ecologically relevant, for example, depth or width of the body, the caudal peduncle, and the tail and the relative size and shape of paired and median fins (Webb Reference Webb1988; Compagno Reference Compagno1990; Friedman et al. Reference Friedman, Price, Com, Larouche, Martinez and Wainwright2020). All measurements from the original specimen or a cast were taken in person, while ImageJ was used for photographs. An exception is Tetanopsyrus lindoei (Acanthodii) for which some specimen measurements were taken from Gagnier et al. (Reference Gagnier, Hanke and Wilson1999).
Structures were considered analogues rather than homologues, because correlation between competition and morphology reflects a similarity in function, not ancestry. Fin-like structures were categorized based on location on the body rather than presumed homology, because similar structures on early vertebrates are not necessarily homologous (but see Wilson et al. Reference Wilson, Hanke, Märss, Anderson and Sues2007). For example, the cornual processes on Doryaspis (Heterostraci) are treated as “pectoral fins,” because they are paired, located adjacent to the head, not ventral, and most equivalent to a paired lateral control surface (see Errivaspis in Botella and Farina Reference Botella and Farina2008). In the case of spines with an attached fin (e.g., acanthodians) the fin and spine are considered a single fin. When spines are present with an unattached pectoral fin (e.g., Osteostraci), the pectoral fin was measured alone and the spine was considered part of the head, because the separated pectoral fin is the primary surface for controlling or manipulating flow. Paired fins along the ventral margin, including pelvic fins, were treated collectively as ventral paired fins (Supplementary Table T1).
Measurements were chosen such that the effects of distortion and taphonomy were minimized. For fins, the leading edge (anterior edge of the base of the fin to the distal edge of the fin) was typically measured instead of fin height, because the fins were often collapsed and the maximum height of the fins was not preserved. Height was measured in a few cases where the fin was long, low, and rigid and the leading edge would be exceedingly long, difficult to ascertain, and not representative of the shape of the fin (noted in Supplementary Table T3).
Measurements were recorded to the nearest 0.1 mm using Vernier calipers or with a measuring tape (to the nearest millimeter) for specimens and structures over 300 mm, or were rounded to the nearest 0.1 mm for measurements taken using ImageJ. All measurements are reported relative to standard length (Fig. 1). When specimens were arched or bent, distance and body length (head length, standard length, and total length) measurements were taken as cumulative measurements (typically two or three) along the midline of the body, starting at the rostrum. When multiple specimens of the same taxon were measured, the proportionate measurements were averaged for that taxon. All distance measurements were taken parallel to the long axis of the specimen (Fig. 1A,D). Measurements for absent fins were recorded as zero (the minimum possible value) for length, leading edge, and base and as not applicable (“-” in data sheet) for fin distance. Measurements that were missing due to incomplete specimens or ambiguous due to preservation were also recorded as not applicable (“-”).
Measurements varied more among taxa, than within taxa, with several exceptions. Orbit height was excluded, because variation within taxa was greater than variation among specimens for seven taxa. Width measurements of Drepanaspis (interorbital distance, maximum head width, and head width distance) varied substantially among specimens, with variance likely due to distortion. There are two morphotypes for Drepanaspis: a wide morphotype and an elongate morphotype, and the direction of distortion likely determines the morphotype. Three specimens of each morphotype were measured so that the average of these measurements across all six specimens provided a relatively accurate representation of the undistorted measurements, assuming the magnitude of distortion is independent of the direction in which a specimen is distorted. The dorsal and ventral fins of the diphycercal tail of sarcopterygians were treated as part of the tail.
Distance Matrix
The problems of missing data in a morphometric analysis are unique to each dataset and research question (Brown et al. Reference Brown, Arbour and Jackson2012; Arbour and Brown Reference Arbour and Brown2014). Early vertebrates are disparate in their body forms, varying in the presence and absence of many fins and the length and shape of head and body armor, which results in few external structures that are homologous across all taxa in the study. Because our dataset includes biologically relevant values of zero for fin size or leading-edge length, we are unable to log transform the data. Instead, the dataset was z-transformed to avoid disproportionate influence of larger measurements (e.g., posterior dorsal fin distance compared with orbit length); that is, for each variable, the mean was subtracted from each measurement and values were divided by the variable's standard deviation (Jain et al. Reference Jain, Nandakumar and Ross2005).
Size (standard length or total length) was not included in order to avoid size-related assumptions about ecomorphology of taxa, given the uncertainty of individuals’ sexual maturity and range of sizes of each taxon. Isometry of body form is generally common among aquatic vertebrates (Kovac et al. Reference Kovac, Copp and Francis1999; Long et al. Reference Long, Porter, Root and Liew2010; Irschick and Hammerschlag Reference Irschick and Hammerschlag2015), although tail morphology can vary with ontogeny (within species in our dataset, only recognized for Cowralepis among taxa with more than one specimen). Allometry has been found frequently in modern teleosts (e.g., Karachle and Stergiou Reference Karachle, Stergiou and Wahl2012); however, teleosts are a very derived group, and these studies are often usually focused on head and mouth morphology, along with tail morphology. For our dataset on body form in more basal clades, proportions are assumed to be representative of each taxon independent of the size of the individuals. Within the taxa for which multiple specimens were sampled, isometry is approximately accurate, except for Cowralepis, in which head length and tail size vary by age (Ritchie Reference Ritchie2005).
To account for the differences across Silurian and Devonian vertebrates and to include incomplete specimens, we used Gower's dissimilarity coefficient (Gower Reference Gower1971), employing the gower function in the cluster package in R (R Core Team 2020; Maechler et al. Reference Maechler, Rousseeuw, Struyf, Hubert and Hornik2021), to estimate the amount of difference in body form between taxa. Estimation techniques would impose values where none are appropriate for some taxa, so estimation techniques could not be used to allow for missing values. Gower's dissimilarity coefficient more accurately represents morphospace than many estimation techniques as well as other non-estimation techniques (Brown et al. Reference Brown, Arbour and Jackson2012).
Using Gower's coefficient introduces one important possible bias: missing values were treated as zero. Because the measurements are normalized to a mean of zero, missing values were effectively treated as the mean. Incomplete taxa are therefore more likely to be similar to each other and to taxa with average measurements. Measurements of absent features (not simply missing), originally zero, were the minimum values for each measurement, so absence of a variable is distinct from incompleteness of that variable.
The values of pairwise distance are arbitrary, but the relative values can demonstrate differences in the amount of morphological similarity between one agnathan–gnathostome pair and another. To determine which groups of gnathostomes are most and least similar to agnathans, we grouped pairwise distances between agnathans and gnathostomes by class (e.g., the pairwise distances between osteostracans and chondrichthyans). The exceptions for this are the placoderms and thelodonts. Placodermi was subdivided by order because of the broad range of body forms within the class (Young Reference Young2010) along with possible paraphyly of placoderms (Brazeau and Friedman Reference Brazeau and Friedman2015) and prior observations of similarities among different placoderm orders and agnathan classes (e.g., Janvier Reference Janvier1996; Johanson Reference Johanson2003; Long Reference Long2011). Thelodonti was subdivided into fork-tailed thelodonts and non-fork-tailed thelodonts because of the large morphological separation of fork-tailed thelodonts from other early vertebrates (see “Results”).
Principal Coordinate Analysis
Gower's dissimilarity coefficient generates a matrix of Euclidean distances, rather than the covariance matrix used in principal components analysis. Principal coordinate analysis (PCoA) was used to compare the body forms of agnathans and gnathostomes. In R we generated a PCoA from the Gower's dissimilarity matrix using the pcoa function in the ape (analysis of phylogenetics) package (Paradis and Schliep Reference Paradis and Schliep2019); a lingoes correction was applied to compensate for negative eigenvalues. Without covariance of measures, loadings on each axis could not be determined, but could be approximated using the coefficient of determination of each measure. The most important measure across the first four axes was identified by regressing each measure against each axis. The distribution of values was then plotted against axes 1 and 2, and 3 and 4 if the r 2 of a variable was greater than 0.20. Multivariate analyses of variance (MANOVAs) were used to test for significance of differences in the position of agnathans and gnathostomes on axes 1 and 2. The same tests were used for differences in the position of each group (classes, Placodermi subdivided by orders, and Furcacaudiformes distinguished from Thelodonti). Results for axes 3 and 4 are included as Supplementary Material.
The overall effect of missing data is expected to reduce the distance between taxa that are missing large amounts of data and may drive some of the variance in pairwise distances observed in the results. Completeness does correlate with axes 1 and 4 (p-value < 0.001, Pearson correlation test); however, this primarily corresponds with the presence or absence of fins: Sarcopterygii and Acanthodii have all of the possible fins that we measured, while most heterostracans lack any median or paired fins, except for a caudal fin. Size shows a correlation with axis 2, but this is likely due to the small size of furcacaudiform thelodonts (SL = 20.9–72.7 mm) relative to the placoderm Watsonosteus (SL = 452.0 mm) and chondrichthyan Cladoselache (mean SL = 562.1 mm), outliers relative to other early vertebrates in the dataset. For completeness or size, the coefficient of determination (r 2) is very low, so very little of the variation in completeness or size is accounted for by the distribution of taxa on PCoA axes 1–4 (Supplementary Table T2) and positions of taxa are generally consistent with pairwise distances, so trends in the PCoA plots are interpreted as indicative of early vertebrate morphospace.
Results
Our goal with the PCoA is to visually approximate the similarities and differences among groups and relate those to the features that distinguish or overlap among early vertebrates. PCoA axes 1 and 2 are very consistent with the overall trends in similarity and difference among early vertebrate pairwise distances (see “Pairwise Distances”), and do not show effects from size or completeness of specimens; therefore, we chose to focus on the results of axes 1 and 2 of the ordination.
Principal Coordinate Axes 1 and 2
Principal coordinate axes 1 and 2 (axis 1 on the horizontal axis, axis 2 on the vertical axis) show distribution of early vertebrate groups approximated by the first two axes of Euclidean distances. The distribution of morphometric variables across axes 1 and 2 can be estimated from the r 2 values (Supplementary Table T2). To better visualize the distribution of variables and taxonomic groups across axes 1 and 2, we delineated six regions within the morphospace (not necessarily representative of any specific ecology or habitat use): three regions on the top and three regions on the bottom (Fig. 2). With axis 1 on the x-axis and axis 2 on the y-axis, axis 1 corresponds to head length, the position of the eye (also the length of the rostrum), and the presence and size of paired and median fins (Fig. 2, Supplementary Table T2). Axis 2 corresponds to the depth of the caudal peduncle, the size of the tail, orbit length, and body depth.

Figure 2. Principal coordinate plot of axes 1 and 2. A, Distribution of taxa colored by class. Taxa labeled on Supplementary Fig. S2. B–E, Distribution of measurements proportionate to standard length. Blue (dark) are high values; green (light) are low values; beige (lightest) are not recorded. Gray dots are individuals without recorded values. B, Max depth. C, Caudal peduncle depth. D, Anal fin leading-edge length. E, Head length.
Taxa in the upper left had long, wide heads with small eyes and either no fins or only pectoral fins. The upper left encapsulates heterostracans and phyllolepid placoderms. The upper center is less consistent by characteristics. Some fins (in addition to pectoral fins) are present. The anal fin and posterior dorsal fin are small. The anterior dorsal fin is often present but can vary substantially in size. Heads are shorter than in the heterostracan morphospace, but still longer than in the top right (Fig. 2E). The left side of this region is mostly osteostracans and placoderms overlapping throughout the center with thelodonts, actinopterygians, chondrichthyans, and acanthodiform acanthodians (small posterior dorsal fins, no anterior dorsal fin). Anaspida border the bottom of this region. The upper right almost entirely consists of acanthodians and sarcopterygians; no agnathans are located there (Fig. 2). Taxa in the upper right have many large fins and small heads, the eyes are located far forward. The bottom center is solely the domain of fork-tailed thelodonts, characterized by large eyes, deep bodies, deep caudal peduncles, and large tails relative to their standard length. Central along axis 1, furcacaudiforms also have small median and paired fins. There are no early vertebrates in the bottom left (big heads, no fins, large eyes, large tails, and deep bodies) or bottom right (small heads, large median and paired fins, large eyes, large tails, and deep bodies).
Results from the MANOVA test show significant differences in morphospace occupation along axes 1 and 2 at both the level of agnathans and gnathostomes (p-value < 0.001) and across individual groups (p-value < 0.001). Note that the group comparison is done at the level of class, with Placodermi subdivided by orders and Furcacaudiformes distinguished from Thelodonti.
Pairwise Distances
Gower's pairwise distances of each taxon represent the Euclidean distances between taxa. More similar taxa have lower distances and more different taxa have higher distances (Fig. 3). The pairwise distances among Silurian and Devonian agnathans and gnathostomes vary widely, but no single group of gnathostomes was more similar to agnathans than any other group of gnathostomes; this includes antiarchs and osteostracans, as well as heterostracans and phyllolepids, despite overlap of these groups on the first two PCoA axes. The patterns of pairwise distances are largely consistent with the distribution of taxa along axes 1 and 2 of the PCoA. The gnathostome group least similar to agnathans was the rhenanid placoderm Gemuendina (the only rhenanid included in the analysis). The median distance of Gemuendina from Anaspida, Osteostraci, and Thelodonti (from here on referred to as non-fork-tailed thelodonts; Fig. 3A,B,E,F) was greater than the median values for each other gnathostome group. The fork-tailed thelodonts are the agnathans least similar to gnathostomes (Fig. 3C). Thelodonti and Osteostraci were more similar to gnathostomes than Anaspida and Heterostraci (Fig. 3). The Acanthodii are notably different from the Heterostraci (Fig. 3D).

Figure 3. Box plot of pairwise distances between agnathan and gnathostome groups. A, Anaspida. B, Furcacaudiformes, note the greater pairwise distances compared with other agnathans. C, Heterostraci. D, Osteostraci. E, Thelodonti, excluding Furcacaudiformes. F, Example diagrams showing a body shape of each agnathan group in the analysis. Showing y- axis to the same scale on all diagrams. Center line of each box plot is median; lower and upper edges of the box are 1st and 3rd quartiles.
Discussion
Determining the likelihood of the competition hypothesis for the agnathan/gnathostome transition requires explicitly defining competition and measurable proxies for habitat use. We defined competition as taxa using the same resources (food, habitat) at the same time and in the same place. Taxa that use the same resources converge on similar morphologies, and therefore taxa that are more similar are more likely to compete, while taxa that are more different are less likely to compete. Our methods, particularly the use of Gower's dissimilarity coefficient, are biased toward overestimating similarity of taxa. Therefore, our most robust conclusions are about those groups that are most different and therefore least likely to have competed.
While we use our dataset to speculate on how the body forms of early vertebrate groups relate to foraging or habitat use, we acknowledge the potential for substantial differences in selective pressures between extant and Silurian–Devonian ecosystems. There are obvious differences in the dominant animal groups forming the biotic environments throughout the Silurian and Devonian compared with modern faunas (Sepkoski and Miller Reference Sepkoski, Miller and Valentine1985). There may also be substantial differences in the occupied niches and the transfer of nutrients throughout aquatic ecosystems (Bambach et al. Reference Bambach, Knoll and Sepkoski2002; Bush and Bambach Reference Bush and Bambach2011). This means that pressures on foraging and habitat use in aquatic vertebrates may have differed from the selective pressures in modern ecosystems. A body form that resembles benthic taxa in an extant ecosystem could very well be successful for foraging or inhabiting different niches in Paleozoic taxa. For this study, we have assumed that the biomechanical constraints of aquatic locomotion have resulted in convergence or divergence in early vertebrate groups. We cautiously extend these biomechanical constraints on locomotor performance to ecology and identify potential trends in overlapping early vertebrate ecology based on their morphospace.
Least Likely to Compete
The gnathostome group least likely to have competed with agnathans is the order Rhenanida (represented here by Gemuendina stuertzi) and the agnathan group least likely to have competed with gnathostomes is the Furcacaudiformes (fork-tailed thelodonts; Wilson and Caldwell Reference Wilson and Caldwell1993, Reference Wilson and Caldwell1998; hereafter distinct from Thelodonti). Rhenanida, a group of placoderms superficially resembling extant rays (Batoidea, Chondrichthyes), have the greatest pairwise distance from Osteostraci and Thelodonti of any gnathostome group (Fig. 3) and are at least as different as other gnathostome groups from furcacaudiforms and anaspids. Acanthodians are the most different from heterostracans (Fig. 3D), primarily shown at opposite ends of axis 1 of the PCoA (Fig. 2). Climatiiform and diplacanthiform acanthodians in particular do not overlap with agnathans on axis 1, with their small heads and large posterior dorsal fins and anal fins.
If axis 1 represents an ecological as well as morphological axis, then acanthodians, positive on axis 1, with large fins and therefore numerous control surfaces, could have occupied or at least foraged in more complex habitats (Felley Reference Felley1984; Webb Reference Webb1984), with taxa that are more negative along axis 1 occupying increasingly simpler or more open-water habitats (Fig. 3, Supplementary Fig. S3). Taxa that are far negative on axis 1 have large heads that include large branchial arches, features that are consistent with adaptations for hypoxic environments. The lack of large fin or fin-like surfaces other than tails on heterostracans and the jawed vertebrates (phyllolepids) that overlap with them may have also limited these taxa to simple benthic or open-water environments.
Among agnathans, the fork-tailed thelodonts are remarkably different from gnathostomes compared with other agnathan groups (Fig. 3C). It is unlikely that Furcacaudiformes were driven to extinction by competing gnathostomes. Plotted on PCoA axis 2, Furcacaudiformes have a deep body, deep caudal peduncle, and large tail morphology distinct from any other early vertebrates, including any known gnathostomes. The deeper body form of furcacaudiforms loosely resembles extant reef fish (e.g., Fig. 2F; Gerstner Reference Gerstner1999: fig. 1), and the Man On The Hill (MOTH) locality (where they are exclusively found in articulation; Wilson and Caldwell Reference Wilson and Caldwell1998) is interpreted as a topographic low with an influx of material from an up-shelf reef complex (Zorn et al. Reference Zorn, Caldwell and Wilson2005). Such reef complexes are common in the Early Devonian and a possible habitat for fork-tailed thelodonts. While data are insufficient to fully reject competition between Furcacaudiformes and gnathostomes, the present analysis and available evidence support an alternative reason, such as habitat loss (the primary reef builders associated with MOTH deposits are not known, but reef-building organisms changeover considerably from the Silurian through the Devonian; Wood Reference Wood1999) and/or environmental change (Janvier and Newman Reference Janvier and Newman2005), for their extinction.
Most Likely to Compete
Past research has explicitly predicted competition between Phyllolepida and Heterostraci, specifically psammosteid heterostracans based on morphological similarities, overlapping biogeography, and stratigraphic changeover from psammosteids to phyllolepids (Long Reference Long2011). Consistent with these predictions, heterostracans share their own region of morphospace exclusively with Phyllolepida (Fig. 2A, upper left), despite overall differences in body form (Fig. 3C). This region is characterized by large armored heads and trunks, with few or no fins other than the tail. If competition is a plausible interaction, we would also expect the shared characteristics to be ecologically and functionally relevant but not the differences (e.g., no or vestigial eyes, large dorsal lobe of the tail in phyllolepids; Ritchie Reference Ritchie2005). Heterostracans have been hypothesized to be microphagous suspension feeders (Purnell Reference Purnell2001a), and given the similarities in proportions and head size between heterostracans and phyllolepids it is possible that phyllolepids engaged in similar foraging behavior and both taxa may have been adapted for hypoxic habitat (see “Morphological Similarity and Competition”).
Anaspida, Osteostraci, and Thelodonti may have competed with gnathostomes, as all three agnathan groups overlap stratigraphically and geographically with gnathostome taxa (Dineley and Loeffler Reference Dineley, Loeffler and Long1993; Janvier and Blieck Reference Janvier, Blieck and Long1993; Newman and Trewin Reference Newman and Trewin2001; Young Reference Young2010) and are in the same morphospace on axes 1 and 2 (Fig. 2). However, body forms across the region are highly variable, and no specific gnathostome group is more similar to agnathans than any other group (Fig. 3), and even similar taxa may be sufficiently different to avoid competition with one another. For example, the differences within osteostracan and thelodont morphospaces may represent a wide diversity of ecological roles (Ferron et al. Reference Ferron, Martinez-Perez, Turner, Manzanares and Botella2018, Reference Ferron, Martinez-Perez, Rahman, de Lucas, Botella and Donoghue2020, Reference Ferron, Martinez-Perez, Rahman, de Lucas, Botella and Donoghue2021). Agnathan and gnathostome taxa in the center of axes 1 and 2 (Fig. 3, Supplementary Fig. S3) vary in the size of the anterior dorsal fin and the pectoral and pelvic fins, but share moderately tall tails and bodies of moderate depth approaching a streamlined fineness ratio (Supplementary Fig. S5). These features are common in open-water taxa and generalist foragers (Webb Reference Webb1984; Fletcher et al. Reference Fletcher, Altringham, Peakall, Wignall and Dorrell2014; Mihalitsis and Bellwood Reference Mihalitsis and Bellwood2019). The forms found in this central region of morphospace encompass a wide range of taxa, including thelodonts and gnathostome taxa (Chondrichthyes, Actinopterygii, some Sarcopterygii, and Acanthodii, especially acanthodiforms). However, the presence of osteostracans and antiarch placoderms in this region is contrary to the generalist morphologies of other taxa. Osteostraci are typified by ventral mouths, and close-together dorsal eyes, consistent with extant benthic taxa (e.g., Eastman Reference Eastman1993; Matthews Reference Matthews1998), but many osteostracan taxa also have relatively tall bodies and tails, features consistent with a possible active lifestyle (Afanassieva Reference Afanassieva and Mark-Kurik1992) in simple habitats.
Antiarch placoderms overlap with osteostracan morphospace (Fig. 2A), and their morphological similarities—narrow bases of the pectoral fins and far back posterior dorsal fins and small caudal peduncles—may represent convergent morphologies (consistent with competition; Janvier Reference Janvier1996) or may be the result of phylogenetic relatedness (Johanson Reference Johanson2003; Brazeau and Friedman Reference Brazeau and Friedman2015). Currently, we cannot differentiate between convergence and historical constraints between antiarchs and osteostracans, because antiarchs are basal gnathostomes (Brazeau and Friedman Reference Brazeau and Friedman2015) and therefore phylogenetically close to osteostracans (sister group of Gnathostomata; Janvier Reference Janvier1996).
Our results are consistent with prior hypotheses of competition between specific groups of agnathans and gnathostomes, specifically osteostracans and antiarch placoderms, and heterostracans and phyllolepid placoderms (Janvier Reference Janvier1996; Long Reference Long2011), that are similar in body form and overlap geographically and stratigraphically. But overall competitive exclusion of agnathans by gnathostomes is not supported, though competition cannot be rejected without knowing how much species must differ morphologically before competition can be rejected. If competition between phyllolepids and heterostracans and between antiarchs and osteostracans can be refuted, it is unlikely that competition from gnathostomes forced Silurian and Devonian agnathans to extinction.
Acknowledgments
We would like to thank the following people and institutions for access to collections and hospitality: E. Bernard and Z. Johanson, Natural History Museum (London); S. Walsh, National Museum of Scotland (Edinburgh); F. Witzmann, Museum für Naturkunde (Berlin); A. Gishlick, American Museum of Natural History (New York City); A. Murray, University of Alberta (Edmonton); and M. Ryan and A. McGee, Cleveland Museum of Natural History. We would like to thank B. Fuller, C. Cheng, and M. Wilson for discussion of this work. Comments from anonymous reviewers contributed greatly to improving this article. We would also like to thank M. Skrip for help with data collection, discussion, and comments on this article. Funding was provided through a dissertation travel grant, University of Illinois Urbana-Champaign (UIUC) College of Graduate Studies; the Odum-Kendeigh Award, Evolution Ecology and Behavior, UIUC; and the Ross Memorial Award, UIUC Illinois Natural History Survey. The authors declare that this article is published without conflicts of interest.
Data Availability Statement
All raw data (Supplementary Table T3), R code, and additional Supplementary Material is available on Dryad: https://doi.org/10.5061/dryad.31zcrjdpk.


 Open access