


Introduction
There are striking generalities in the organization of biodiversity around the Earth: in benthic marine clades, for instance, the number of kinds of organisms is often greatest at low latitudes (Mittelbach et al. Reference Mittelbach, Schemske, Cornell, Allen, Brown, Bush, Harrison, Hurlbert, Knowlton, Lessios, McCain, McCune, McDade, McPeek, Near, Price, Ricklefs, Roy, Sax, Schluter, Sobel and Turelli2007), peaks at intermediate depths (Rex and Etter Reference Rex and Etter2010), and exhibits a longitudinal gradient with a maximum around the Indo-West Pacific region (Worm and Tittensor Reference Worm and Tittensor2018). Cross-clade patterns like these are encouraging for the prospect of developing a unified science of biodiversity, but widely successful process-based explanations for such generalities remain elusive. Historically, most accounts of diversity gradients have involved diversification—local differences in speciation or extinction (Mittelbach et al. Reference Mittelbach, Schemske, Cornell, Allen, Brown, Bush, Harrison, Hurlbert, Knowlton, Lessios, McCain, McCune, McDade, McPeek, Near, Price, Ricklefs, Roy, Sax, Schluter, Sobel and Turelli2007; Roy and Goldberg Reference Roy and Goldberg2007). But recent phylogenetic and paleontological studies have cast doubt on this mode of explanation: spatial gradients in estimated diversification rates are commonly uncorrelated with or even run opposite to diversity gradients (Powell and Glazier Reference Powell and Glazier2017; Rabosky et al. Reference Rabosky, Chang, Title, Cowman, Sallan, Friedman, Kaschner, Garilao, Near, Coll and Alfaro2018; O'Hara et al. Reference O'Hara, Hugall, Woolley, Bribiesca-Contreras and Bax2019; Harvey et al. Reference Harvey, Bravo, Claramunt, Cuervo, Derryberry, Battilana, Seeholzer, McKay, O'Meara, Faircloth, Edwards, Pérez-Emán, Moyle, Sheldon, Aleixo, Smith, Chesser, Silveira, Cracraft, Brumfield and Derryberry2020; Igea and Tanentzap Reference Igea and Tanentzap2020). Alternate theories of global biodiversity incorporate the process of dispersal, but typically through the movement of lineages from high-diversity to low-diversity regions, as in the “out of the tropics” model (Jablonski et al. Reference Jablonski, Belanger, Berke, Huang, Krug, Roy, Tomasovych and Valentine2013) or in source-sink explanations for deep-sea diversity (Rex et al. Reference Rex, McClain, Johnson, Etter, Allen, Bouchet and Warén2005). With some important exceptions (Stebbins Reference Stebbins1974; Powell and Glazier Reference Powell and Glazier2017; Vasconcelos et al. Reference Vasconcelos, O'Meara and Beaulieu2022), dispersal is not frequently considered as a cause of concentrated richness. In this paper, we contrast such a model against alternatives as an explanation for the center of biodiversity in the modern oceans.
The Indo-West Pacific “hotspot” of diversity in the shallow-marine benthos is observed in groups as ecologically disparate as fishes, corals, mollusks, large benthic foraminifera, mangroves, stomatopods, and seagrasses (Reaka et al. Reference Reaka, Rodgers and Kudla2008; Renema et al. Reference Renema, Bellwood, Braga, Bromfield, Hall, Johnson, Lunt, Meyer, McMonagle, Morley, O'Dea, Todd, Wesselingh, Wilson and Pandolfi2008; Bellwood et al. Reference Bellwood, Renema, Rosen, Gower, Johnson, Richardson, Rosen, Rüber and Williams2012; Rabosky et al. Reference Rabosky, Chang, Title, Cowman, Sallan, Friedman, Kaschner, Garilao, Near, Coll and Alfaro2018; Worm and Tittensor Reference Worm and Tittensor2018). The hotspot is geologically young: local genus richness counts of benthic foraminifera and paleontological first occurrences from diverse groups indicate that the center of shallow-marine richness shifted eastward from the West Tethys (where the Mediterranean is today) to the Indo-West Pacific in the Neogene (Renema et al. Reference Renema, Bellwood, Braga, Bromfield, Hall, Johnson, Lunt, Meyer, McMonagle, Morley, O'Dea, Todd, Wesselingh, Wilson and Pandolfi2008). Less well established than this pattern of eastward movement are the processes underlying it. Explanations have contrasted the west-to-east movement of a single fauna with the flare-ups and die-downs of successive hotspots (Renema et al. Reference Renema, Bellwood, Braga, Bromfield, Hall, Johnson, Lunt, Meyer, McMonagle, Morley, O'Dea, Todd, Wesselingh, Wilson and Pandolfi2008), or alternatively, scenarios of elevated dispersal into the hotspot, elevated extinction outside, and elevated origination within (Huang et al. Reference Huang, Goldberg, Chou and Roy2018). These possibilities and combinations thereof remain plausible today and cannot be addressed solely by counts of raw richness through time; instead, discriminating among competing explanations for the hotspot will probably require a synthesis of phylogenetic and paleontological information.
Here we bring independent lines of paleontological and neontological evidence to bear on the origin of the center of modern marine richness in a group whose historical biogeography has received relatively little study: comatulid crinoids. These strictly marine, benthic, suspension-feeding echinoderms make up most crinoid diversity today (612/672 species; Messing Reference Messing2022) and are conspicuous on coral reefs across the tropics. They occur worldwide from the intertidal to the deep sea, and their species richness is today highest in the Indo-West Pacific (Fig. 1A), with more than 50 species reported from an individual island in the Great Barrier Reef (Messing Reference Messing, Waters and Maples1997). Although comatulid larvae apparently spend relatively little time in the water column (Holland Reference Holland, Giese, Pearse and Pearse1991; but see Torrence et al. Reference Torrence, Correia and Hoffman2012), comatulid populations can show high genetic connectivity across great distances (Hemery et al. Reference Hemery, Eléaume, Roussel, Améziane, Gallut, Steinke, Cruaud, Couloux and Wilson2012; Torrence et al. Reference Torrence, Correia and Hoffman2012), suggesting good dispersal ability. We used ancestral-range reconstruction on a phylogeny of extant comatulids, compiled a comprehensive fossil occurrence database and interrogated it with new taphonomic analyses, and estimated the phylogenetic affinities of fossil comatulids to interpret this record in terms of biogeographic processes. Our results yield consilient insights into the origins of the center of modern marine richness.

Figure 1. Biogeography of extant and fossil comatulids. A, The number of species recorded in the Ocean Biogeographic Information System for each 10° cell on earth. B, Phylogenetic diversity in each 10° cell, quantified as the total length of the tree of all species in a given cell. C, Fossil comatulid occurrences in each of 10 time intervals from the Early Jurassic to the Plio-Pleistocene, with echinoderm-bearing localities shown for comparison.
Methods
Extant Comatulids
We generated maps of species richness and phylogenetic diversity to quantify the hotspot in comatulids. Here, Comatulida is the smallest monophyletic group including every crinoid with a centrodorsal ossicle; this clade also includes some small groups of stalked crinoids (Rouse et al. Reference Rouse, Jermiin, Wilson, Eeckhaut, Lanterbecq, Oji, Young, Browning, Cisternas, Helgen, Stuckey and Messing2013). We calculated species richness in each 10° square cell on the globe using a database of 26,309 species-level occurrences downloaded from the Ocean Biogeographic Information System (OBIS 2021; Supplementary Appendix). Sampling in the OBIS occurrence database is spatially uneven, but does not show obvious geographic biases and is sufficient to demonstrate the pattern of exceptional Indo-West Pacific diversity (Supplementary Fig. S1).
To calculate phylogenetic diversity, facilitate ancestral-range reconstruction, and constrain cladistic analyses with fossils, we inferred the relationships among 160 extant comatulid species and 9 crinoid outgroup taxa using an alignment of four genes (16S, 28S, COI, CytB; total length 5823 bp). These markers were available for 83%, 85%, 100%, and 33% of species in the alignment, respectively. We aligned sequences with MAFFT (Katoh and Standley Reference Katoh and Standley2013) and assigned each gene to its own partition in a maximum-likelihood phylogenetic analysis implemented in RAxML using the GTR+Γ model (Stamatakis Reference Stamatakis2014). The resulting topology largely agrees with previous investigations of comatulid phylogeny (Hemery et al. Reference Hemery, Roux, Ameziane and Eléaume2013; Rouse et al. Reference Rouse, Jermiin, Wilson, Eeckhaut, Lanterbecq, Oji, Young, Browning, Cisternas, Helgen, Stuckey and Messing2013; Cohen and Pisera Reference Cohen and Pisera2017). After removing outgroups, we time-scaled this phylogeny using penalized likelihood as implemented in treePL (Smith and O'Meara Reference Smith and O'Meara2012). Crown Himerometroidea was constrained to diverge before the end of the Eocene (33.9 Ma) based on Eocene Himerometra (Strimple and Mapes Reference Strimple and Mapes1984). The clade containing Thalassometridae and Comatulidae was constrained to diverge before the end of the Aquitanian (20.44 Ma) based on Comaster formae (Rouse et al. Reference Rouse, Jermiin, Wilson, Eeckhaut, Lanterbecq, Oji, Young, Browning, Cisternas, Helgen, Stuckey and Messing2013). Finally, crown Comatulida was set to diverge, somewhat arbitrarily, at the start of the Jurassic (201.3 Ma). Importantly, the analyses in this paper that use the resulting timetree (phylogenetic diversity, ancestral-range reconstruction) depend only on the relative divergence times, and not on these divergence times being absolutely correct. All dates follow ICS 2019/05 (Cohen et al. Reference Cohen, Finney, Gibbard and Fan2013). Nineteen tips—either too incompletely identified or already sharing conspecifics in the tree—were removed from the resulting chronogram.
We calculated phylogenetic diversity in each 10° cell as the sum of branch lengths for the tree containing only the species in that cell. Only 139 of 612 described comatulid species were represented in the final trimmed phylogeny, but representation in the tree does not appear to be biased geographically (Supplementary Fig. S2), so we do not expect the phylogenetic diversity metric to be biased.
For ancestral-range reconstruction, we used biogeographic information in the World Register of Marine Species (Horton et al. Reference Horton, Kroh, Bailly, Boury-Esnault, Brandão, Costello, Gofas, Hernandez, Mees, Paulay, Poore, Rosenberg, Stöhr, Decock, Dekeyzer, Vandepitte, Vanhoorne, Vranken, Adams and Adl2016) and the Ocean Biodiversity Information Database (OBIS 2021) to assign each species to the Atlantic-Mediterranean (AM), Indo-Pacific (IP), or both (widespread; definitions in Supplementary Appendix). These regions encompass the world ocean and are broader than the West/East Tethys scheme used for fossil comatulids (see “Fossil Occurrences”). Available information on comatulid biogeography is probably not very complete, so accurately scoring distributions is a more realistic goal with just two regions. Moreover, we wanted to estimate asymmetry in rates of dispersal, and the number of parameters to infer would become unreasonably large if we used a biogeographic scheme with many regions. We modeled biogeographic history with the dispersal–extinction–cladogenesis model of geographic range evolution, as implemented in the lagrange program (Ree and Smith Reference Ree and Smith2008). This approach estimates values of rate parameters for dispersal, speciation, and local extinction that maximize the probability of observing the empirical geographic ranges on the phylogeny and simultaneously allows the estimation of geographic ranges of ancestors. We fit separate rates for dispersal in either direction (to and from the IP), and used Akaike's information criterion (AIC) to compare models with and without asymmetrical dispersal rates (Fig. 2B). We also calculated likelihood and root reconstructions for dispersal rate ratios between 10−5 and 104.
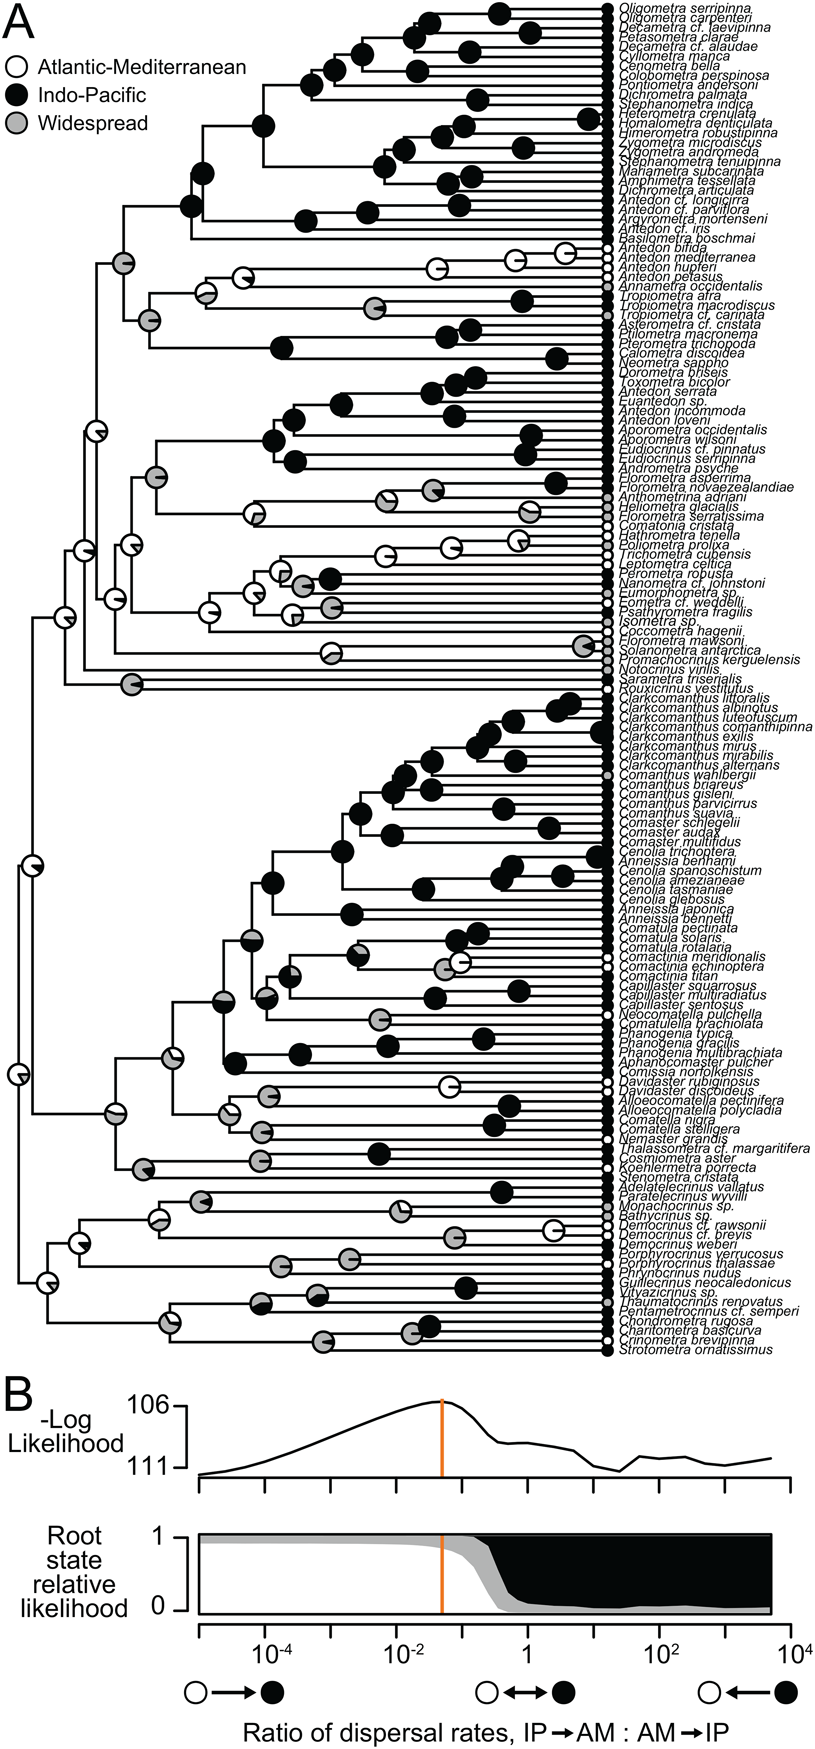
Figure 2. Ancestral-range reconstruction with extant comatulids. A, Molecular phylogeny of 139 species. Shaded circles at tips show observed ranges; pie charts at internal nodes show relative likelihoods of alternate states. B, Model log-likelihood and inferred ancestral ranges at the root for different ratios of the rate of dispersal out of vs. into the Indo-Pacific. Orange line indicates the ratio that maximizes likelihood (shown in A).
Fossil Occurrences
We assembled a new geospatial database of 610 fossil comatulid occurrences comprising 67 genera in 302 localities (Supplementary Appendix). We used two novel analyses to explore whether the absence of comatulids from the Mesozoic East Tethys can be construed as genuine absence. Both analyses used the idea of taphonomic controls, operationally defined here as fossil taxa whose presence in a given locality indicates suitable conditions for the fossilization of the focal group (comatulids) if they were present. We used echinoderms (downloaded from the Paleobiology Database February 2021; Supplementary Appendix) as taphonomic controls because they are globally distributed and share some ecological restrictions like stenohaly, and because non-comatulid echinoderms have multielement skeletons with preservation potential similar to those of comatulids. Thus, the presence of non-comatulid echinoderms at a particular fossil locality indicates that if comatulids were there too, they should have some chance of being fossilized and recovered. We also ran the same analyses using different subsets of the data as taphonomic controls: (1) echinoderms minus irregular echinoids, as these have unique preservational characteristics (Kier Reference Kier1977); and (2) crinoids only.
The first analysis compared two probabilistic models for the observed numbers of West Tethyan and East Tethyan comatulid-bearing localities in each of 10 intervals (Fig. 1C): “equal-chances,” in which each locality has the same chance of yielding comatulids; and “unequal-chances,” in which West and East Tethyan localities have different probabilities (Fig. 3A, Supplementary Appendix). West Tethys here includes Europe and the Mediterranean; the East Tethys includes Asia, East Africa, and Oceania (Supplementary Fig. S3). Each model is treated as an urn problem in which some number N W + N E balls are randomly drawn without replacement from an urn containing T W balls marked “West” and T E balls marked “East,” where N W and N E represent comatulid-yielding localities in the West and East Tethys, and T W and T E represent taphonomic control localities in the West and East Tethys. Under equal-chances, the probability of drawing some combination of balls N W and N E for N W + N E draws is given by the hypergeometric distribution:
 $$P( {N_W, \;N_E} ) = \displaystyle{{\matrix{ \left\langle\matrix{{T_W} \cr {N_W}}\right\rangle \cr } \matrix{ \left\langle\matrix{{T_E} \cr {N_E}}\right\rangle \cr } } \over \left\langle{\matrix{ {T_W + T_E} \cr {N_W + N_E} \cr } }}\right\rangle$$
where  $\left\langle\matrix{ n \cr k \cr }\right\rangle $ indicates the binomial coefficient, n choose k. Under unequal-chances, balls are weighted such that the probability of an individual ball being drawn depends on whether it is marked “West” or “East.” Probabilities are given by Wallenius's noncentral hypergeometric distribution, as implemented in the R package BiasedUrn (Fog Reference Fog2015):
 $$P( {N_W, \;N_E} ) = \matrix{ \left\langle\matrix{{T_W} \cr {N_W}}\right\rangle \cr } \matrix{ \left\langle\matrix{{T_E} \cr {N_E}}\right\rangle \cr } \mathop \int \limits_0^1 \left({1-t^{{\omega \over d}}} \right)^{N_W}\left({1-t^{{1 \over d}}} \right)^{N_E}\delta t\;, \;$$
 $${\rm where}\,d = {\rm \omega }( {T_W-N_W} ) + ( {T_E-N_E} ) $$
and ω is the weight of T W relative to T E. The weight ω that maximizes likelihood can be approximated as (N W/T W)/(N E/T E). For each interval, these two models make different predictions for the number of comatulid-bearing localities observed in each region: for example, given 158 taphonomic control localities in the West Tethys and 69 in the East Tethys in the Middle Jurassic, equal-chances gives a 48% chance that 3 or 4 of the 12 comatulid localities in this interval will be in the East Tethys, and only an ~1% chance that none of them will. Conversely, the maximum-likelihood parameterization of the unequal-chances model has 100% probability of yielding no East Tethyan comatulids (Fig. 3A). We used AIC to compare equal-chances with unequal-chances; the latter is the more complex model with one free parameter to be estimated from the data, ω.
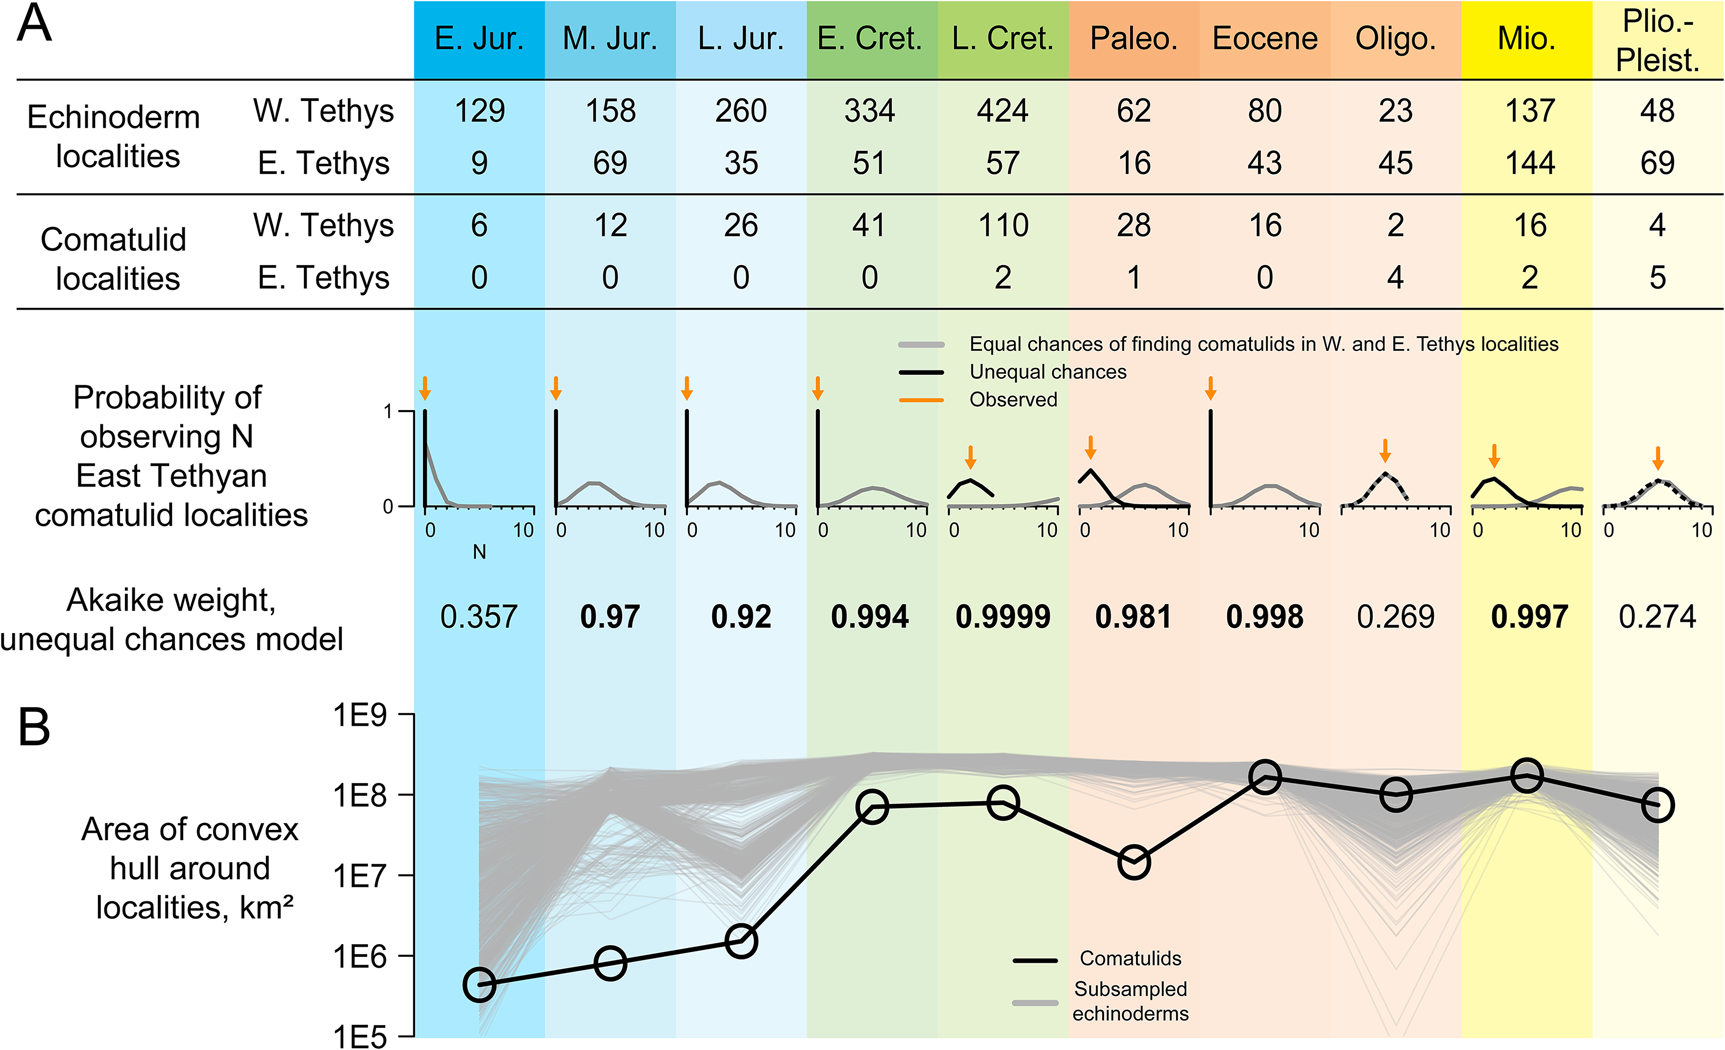
Figure 3. Taphonomic control analyses. A, Numbers of occurrences of echinoderms (including comatulids; used as a taphonomic control) and comatulids in each of 10 intervals, analyzed with respect to two models. Equal-chances treats each echinoderm locality as having an equal chance of yielding comatulid fossils; unequal-chances gives West Tethyan and East Tethyan localities separate chances of yielding comatulids. Plots below show the probability of observing N East Tethyan comatulid localities under both models, with observed N shown as an orange arrow. Akaike weights for the unequal-chances model are shown below those. B, Convex-hull range size of comatulid localities (black) and taphonomic controls randomly subsampled to the same sample size (gray).
A second analysis tested whether the observed geographic expansion of comatulid-bearing localities through the Mesozoic and Paleogene (Fig. 1C) could be explained as resulting simply from changes in the geographic extent of taphonomically appropriate localities (Fig. 3B). We compared the geographic extent (convex-hull area) of comatulid-bearing localities in each interval with that of taphonomic control localities randomly subsampled to the same sample size.
Phylogenetic Placements of Fossils
We built on a previous analysis of fossil comatulid phylogeny (Saulsbury and Zamora Reference Saulsbury and Zamora2020) with added fossil and living taxa and an expanded set of characters. We coded a morphological database of 30 discrete and 24 continuous characters for 24 extant and 7 Jurassic and Cretaceous fossil species, including the Jurassic Paracomatula helvetica as the outgroup. Relationships were inferred using maximum parsimony as implemented in the program TNT (Goloboff et al. Reference Goloboff, Farris and Nixon2003). Implied weighting was not used, all discrete characters were treated as unordered, and all continuous characters were scaled to vary between 0 and 1, so that the maximum possible distance between two continuous character states was equal to a single transition in a discrete character. Supports were calculated with bootstrapping. Relationships among all living taxa were fixed to those in the molecular phylogeny, so this analysis sought the most parsimonious positions of just the six non-outgroup fossil taxa (Supplementary Appendix). We also inferred the positions of fossils with continuous and discrete subsets of the data and of each fossil individually.
Results
Ancestral-Range Reconstruction
Mapping species richness at a 10° scale supports the long-standing contention of comatulid workers that the Indo-West Pacific region hosts exceptionally high diversity (Messing Reference Messing, Waters and Maples1997), with a peak at 94 species in northwestern Australia (Fig. 1A). Phylogenetic diversity shows basically identical patterns (Fig. 1B). This is not necessarily surprising (Rodrigues et al. Reference Rodrigues, Brooks, Gaston, Purvis, Gittleman and Brooks2009), but does suggest that the high Indo-West Pacific diversity is not only due to intense taxonomic effort or the diversification of a single subclade. Ancestral-range estimation with the dispersal–extinction–cladogenesis model (Ree and Smith Reference Ree and Smith2008) on a phylogeny of 139 species infers a dynamic history for this hotspot: the scenario that maximizes likelihood has the comatulid clade and most major subclades originating in the AM, with the rate of dispersal into the IP 20 times that of the rate of dispersal out of it (Fig. 2). The likelihood of the reconstruction decreases smoothly as this dispersal rate ratio is changed in either direction (Fig. 2B), with a ratio of 1 (symmetrical rates) yielding a log-likelihood 3.348 units lower. The AIC therefore favors asymmetrical rates (ΔAIC = 4.696). The relative likelihood of an IP origin for the root increases as the modeled dispersal rate into the IP decreases; with symmetrical rates, an IP origin is favored. In the best model, the dispersal rate from AM to IP is about 0.01 Myr−1 for an expected wait time of 100 Myr for a dispersal. This wait time is perhaps surprisingly long, but explains why geographic states are organized in a coherent way on the phylogeny (Fig. 2A) and is consistent with our paleontological findings.
Fossil Occurrences and Taphonomic Controls
A new occurrence database shows comatulids appearing in the Early Jurassic of western Europe and spreading out gradually from there, appearing in North America in the Early Cretaceous and only reaching as far east as the Caspian Sea by the end of the Cretaceous (Fig. 1C). From the Oligocene, their fossils appear in the IP: the Oligocene of New Zealand, the Miocene of Australia and Japan, and the Pliocene of the Coral Triangle.
It would be hard to justify reading this database as a complete account of comatulid biogeographic history: for example, there are no comatulids recovered from the Miocene–Pleistocene record of Antarctica, but this record barely exists (e.g., Fig. 1C), so it is unclear what this absence means. We used novel taphonomic analyses to test the more limited inference that comatulids originated in the West Tethys and did not become established in their modern hotspot until much later. Taphonomic controls are underrepresented in the East Tethys until the Oligocene, but are present there in every time interval, with 62% as many East Tethyan as West Tethyan localities on average (Figs. 1C, 3A). A model in which every taphonomic control locality has an equal chance of yielding comatulids predicts finding between 3 and 13 comatulid localities in the East Tethys in every interval—except the Early Jurassic, when comatulids first appear in just a few localities. Yet no East Tethyan comatulids are observed until the latest Cretaceous, and there are fewer occurrences there than expected in every interval before the Oligocene. In all these time intervals, AIC favors models in which East Tethyan localities have lower or zero probability of yielding comatulids. Conversely, we observe exactly as many East Tethyan comatulid localities as expected under equal-chances in the Oligocene and the Plio-Pleistocene.
The geographic extent of comatulid fossil localities increases monotonically across all five Mesozoic intervals, and from the Eocene is greater than in any previous interval (Fig. 3B). Until the Eocene, the geographic extent of comatulid fossil localities is smaller by 0.5–2 orders of magnitude than would be expected from subsampling the same number of taphonomic controls. From the Eocene onward, comatulids can be said to have achieved a global distribution, inasmuch as they span an area as great as would be expected by randomly sampling echinoderm localities. For both taphonomic control experiments, different taphonomic control groups yield qualitatively identical results (Supplementary Appendix, Supplementary Fig. S5).
Fossil Placements
A cladistic analysis recovered all fossil comatulids in the crown group (Fig. 4). Fossil placements are roughly similar when using only continuous or discrete characters and when inferring the position of each fossil individually (Supplementary Appendix). Decameros ricordeanus, Decameros wertheimi (both Early Cretaceous), and Solanocrinites depressus (Late Jurassic) form a relatively well-supported clade near Tropiometra, consistent with previous studies (Saulsbury and Zamora Reference Saulsbury and Zamora2020). Precise placements for the other three fossils are less certain but all well supported as being in the crown, generally outside the clade containing Heliometra and Cenometra but closer to that clade than to Crinometra. In no variation of the phylogenetic analysis do any comatulid fossils come out in the stem group (Supplementary Appendix). Notably, all placements are consistent with ancestral-range estimation (Fig. 2): all fossils attach to branches inferred to be either AM or widespread (Supplementary Fig. S4).
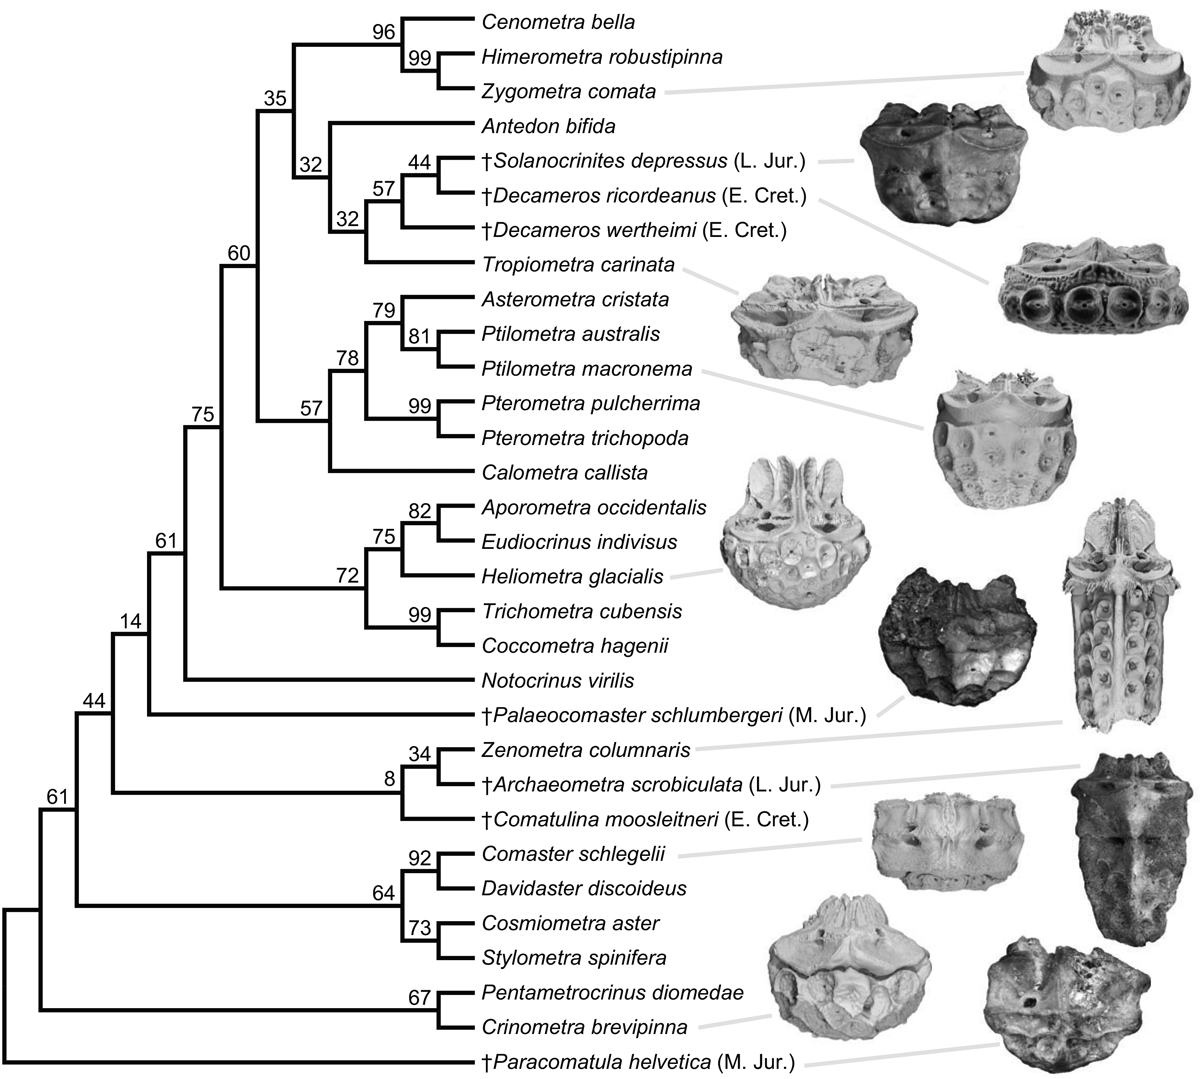
Figure 4. Single most parsimonious phylogeny of 24 extant and 7 Mesozoic fossil comatulid crinoids, inferred with 30 discrete and 24 continuous characters. Ages shown for fossil species using the abbreviations from Fig. 3. Bootstrap supports shown. Frequently only the calyx of fossil comatulids is preserved; photographs of fossil calyces and renders based on computed tomography scans of extant comatulids are shown for select species.
Discussion
Neontological Evidence
The preponderance of extant comatulid diversity is in the IP, and these species come from across the phylogenetic tree; nevertheless, ancestral-range reconstruction favors an origin in the AM and elevated dispersal into the IP (Fig. 2). This result is related to the proportion of IP tips in the tree, which becomes harder and harder to explain as the modeled rate of dispersal into the IP decreases (Nosil and Mooers Reference Nosil and Mooers2005). But the distribution of states in extant comatulids by itself cannot explain our results: when we randomly shuffled the assignment of geographic states to tips and reran the analysis, an IP origin was always inferred, and 9 of 10 trials inferred a dispersal rate into the IP that was lower than in the opposite direction (Supplementary Appendix). We therefore take the results of our ancestral-range estimation exercise as meaningful, but with two caveats. First, definitions of AM and IP become vague deep in the past, especially before the Atlantic opens in the Jurassic. Second, studies of the evolution of discrete characters have found that asymmetric trait evolution and state-dependent diversification can yield similar patterns at the tips of a phylogeny and can be hard to disentangle (Maddison Reference Maddison2006). Rigorously studying diversification in comatulids is probably not currently feasible (see “Process”), and as such our inferences about range evolution need corroboration. Our paleontological findings provide this.
Unlike some recent studies that estimate biogeographic history on combined phylogenies of living and fossil species (e.g., Dornburg et al. Reference Dornburg, Moore, Beaulieu, Eytan and Near2015), we sought consilience by treating the neontological and fossil data independently. This avoids two potential problems: first, because all Mesozoic fossil comatulids are from what is now the AM region, we suspected they would swamp out any biogeographic signal from the data at the tips by being very close to the root of the tree. We found that adding a single AM fossil near the root changes the estimated ancestral range, even when all the tips are set to the IP, confirming this suspicion (Supplementary Appendix). If it is known at the outset that data from extant organisms do not affect the results of an analysis, the analysis may not be worth doing. Second, a combined analysis does not account for the potentially severe effects of geographic bias in preservation potential and paleontological effort, which should cause AM comatulids to be overrepresented in the fossil record (Fig. 3). By adding more and more AM Mesozoic fossils to a combined phylogeny, we could make the inference of an AM origin as confident as we wished, but we would be ignoring the chief source of uncertainty regarding the paleontological evidence for the origins of the clade.
Paleontological Evidence
We find the comatulid fossil record yields evidence on both the pattern of shifting diversity and the processes by which this shift occurred. The occurrence record (Fig. 1C) speaks clearly on pattern: fossil occurrences show a coherent gradual expansion from a West Tethyan origin to an eventual worldwide distribution. Taphonomic control analyses indicate that their early absence from the East Tethys is not well explained by random sampling alone and may even indicate genuine absence (Fig. 3). A model in which any echinoderm-bearing locality has an equal chance of yielding comatulids does a poor job of explaining the distribution of comatulid occurrences, and from the Middle Jurassic to the Eocene, this model is outperformed by one in which West Tethyan localities are more likely to yield comatulids (Fig. 3A). Thus, the absence of comatulids from the East Tethys for the first 150 Myr of their history cannot be adequately explained solely as the result of that region being paleontologically invisible. Equal-chances cannot be rejected in the Early Jurassic, probably because there are only a few comatulid-bearing localities in this interval. Fossil genera tend to have relatively few occurrences in the earliest parts of their stratigraphic record (Foote Reference Foote2007); a similar tendency probably explains why comatulids have so few occurrences in their earliest intervals.
The geographic extent of comatulid localities increases monotonically throughout the Mesozoic and from the Eocene onward is greater than in any previous interval despite lower sampling (Fig. 3B). Moreover, comatulid geographic extent is well below that of subsampled taphonomic controls from the Early Jurassic to the Paleocene, but not after that (Fig. 3B). Thus, the geographic expansion of comatulid fossils probably reflects the real biogeographic phenomenon of a West Tethyan origin and subsequent expansion, rather than just changes in paleontological effort or preservation potential.
Though sometimes treated as a logical fallacy, the claim that absence of evidence constitutes evidence of absence can be analytically tractable and philosophically sound (Sober Reference Sober2009). In this study, it rests on the probability that, if there were IP comatulids in the Mesozoic, we would have found them by now. The fossil record outside of Europe and North America is regarded as being too imperfectly known for many applications (Vilhena and Smith Reference Vilhena and Smith2013); if this were true in our case, the lack of IP Mesozoic comatulids would not necessarily mean anything, being just as well explained by true absence as by poor preservation or paleontological effort. Instead we find that, while the East Tethys is underrepresented (Fig. 3A), it is sufficiently well known to reject the hypothesis that comatulids were widespread in the Mesozoic. This kind of “evidence of absence” logic has been a mainstay of paleontology since Cuvier (Simpson Reference Simpson1985), and underlies any inference of extinction, origination, or geographic range.
While the fossil occurrences are consistent with a shifting diversity hotspot (Renema et al. Reference Renema, Bellwood, Braga, Bromfield, Hall, Johnson, Lunt, Meyer, McMonagle, Morley, O'Dea, Todd, Wesselingh, Wilson and Pandolfi2008), without phylogenetic information they are silent on the processes underlying this shift: the record is just as consistent with an origin and diversification of crown comatulids in the West Tethys and their subsequent dispersal to the Indo-West Pacific as it is with a scenario in which Mesozoic comatulids were all in the stem group and the crown only originated and diversified later in their current hotspot. The morphological phylogenetic results discriminate well among these possible scenarios, as they indicate the Mesozoic West Tethyan comatulids included quite nested crown members, apparently before comatulids even reached the Indo-West Pacific (Fig. 4). For example, the placement of the Late Jurassic Solanocrinites depressus alone implies that eight basal divergences in the phylogeny had occurred before the Cretaceous. Likewise, all other fossil comatulids yield more parsimonious placements within the crown than outside it, and all placements are consistent with ancestral-range reconstruction (Fig. 2). While some placements are considerably uncertain, they combine with the taphonomic control analyses to distinguish conclusively between alternate process-based explanations for the hotspot, pointing toward the dispersal of many comatulid lineages to the Indo-West Pacific in the Cenozoic. Thus, although the neontological and paleontological data and inferences have different forms, they indicate the same thing: the formation of the modern hotspot by the dispersal of many comatulid lineages out of their West Tethyan place of origin.
Process
Paleontological and neontological data indicate an origin of the modern hotspot by dispersal in comatulids, but they do not rule out other mechanisms. In particular, intense extinction outside the hotspot has been invoked to explain diversity patterns in other taxa (Di Martino et al. Reference Di Martino, Jackson, Taylor and Johnson2018) and seems plausible for comatulids too. The West Tethys hosted considerable comatulid diversity as late as the Miocene (Vadász Reference Vadász1915; Eléaume et al. Reference Eléaume, Roux and Philippe2020), but the Messinian salinity crisis that devastated other Mediterranean groups (Harzhauser et al. Reference Harzhauser, Kroh, Mandic, Piller, Göhlich, Reuter and Berning2007) probably wreaked comparable havoc on the comatulid fauna, leaving the modern Mediterranean fauna with just six species with occurrences or congeners in the Atlantic (OBIS 2021).
It is not clear whether the IP was a region of intense speciation among comatulids. Given the low sampling in the molecular phylogeny and the rampant polyphyly in comatulid taxonomy (Rouse et al. Reference Rouse, Jermiin, Wilson, Eeckhaut, Lanterbecq, Oji, Young, Browning, Cisternas, Helgen, Stuckey and Messing2013), a robust diversification analysis is not currently feasible. But the available molecular phylogeny suggests no striking imbalances or recent bursts of divergences (Fig 2A), and origination has not been found to be elevated in the IP in other groups (see “Conclusions”), leaving this explanation for the hotspot without much support. We suggest the phylogenetic and paleontological evidence for comatulid biogeographic history can be explained without invoking differences in in situ diversification rate. Nevertheless, we only considered biogeography at a coarse global scale, and a different sort of explanation might be necessary when considering distributions within provinces—for example, the apparent differences in shallow comatulid richness and abundance between islands and continental coasts in the Caribbean (Meyer Reference Meyer1973).
Given that there were no “hard” barriers to dispersal (Cowman and Bellwood Reference Cowman and Bellwood2013b) between the West and East Tethys for most of the last 200 Myr, the estimated rates of dispersal are surprisingly low: ancestral-range reconstruction estimates a rate of about 1 dispersal per 100 lineage-Myr into the IP. Paleontological data also suggest a long lag time: it took until the Cenozoic for comatulids to become sufficiently established in the IP to enter the known fossil record there. How can this be reconciled with the fact that some comatulids today maintain population connectivity across the better part of the world ocean (Torrence et al. Reference Torrence, Correia and Hoffman2012)? Biogeographers distinguish between potential dispersal, in which larvae arrive at a distant location, and realized dispersal, in which larvae survive to adulthood and fecundity (Burgess et al. Reference Burgess, Treml and Marshall2012; Álvarez-Noriega et al. Reference Álvarez-Noriega, Burgess, Byers, Pringle, Wares and Marshall2020). It may be well to recognize another level of realized dispersal at the clade scale, in which ancient dispersers become sufficiently well established in a new region to diversify and leave descendants in the modern oceans. Our data indicate this kind of dispersal has happened only rarely in the comatulids.
If the Mesozoic East Tethys could support little to no comatulid diversity, a modern analogue might be the shallow tropical eastern Atlantic or eastern Pacific. These regions have narrow shelves, few reefs, and only a few or zero comatulid species, respectively (Meyer et al. Reference Meyer, Messing and Macurda1978). Yet they border on regions of great comatulid diversity, and if they became suitable for colonization, dispersers could perhaps reach these regions in a geologic instant. Cenozoic tectonic activity may have made the Indo-West Pacific suitable for colonization in this way, by pushing up vast new stretches of shelf or by facilitating the development of reefs. This last conjecture is supported by compilations of fossil reefs that show few reefs in the Jurassic East Tethys and many in the Miocene Indo-West Pacific (Kiessling et al. Reference Kiessling, Flügel and Golonka1999).
Although IP richness hotspots are found in most major groups of shallow-marine benthic organisms (Worm and Tittensor Reference Worm and Tittensor2018), investigations of process have mostly been confined to a few major clades (teleosts, corals, gastropods, and foraminifera), and this study represents one of only a few attempts to address the origin of the hotspot outside this canon. Comatulids are not remarkable in their sampling for molecular phylogenetics, the quality of their fossil record (Purens Reference Purens2016), or their tractability for morphological phylogenetics, so a much-needed boost in generality could be gained by considering other groups such as decapods, echinoids, and bivalves in the analytical framework used here.
Conclusions
Ancestral-range estimation on a phylogeny of extant comatulids supports an origin in the AM and an elevated dispersal rate into the IP. Likewise, fossil occurrence data support the contention that comatulids did not arrive in the East Tethys before the end of the Cretaceous, and phylogenetic inference indicates that most of the major comatulid lineages had originated by that point. Thus, neontological and paleontological evidence independently point toward an origin for comatulid crinoids in the ancient West Tethyan center of global marine richness and the parallel dispersal of many lineages to their modern Indo-West Pacific hotspot in the Cenozoic.
A consistent picture of the formation of the modern marine richness hotspot has emerged over the past several decades, establishing two non–mutually exclusive explanations for the hotspot's movement. First, lineages outside the modern hotspot and especially in the West Tethys appear to have dispersed en masse into the Indo-West Pacific during the Cenozoic, as evinced for corals (Pandolfi Reference Pandolfi1992; Huang et al. Reference Huang, Goldberg, Chou and Roy2018), some gastropods (Harzhauser et al. Reference Harzhauser, Kroh, Mandic, Piller, Göhlich, Reuter and Berning2007), large benthic foraminifera (Renema Reference Renema and Renema2007), and comatulid crinoids here. Movement of the hotspot by dispersal also accounts for the long-standing paleontological observation of the faunal similarity between West Tethyan fossil assemblages and those in the modern Indo-West Pacific (Baluk and Radwanski Reference Baluk and Radwanski1977; Harzhauser et al. Reference Harzhauser, Kroh, Mandic, Piller, Göhlich, Reuter and Berning2007; Renema Reference Renema and Renema2007; Yasuhara et al. Reference Yasuhara, Hong, Tian, Chong, Chu, Okahashi, Reuter, Piller and Harzhauser2020; but see Friedman and Carnevale Reference Friedman and Carnevale2018). Increased larval import promoted by changes in ocean circulation has been invoked to explain elevated dispersal into the hotspot (Huang et al. Reference Huang, Goldberg, Chou and Roy2018), but we see no problem with the arguably more parsimonious idea that the shallow habitat created by Cenozoic tectonic activity (Hall Reference Hall, Hall and Holloway1998) would have made founder populations more likely to persist and become established in the new hotspot. This latter scenario is supported by spatial diversity simulations that recover richness trends closely matching the Mesozoic–Cenozoic marine fossil record when constrained only by shallow tropical habitat area (Leprieur et al. Reference Leprieur, Descombes, Gaboriau, Cowman, Parravicini, Kulbicki, Melian, De Santana, Heine, Mouillot, Bellwood and Pellissier2016). Second, this hotspot seems to have been a haven from extinction: paleontological evidence indicates lower extinction rates there than in the Caribbean (O'Dea et al. Reference O'Dea, Jackson, Fortunato, Smith, D'Croz, Johnson and Todd2007; Di Martino et al. Reference Di Martino, Jackson, Taylor and Johnson2018), we know of no regional extinctions in the IP comparable to the Miocene salinity crisis that devastated the West Tethyan fauna (Harzhauser et al. Reference Harzhauser, Kroh, Mandic, Piller, Göhlich, Reuter and Berning2007), and populations in the center of the hotspot appear to have been more likely to survive Plio-Pleistocene environmental disturbances than those in adjacent regions (Evans et al. Reference Evans, McKenna, Simpson, Tournois and Genner2016). The hotspot has been suggested to be a center of origination—for example, via a glacioeustatic “engine of speciation” driven by repeated submergence and exposure of land currently below sea level (Benzie Reference Benzie1999; Yasuhara et al. Reference Yasuhara, Iwatani, Hunt, Okahashi, Kase, Hayashi, Irizuki, Aguilar, Fernando and Renema2016), or through the promotion of population fragmentation by the separation of islands by stretches of deep sea (Bellwood et al. Reference Bellwood, Renema, Rosen, Gower, Johnson, Richardson, Rosen, Rüber and Williams2012). But the generally broad species ranges and lack of endemism in the hotspot argue against population fragmentation and allopatry as the sources of the high species richness there (Bellwood et al. Reference Bellwood, Renema, Rosen, Gower, Johnson, Richardson, Rosen, Rüber and Williams2012; Cowman Reference Cowman2014; Cowman et al. Reference Cowman, Parravicini, Kulbicki and Floeter2017; Huang et al. Reference Huang, Goldberg, Chou and Roy2018; but see Reaka et al. Reference Reaka, Rodgers and Kudla2008). Prominent Indo-West Pacific clades have diversified in the Neogene, but not especially in the hotspot: cone snails diverged rapidly in the Oligo-Miocene both in and outside the central Indo-West Pacific (Williams and Duda Reference Williams and Duda2008); Neogene origination rates in reef fishes were higher in the hotspot than elsewhere in absolute numbers, but not on a per-lineage basis (Cowman and Bellwood Reference Cowman and Bellwood2013a); and no attempt has been made to separate the contribution of invasions and in situ originations to a Pliocene diversity jump in Indo-West Pacific ostracods (Yasuhara et al. Reference Yasuhara, Iwatani, Hunt, Okahashi, Kase, Hayashi, Irizuki, Aguilar, Fernando and Renema2016; Shin et al. Reference Shin, Yasuhara, Iwatani, Kase, Fernando, Hayashi, Kurihara and Pandita2019). More generally, the region appears to host old species (Renema et al. Reference Renema, Bellwood, Braga, Bromfield, Hall, Johnson, Lunt, Meyer, McMonagle, Morley, O'Dea, Todd, Wesselingh, Wilson and Pandolfi2008; Rocha and Bowen Reference Rocha and Bowen2008) and low to average rates of speciation (Cowman and Bellwood Reference Cowman and Bellwood2013a; Huang et al. Reference Huang, Goldberg, Chou and Roy2018; Rabosky et al. Reference Rabosky, Chang, Title, Cowman, Sallan, Friedman, Kaschner, Garilao, Near, Coll and Alfaro2018). Available evidence therefore indicates the modern marine biodiversity hotspot arose not because it was an environmentally propitious place for lineage divergence (Keith et al. Reference Keith, Baird, Hughes, Madin and Connolly2013), but because it was well-situated to inherit the biological riches of a “donor hotspot”—the ancient West Tethys.
Acknowledgments
Thanks to C. Badgley, A. Capobianco, D. Ó Foighil, M. Friedman, K. Matsunaga, S. Smith, R. To, the University of Michigan Museum of Paleontology community, and two anonymous reviewers for constructive comments on the research and the paper, and to R. To for helping collect morphological data for phylogenetic analysis. This study was funded by a Graduate Student Research Award from the Society of Systematic Biologists and by a Predoctoral Fellowship from Rackham Graduate School. The authors declare no competing interests.
Data Availability Statement
We provide more detailed explanation of methods and the results of additional analyses in the Supplementary Appendix. All data and scripts necessary to replicate the analyses shown here are available as supplementary files at the Dryad and Zenodo digital repositories: https://doi.org/10.5061/dryad.3tx95x6jj.


 Open access