

DISCUSSION POINTS
-
• Is there a credible path to limit warming to no more than 2 °C?
-
• What role can material recycling play in mitigating CO2 emissions?
-
• How can we communicate the threat of potentially catastrophic climate change impacts to society more effectively?
Global warming has accelerated in recent years; we are approaching 1.5 °C warming from the pre-industrial era
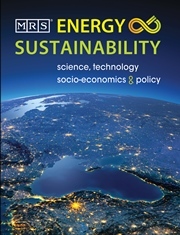
The planet continues to warm. Over the last three years, global warming has accelerated. 2016 was the third consecutive year of record warming increases. Figure 1, 1 summarizes the temperature history relative to the 1881–1910 period. As can be seen, global temperatures increased by about 0.3 °C over the last three years to a projected overall warming of ∼1.3 °C, from pre-industrial levels. It should be noted that this extraordinary recent acceleration in warming was likely influenced by a strong El Nino meteorological event, which has the characteristic of moving heat from the ocean to the atmosphere. Since this periodic event has faded, it appears unlikely that we will see such dramatic warming increases in the next several years. Nevertheless, these recent data debunk climate skeptics who have argued that in recent years there has been a major “slow down” in global warming, which, they argued, means near term action is not necessary.

Figure 1. Annual Global Surface Air Temperatures from 1880 to 2016. Source: Copernicus Climate Change Service, ECMWF, for data from 1979: Met Office Hadley Center, NASA & NOAA for blended data prior to 1979. Reprinted with permission.
It is important to note that the recent United Nations Framework Convention on Climate Change (UNFCCC), 2 has set a goal for maximum global warming by “Holding the increase in the global average temperature to well below 2 °C above pre-industrial levels and to pursue efforts to limit the temperature increase to 1.5 °C above pre-industrial levels, recognizing that this would significantly reduce the risks and impacts of climate change.”
Given the UNFCCC goal, Fig. 2 projects warming from the pre-industrial era, and compares it to actual warming including the recent 2016 warming. The model used was the on-line MAGICC live Reference Meinshausen, Raper and Wigley3 (default assumptions) and assumed the IPCC fossil fuel intensive emission scenario (A1FI). As can be seen, actual warming matches the model projected warming quite well. Such a close correlation suggests that if we continue on a business as usual fossil energy intensive path, we could see warming of 1.5 °C by 2030 and 2.0 °C by 2046. This does not allow much time for humanity to make fundamental changes in how we generate and use energy, which will be needed if we are to avoid the potentially catastrophic consequences of climate change.

Figure 2. Actual versus projected warming, 1800–2100 °C.
It is important to recognize the uncertainties inherent in such projections. Figure 3, again generated using the MAGICC live model, Reference Meinshausen, Raper and Wigley3 depicts projected warming from 2000 to 2100 including ranges of uncertainty generated via a multi-model ensemble of warming projections. Such projections suggests that at the upper band of the uncertainty range, 1.5 °C warming could occur as soon as 2028 and 2 °C warming as soon as 2040.

Figure 3. Actual versus projected warming including uncertainty range.
Greenhouse gas (GHG) emissions are the primary driver for the observed warming
Although it is clear that the planet is warming, what are the drivers responsible for such warming? The IPCC 4 has conducted analysis concluding that emissions of GHGs are the primary driver for such warming. Figure 4 summarizes the results of this analysis. The bottom graphic compares model projections accounting for the only two factors that can influence planetary warming in decadal time frames, other than GHGs: solar radiation variations and volcanic eruptions. Major eruptions throw reflective particles in the upper atmosphere which have a near term cooling impact and a longer term warming impact as the particulates deposit and the reflective cooling diminishes. As can be seen, eruptions and solar radiation changes do not correlate well with the observed warming. However, when GHG emissions are included, there is an excellent correlation. Figure 2, discussed earlier, reinforces this conclusion, since model projections incorporating GHG emissions alone, also correlate well with actual warming.

Figure 4. (a) GHGs emissions when included in model yield good correlation with actual temperatures. (b) Solar radiation variation and volcanic eruptions when modeled, do not predict actual temperatures. Note: black: actual warming, blue: natural forcings only, red: GHG + natural forcings. Figure 9.5 from Climate Change 2007: The Physical Science Basis. Working Group I Contribution to the Fourth Assessment Report of the Intergovernmental Panel on Climate Change [Solomon, S., D. Qin, M. Manning, Z. Chen, M. Marquis, K.B. Averyt, M. Tignor and H.L. Miller (eds.)]. Cambridge University Press, Cambridge, United Kingdom and New York, NY, USA. Reprinted with permission.
It is clear, that the planet is warming and that anthropogenic emissions of GHGs are the driver.
Climate impacts are here and now; much more to come
EPA has recently published “Climate Change Indicators in the United States.” 5 This report documents the many significant impacts that climate change has already had in the U.S. They include deleterious impacts on weather, oceans, snow and ice patterns, human and ecosystem health. Figure 5 6 illustrates the most significant of these impacts.

Figure 5. Depiction of current climate change impacts.
Table 1 (derived from Stern Reference Stern7 ) projects potential climate impacts as a function of 2100 temperature rise from pre-industrial levels for water, food, health, land and ecosystems categories. As can be seen, as warming exceeds 2.5 °C, serious impacts are projected in the agricultural sector, with large areas of cropland becoming unsuitable for cultivation. Also likely are large losses in biodiversity, forests, and wetlands. Desertification would be widespread, with large numbers of people experiencing increased water stress. Human and natural systems would be subject to increasing levels of agricultural pests and diseases with increases in the frequency and intensity of extreme weather events exacerbated by substantial seawater rise. Millions of people would be at risk for premature death due to malnutrition and exposure to tropical diseases. Note, not depicted in the table are risks associated with potential large scale and abrupt impacts such as Greenland ice melting and changes to atmospheric circulation. These could lead to catastrophic sea level rise and collapse of Atlantic Thermohaline Circulation (often referred to as “Ocean Conveyer Belt”). Such impacts could dramatically increase coastal flooding and yield unprecedented cooling in Western Europe and Western North America and heating in Eastern North and South America, drastically changing the climate in those regions.
Table 1. Potential climate impacts as a function of 2100 warming.

Note that the first column in the table indicates the level of GHG mitigation (if any) associated with the temperature rise range. As can be seen, serious emission reductions beyond that agreed to in the Paris COP agreement will be needed (see Fig. 9) if impacts are to be seriously moderated.
Humanity’s growing population and increasing demand for resource intensive goods and services have driven the dramatic growth in GHG emissions over the last 50 years
Figure 6 8 illustrates the rapid growth of CO2 emissions from fossil fuels and cement production from 1990 to 2014 and identifies the key countries responsible. The industrialization of China and other developing countries such as India have been responsible for much of the recent emission growth.

Figure 6. Emissions of CO2 from energy & cement, 1990–2014. Reprinted with permission from PBL Netherlands Environmental Assessment Agency.
Figure 7 Reference Princiotta and Loughlin9 illustrates the key driving forces responsible for this dramatic growth in greenhouse gas emissions in recent decades.

Figure 7. Macro view of the drivers yielding GHG emissions and the two key mitigation approaches.
GHG emissions are a product of meeting human “needs” via energy intensive technologies and practices. Over time, developed nations have expanded their list of “needs” to include personal transportation, residences with energy-intensive heating, cooling, and lighting, a diet heavily oriented toward meat production, and a growing array of consumer goods. Developing countries such as China and India, with large populations, are moving in the same direction. For the period 2000 to 2010 CO2 global emissions have grown at ∼3% annually based on a GDP per capita growth rate of 2.5%, a population growth rate of 1.1%, compensated to a modest extent by a negative 0.6 annual growth rate of energy use per GDP.
The middle of the figure indicates that these human needs are met by means of a large array of industrial, agricultural, and energy technologies and practices. Although there are a multitude of inputs and outputs associated with these “technologies and practices”, the major threats to long-term sustainability for an advanced level of civilization are shown in the figure. These threats include depletion of fossil fuels without adequate quantities of alternative forms of energy, depletion of mineral and fresh water supplies, and the various impacts associated with the emissions of CO2 and other greenhouse gases. On the right-hand side of the figure is a listing of key global impacts associated with current technology and practices. As indicated by the red return arrows, climate change has the potential to exacerbate global impacts associated with non-energy-related technologies and practices. Ocean and forest degradation are examples of such amplification. The bottom of the figure indicates that there are two classes of mitigation opportunities. The most commonly considered approach is replacing/upgrading current technologies and practices. Another, less discussed, but potentially important if we are serious about dramatically decreasing GHG emissions, would be to modify social and cultural behavior toward a less energy and resource-intensive lifestyle.
Global efforts have had a minimal impact on mitigating the problem to date
Climate change has been the subject of international discourse for many years. The first paper to attempt to quantify projected anthropogenic global warming, dates back to 1975. Reference Broecker10 Figure 8 illustrates that despite all the meetings, the formation of the IPCC and its assessment reports, and the Kyoto Protocol, there has been no significant CO2 emission or atmospheric concentration slowdown.

Figure 8. CO2 emissions & atmospheric concentrations continue to grow despite international discourse.
The recent COP Paris agreement: how significant is it toward constraining warming to 1.5 °C and 2 °C?
The 2015 United Nations Climate Change Conference, COP 21, was held in Paris, France, from 30 November to 12 December 2015. The goal was to reach agreement on reducing emissions of GHGs to limit global warming to tolerable levels. The following was accomplished (derived from United Nations Treaty Collection 2 ):
-
(i) 196 countries, including the U.S., China, EU, Japan, and Russia agreed to work collaboratively toward the reduction of GHGs to protect the planet from the impacts of climate change.
-
(ii) As mentioned earlier, countries agreed they will aim to keep warming below 2 °C and for the first time agreed to pursue efforts to limit maximum temperature increase to 1.5 °C.
-
(iii) The agreement utilized a “bottoms up” approach whereby countries set their own goals. Each country that ratifies the agreement sets a target for emission reduction, called a “nationally determined contribution,” or “NDC.” The amount will be voluntary. There is neither a mechanism to force a country to set a target by a specific date nor enforcement measures if a set target is not met. However, countries are required to report on progress toward achieving their NDCs.
-
(iv) On 22 April 2016 (Earth Day), 174 countries signed the agreement in New York.
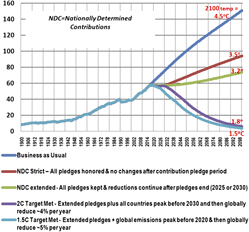
The Paris COP agreement is clearly the most significant international climate agreement ever negotiated; but what is its potential impact? With the aim of quantifying this impact, Fig. 9 was generated based on analysis conducted by Climate-Interactive and their spreadsheet data. 11

Figure 9. Global emissions (Billion tons CO2(e) per year) for Business as Usual, and four mitigation scenarios, 2100 warming projections included.
The figure illustrates, via the NDC Strict scenario, that if all current NDC commitments are met, emission growth will slow relative to a Business As Usual (BAU) case. However, 2100 warming is projected to be in the order of 3.5 °C. As indicated in Table 1, such warming will yield unacceptable climate impacts. The NDC Extended scenario assumes continuation of such emission reductions beyond 2025, yet still yields 2100 warming of 3.2 °C. The final two scenarios aim to limit warming to 2 and 1.5 °C, per the stated goal of the agreement. As can be seen, limiting warming to these levels will be a monumental challenge requiring a near term peak in reductions followed by major annual emission reductions for decades. Such a fundamental change from substantial emission growth averaging ∼2% annually over the last 20 years, would need to be turned around so that emissions peak in the next 5–15 years followed by 4–5% annual reductions for decades. This appears unattainable; and certainly impossible without a fundamental near term radical re-structuring of how the world generates and uses energy.
It is instructive to examine the U.S. NDC and its relationship to an emission trajectory consistent with limiting warming to ∼2 °C. Figure 10 illustrates the U.S. NDC which is committed to reducing emissions nationally by 26–28% by 2025 relative to 2005. Also shown are the emission/per capita emission targets consistent with the IPCC 12 analysis that global 2050 CO2 per capita emissions need to be no higher than ∼1.3 t/person to limit warming to 2 °C. It is difficult to construct a credible scenario that would allow the U.S. to decrease its per capita CO2 emissions from 13 to 1.3 in just 25 years.

Figure 10. U.S. Commitment to mitigate CO2 by 2025 versus what reductions will be required by 2050 to be compatible with global emission requirements to limit warming to 2 °C.
What are the technology implications of drastically reducing emissions in the near term?
To grasp the complexity of the climate mitigation challenge, it is instructive to understand the relationships between the sectors, end uses (“needs”) and the four main GHGs of concern. Figure 11 Reference Herzog13 depicts and quantifies these relationships for the world as of 2005. One of the greatest mitigation challenges is that the emission of GHGs results—directly or indirectly—from almost every major industry and activity. This chart shows key industries and activities, and the type and volume of greenhouse gases that result from them. Such critical activities include road travel, residential and commercial building cooling, heating and lighting and the production of chemicals, cement, and iron & steel needed for production of goods. The net result of these operations are huge emissions of CO2, most of which are associated with the combustion of coal, oil and natural gas. Also in the energy sector, oil, gas and refining activities generate large quantities of methane, the second most important GHG. Non-energy activities, such as industrial processes, e.g., cement production, and land use changes, i.e., deforestation, also increase concentrations of CO2 in the atmosphere. Agricultural practices are particularly important in terms of the methane and N2O emissions they generate. Note that globally in 2005, 77% of the anthropogenic warming that year is associated with CO2, with methane and N2O contributing 15 and 7% respectively. Note that the term CO2 equivalent [CO2(e)] emissions, is the amount of CO2 which would have the equivalent global warming impact, when accounting for the other GHG gases. For 2005 that number globally is 44 Gt(e).

Figure 11. World Emissions Greenhouse Gas Emissions in 2005 by sector, end use and gas [total = 44, GtCO2 (e)].
It should be noted that every country has a unique sector/CO2(e) flow sheet. For example for the U.S. 14 in 2005 the energy sector contributes 87% of its CO2(e) emissions, with industrial processing and agriculture contributing 4.5 and 6.2%, respectively. Also for the U.S., CO2 contributes 85% of its CO2(e) emissions, with methane and N2O contributing 8 and 5% respectively.
Given the need for early and dramatic emission reduction in the energy sector above and beyond the current modest NDC commitments, Fig. 11 suggests that given their major contributions to CO2 emissions, transportation, electricity generation and industrial production are sectors requiring fundamental changes in the near term if dramatic emission reductions are to be achieved. On the end use side, transportation vehicles and buildings are very high energy users which must dramatically improve their energy efficiency.
Figure 12 illustrates the quantities of CO2 avoidance by technology for the International Energy Agency’s (IEA) Reference Princiotta and Loughlin9 50% CO2 by 2050 reduction scenario, referred to as the Blue Scenario. Such reductions when accompanied by aggressive methane and N2O emission reductions, can limit warming to close to 2 °C. The sum of all the bars yields 43 Gt avoided in 2050, versus baseline projections. The results suggest that a diverse array of low carbon technologies and practices in all energy sectors will be needed if these reduction goals are to be met. Of particular importance are end-use technologies in the building, transport, and power-generation sectors, as well as carbon storage technologies in the power-generation and industrial sectors.

Figure 12. Technologies needed to meet Blue Map scenarios avoidance goal of 43 Gt CO2 mitigated by 2050.
A key question is how available are these technologies and how fast can they be utilized. Again for the Blue Scenario, Fig. 13 Reference Princiotta and Loughlin9 depicts these technologies and puts them in two categories: existing technology or new/advanced technology. As can be seen, over half of the required reductions are associated with technologies that are not currently commercially available.

Figure 13. Technologies needed to meet a 50% reduction by 2050 mitigation scenario; new/advanced versus existing.
Table 2 has been generated to summarize the many remaining issues that need resolution via an expanded RD&D program if these technologies are to play a major role in reducing CO2 emissions in a time frame consistent with the need to limit warming to 2 °C or below.
Table 2. Low C technology RD&D priorities for key sectors.

One technology warrants particular attention. Carbon capture and storage (CCS) is a critically important technology that was expected to be widely applied to existing and new coal-fired generators and major industrial sources. In the U.S., it has the potential to be applied to modern natural gas fired generators as well. There are several variations of this technology, but they all are designed to capture CO2 from flue or industrial gases, compress and transport the CO2 for permanent storage, typically in underground saline aquifers or enhanced oil recovery (EOR) operations. Such technology is particularly important for relatively new, efficient coal-fired power plants in China and India. Without retrofitting with CCS, such facilities will be super emitters of CO2 over their 40–50 years life, since economic considerations suggest it is unlikely they will be shut down early given their projected lifetime.
Starting about 10 years ago, a large number of CCS pilot and demonstration units were initiated. However, according to the MIT Carbon Capture and Sequestration Technologies database, 15 43 of these projects have been terminated or are in an inactive status. Of the terminated/inactive projects, 15 were in the U.S., and 21 in Europe. They ranged in size from small 50 MW(e) slipstream units to 1600 MW(e) full scale facilities. Reasons for the terminations include: lack of regulatory or financial incentives, funding constraints, overruns, unexpected technical difficulties, and public resistance to CO2 transport and storage operations.
Fifteen projects are still active; two under construction and one, the Boundary Dam Plant of SaskPower has been in full operation since March 2016. The cost for this unit has escalated to $1.5 billion, which for a 160 MW unit, may be prohibitively expensive. The capture technology utilized for this project is post combustion amine scrubbing. Although this is closest to the state of the art of the available capture technologies, it is inherently inefficient with parasitic losses in the 25–30% range. An example of a promising second generation CCS technology is the Net Power oxy-combustion supercritical process. 16 Such technology has the potential to eliminate the massive parasitic heat losses associated with current generation technologies. Net Power has a 25 MW(e) demonstration plant under construction in LaPorte Texas.
The future of the current generation of CCS technology is uncertain, in light of cost, energy efficiency penalties, and concern with the safety and efficacy of underground storage. There is also a lack of incentives, such as a price for carbon, to encourage utilization of such a high risk technology.
Given the importance of next generation low carbon technologies and practices, is the global community funding research, development and demonstration at an appropriate level? Fig. 14 17 summarizes IEA analysis of actual versus needed global energy technology RD&D funding for key technologies required achieving their Blue Map 50% reduction scenario. IEA concludes that actual funding is a small fraction of what they believe is required. The total annual required funding is estimated at $40–$90 billion, whereas actual spending for these key technologies is estimated to be only $10 billion per year. The author strongly agrees that low carbon mitigation technology development is woefully underfunded.

Figure 14. Current global annual RD&D funding for key technologies versus needed funding (high and low ranges), billions of dollars.
In the U.S., by far the largest component of its annual RD&D expenditures is for the military. It has been in the $60 billion range in recent years, about half of all such expenditures. Figure 15 18 shows funding trends in the non-military categories. As can be seen, energy related research is in order of $3 billion in recent years; far short of what is needed if the U.S. wants to play a leadership role in developing the next generation low carbon technologies capable of protecting the planet for future generations.

Figure 15. Trends in U.S. nondefense R&D by function, billions constant FY 2016 dollars. From AAAS: Historical Trends in Federal R&D (2016). Reprinted with permission from AAAS.
So where do we stand; is it too late to recover, i.e., limit warming to below 2 °C?
Humanity has dug itself a very deep hole. Driven by global industrialization and population growth vectors, humankind has emitted over 1.5 trillion tons of CO2 in the atmosphere substantially changing the heat transfer characteristics of the atmosphere. Methane and nitrogen oxide emissions have been emitted in large quantities as well. On our current emission trajectory, we are approaching global warming of 1.5 °C and are only ∼30 years away from the 2 °C warming level, which is considered a marginally acceptable maximum level by the scientific community. 4 °C warming looms as a real possibility, later this century. As Table 1 indicates, warming in the 3–4 °C range will lead to disastrous food, water availability and health impacts and widespread species extinctions.
The recent UN COP agreement, if successfully implanted, would only modestly lower the growth rate of GHG emissions; and is only a small step in the right direction. Even assuming all countries meet their NPDs, 2100 warming is projected at a potentially catastrophic 3.5 °C.
It is noteworthy that Donald Trump, recently elected as President of the U.S., has said 19 he would “cancel the agreement” because “it is bad for business.” Given the reality of economic competition between nations, if the U.S., with the world’s largest economy and the greatest per capita emissions, refuses to act responsibly, the probability that other countries would be willing to drastically alter their energy infrastructure, would be substantially lowered. This does not bode well for successful implementation of this or any other mitigation agreement. As the previous analysis indicated, time is not on humanity’s side.
To have a chance to limit warming to 2 °C or lower, global emissions must peak within about ten years followed by substantial annual reduction of emissions for decades. In order for this aggressive mitigation scenario to play out, the following conditions would need to be met:
-
(i) The international community must agree to such a dramatic mitigation program, which would require near term low carbon restructuring of the energy global infrastructure with the aggressive phase-out of fossil fuels in the energy mix.
-
(ii) Affordable, practical low-C technologies and practices would need to be commercially available within the next ten years. Of particular importance would be CCS technologies, advanced nuclear generators, low cost renewable generation with energy storage capability, efficient buildings and low emission vehicles. See Table 1 for more details.
-
(iii) Given the importance of methane, N2O and HFC emissions (see Fig. 11), the international community must agree on emission reductions for these pollutants as soon as possible. For methane, leakage from oil, gas and coal operations are particularly important. Agriculture operations are important sources for both methane and N2O.
Barring unexpected breakthroughs in technology and fundamental changes in current political realities, the probability of reducing global emissions in a time frame consistent with limiting warming between 1.5 and 2 °C appears very low. So in answer to the question “can humanity recover from decades of unconstrained emissions of greenhouse gases and keep warming in the 1.5–2 °C range.” The answer is, no; it appears unlikely. However we must move aggressively to limit warming to the lowest value practical. Current projections suggest we are heading toward 4 °C warming later this century, with potentially catastrophic impacts.
Given that reality, the following appears to be the most rationale steps that can be taken to minimize the damage.
What steps should be taken to minimize the damage?
-
(i) The scientific community must upgrade its efforts in educating the public on the seriousness of this problem and the mitigation actions necessary to ensure the habitability of the planet for the 9 billion people who will call Earth their home later this century. Such education should be targeted at all levels, from national leaders down to individual citizens. Such education is needed, if we are to put the importance of this problem in perspective, relative to those much less critical issues receiving much more attention and funding. Graphics such as this one (Fig. 16), supplemented by the message that the habitability of our planet is at risk, may be helpful.
-
(ii) Adaptation strategies need to be developed at the international and national levels. As indicated earlier, significant climate change impacts are already occurring and it is too late to avoid even more serious impacts in the years ahead. Developing countries are likely the first to be seriously affected, and need to be ready to minimize the damage. The U.N. COP provides a useful fact sheet 20 on the adaptation challenge.
-
(iii) Put a price on carbon at the national and international levels, as soon as possible. Given the serious impacts associated with climate change it clearly reasonable to put a price on the perpetrator of these impacts. This would provide the financial incentive for humanity to rapidly leave fossil fuels behind in favor of low C technologies and practices. An example of a potentially powerful carbon pricing concept is the Carbon Fee and Dividend Program proposed by the Citizen’s Climate Lobby in the U.S. 21 This concept involves a steadily increasing substantial “fee” on fossil fuels at the mine, well or port of entry. Then 100% of the fees, minus administrative costs, would be returned to households on a monthly basis. To discourage businesses from relocating, import fees will be imposed on products imported from countries without a carbon fee, along with rebates to US industries exporting to those countries. A Regional Economic Models Inc. study 22 concluded that in the U.S., carbon fee-and-dividend could reduce CO2 emissions 52% below 1990 levels in 20 years and that recycling of the revenue creates an economic stimulus that adds 2.8 million jobs to the economy with a $70–$85 billion annual increase in the GDP from 2020 on. Also, due to a decrease in fossil fuel combustion, reductions in air pollution levels could prevent 227,000 premature deaths over a 20 year period.
-
(iv) If we are to peak emissions in the near term and reduce them aggressively from that point on, new and upgraded low C technologies will be needed. Given the woefully inadequate funding of such technologies discussed earlier, a major increase in RD&D is needed. As shown in Fig. 14, the world spends about $10 billion annually on energy related research, $3 billion of which is by the U.S. (Fig. 15). As a point of reference, the world spends $1.7 trillion annually on military expenditures. Of this the U.S spends $600 billion, 23 equivalent to the sum of expenditures of the next eight most highly funded countries.

Figure 16. The relative threats to humanity: Global Climate Change versus ISIS.
As another point of reference, it has been estimated that the financial cost of the Iraq war (2003–2010) for the U.S., exclusive of cost to our allies and Iraq, was in the order of $3 trillion. 24 If we were willing to spend such an enormous sum on such an unproductive enterprise, shouldn’t we be willing to make a much more modest investment to develop and demonstrate the technologies needed to protect the planet for future generations?
As indicated in Fig. 14, IEA estimated required annual funding levels in the range of $40 to $90 billion for such a program. Table 2 summarized some of the issues and RD&D needs for the power generation, industrial and mobile source sectors. Given the monumental mitigation challenge, I argue that a major focus of such a program should be on transformational technologies, i.e., those that could yield scientific/engineering breakthroughs that can yield new or dramatic improvements of affordable, effective low C technologies. A relevant program which is focusing on such transformational technologies is the U.S. Department of Energy’s Advanced Research Projects Agency-Energy (ARPA-E). 25 This program would greatly benefit from a major increase in funding, which was only $291 million in FY 2016.
What else should be considered?
Although this paper focuses on low-carbon technologies and practices, the mitigation challenge may go beyond what is feasible by low C technology alone. As illustrated in Fig. 7 via social/cultural mitigation activities, additional actions may need to be taken to move humanity away from its current energy and resource-intensive culture to a more sustainable model. Such societal changes could be encouraged by mandating material recycling programs, mass transit, and land practices that maximize vegetative sequestration of atmospheric CO2. More difficult and controversial transitions involving population growth and dietary choices may also be necessary. Reducing resource demands not only has the potential to reduce GHGs; co-benefits will include improved air and water quality, improved ecosystem services (e.g., forest and ocean health), and reduced mineral resource depletion.
It should be noted that geoengineering concepts are conceptual mitigative approaches that at least in theory, could buy humanity some time to dramatically reduce GHG emissions. Some see them as a delaying tactic or as a possible “last resort” action to limit catastrophic climate change. Geoengineering measures attempt to compensate for GHG emissions via two fundamentally distinct approaches: (i) intentionally changing Earth’s solar radiation balance, or (ii) removing CO2 from the atmosphere. Figure 17 Reference Princiotta and Loughlin9 describes potential geoengineering concepts.

Figure 17. Solar radiation and atmospheric CO2 removal geoengineering concepts.
In recent months there has been much discussion of the CO2 atmosphere removal option, which has been deemed necessary to meet warming targets since it is unlikely emissions will be reduced in time to limit global warming to 2 °C or less. This is sometimes referred to as the negative CO2 emissions option. However, this approach, as well as all the options mentioned in Fig. 16, is only at the conceptual stage with serious performance, impact and economic issues. However, given the magnitude of the mitigation challenge discussed, such approaches warrant serious feasibility evaluations, as soon as possible.
Conclusions
We are losing the climate change mitigation challenge. Since it appears unlikely that we can limit warming to 1.5–2 °C, the task before us is to minimize the warming using the recent Paris COP agreement as a critical first step. The goal should be to put a ceiling on global emissions as soon as possible and then rapidly decrease emissions annually for decades. The following steps are deemed critical in the near term: put a price on carbon, fund a dramatically expanded low C technology RD&D program and conduct serious adaptation efforts. Also, upgraded communication efforts are needed to educate the public, and their leaders, on the seriousness of this problem and the actions necessary to protect the habitability of the planet for the 9 billion people who will call Earth their home later this century.
Finally, this literary perspective on this monumental challenge, describes a bargain we cannot accept:
On the highway to hell, Faust met a devil who said to him:
“Give me all your tomorrows, all your children and all your children’s children, and I will make today for you, a paradise.”
Derived from: https://robertscribbler.com/2014/03/05/a-faustian-bargain-on-the-short-road-to-hell-living-in-a-world-at-480-co2e/.


