


Introduction
Mass spectrometry imaging (MSI) techniques are increasingly being used within many biological fields, including medicine, pathology, and microbial ecology. There are a variety of desorption/ionization methods used in these efforts to generate mass spectra and create ion images of samples of interest [Reference Chughtai and Heeren1–Reference Wu4]. Each of these MSI methods has their own virtues. Here, we focus on the surface-sensitive technique of secondary ion mass spectrometry (SIMS). Of the MSI methods available, SIMS offers the highest lateral resolution. Moreover, SIMS versatility in the number of different operating modes and types of mass spectrometers available has made it an increasingly popular method for bio-related measurements.
Traditionally, SIMS has been most heavily used for inorganic semiconductor research, but with recent technologies it has grown in popularity for analysis of biologically relevant samples. In the SIMS technique, a focused ion beam is used to bombard a sample, ejecting and ionizing molecules from the sample surface that are subsequently analyzed in a mass spectrometer (Figure 1) [Reference Williams5]. Currently, SIMS provides micrometer- to nanometer-scale lateral spatial resolution [Reference Hillion6]. To represent the range of analytical capabilities of SIMS, we focus in this article on three specific types of SIMS instrumentation (Figure 2): Fourier transform ion cyclotron resonance SIMS (FTICR-SIMS), time-of-flight SIMS (ToF-SIMS), and a specialized dynamic SIMS instrument (NanoSIMS), which offers the highest lateral image resolution of any MSI method. These instruments provide information at different dimensional scales that can be matched to the problem of interest.
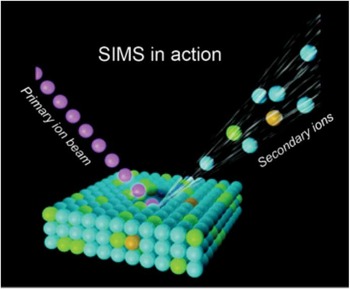
Figure 1 Schematic of SIMS mode of operation, where the primary ion beam is used to eject atoms, molecules, and secondary ions from the surface. Secondary ions are then analyzed in a mass spectrometer based on their mass-to-charge ratio.
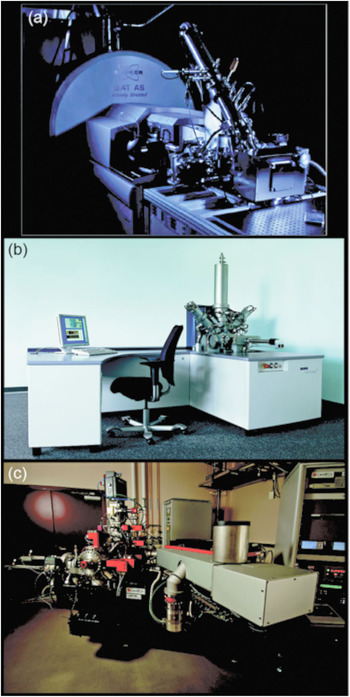
Figure 2 Three modern SIMS instruments. (a) FTICR-SIMS at PNNL, (b) IONTOF TOF.SIMS5 at PNNL and the University of Washington (image courtesy of IONTOF GmbH), and (c) a Cameca NanoSIMS 50L located at PNNL.
Materials and Methods
Primary and secondary ions.
The SIMS technique requires samples to be analyzed in a high-vacuum environment. The basic SIMS technique uses an ion source, where primary ions are accelerated toward a sample surface. As a result of the impact of the primary ions with the surface, molecules and atoms are ejected into the vacuum environment (Figure 1). While most of the ejected molecules are neutral, a percentage of them are ionized and carry either a positive or negative charge (secondary ions).
Dynamic and static SIMS.
Dynamic SIMS instruments operate in a regime where the primary ion beam is constantly bombarding the sample. This typically causes excessive fragmentation of the surface molecules providing exceptional elemental analysis of sample-limited material [Reference Williams5]. Using dynamic mode, one can “erode” the sample during analysis to produce a chemical depth profile of the sample. In contrast, instrumentation employing a pulsed primary ion beam is often used in the “static” mode, where the percentage of the surface that is damaged by the incoming (primary) ion beam is kept to a minimum. To stay within the so-called static mode, the primary ion dose must remain below ~1012 ions/cm2. Static mode provides highly surface-sensitive molecular information (typically ~ the top 2 nm) [Reference Benninghoven7].
Analysis and imaging.
Secondary ions are collected and separated by their mass-to-charge ratio (m/z) in a mass analyzer. In the imaging applications described here, the focused incoming primary ion beam is moved across the sample, either by stage movement or beam rastering, and a mass spectral measurement is produced from each area of impact. Lateral resolution of 100 nm or better can be attained by using a liquid metal ion gun (LMIG) source. The adoption of polyatomic ion sources has been shown to increase the secondary ion yield as well as increase the molecular weight of the secondary ions [Reference Winograd8]. In addition, they are proving to be very useful in obtaining 3D information from biological systems. These capabilities and ongoing improvements are discussed in more detail below and are the principal reasons why SIMS is now a viable tool for solving problems related to biological cells and tissues.
SIMS Instruments and Applications
FTICR-SIMS of brain tissue (the large scale)
Fourier transform-based mass spectrometers (FTMS) measure the mass-to-charge of an ion by its frequency of oscillation within a magnetic or electric field. These mass spectrometers offer the highest available mass resolution and mass accuracy. The C60 FTICR-SIMS platform described here and elsewhere [Reference Smith9–Reference DeBord11] is a reworking of a commercially available MALDI (matrix-assisted laser desorption/ionization) configuration on a Bruker SolariX FTICR MS system (Figure 2a). The C60 primary ion source is a thermal effusive source, where C60 powder is heated under vacuum, and evaporated C60 molecules are ionized and focused through a series of ion optics as they move toward the sample. As a result of using a polyatomic primary ion source like C60, a softer bombardment of the sample surface occurs, increasing the ionization efficiency of intact secondary ion species in comparison to LMIG sources.
For analysis with FTICR-MS, collected secondary ions must be collisionally cooled in order to trap them within the magnetic field. As a result, the FTICR-SIMS does not suffer from topographical effects (signal increasing or decreasing with increased or decreased sample height) like many ToF instruments. However, this trapping process and measurement of the oscillation of trapped molecules (over 100s to 1000s of milliseconds) prolongs the duty cycle of FTMS instruments, which is compounded over the course of an image acquisition. This reason and the high cost of these instruments are limiting factors for their application.
An FTICR-SIMS analysis of a rat brain tissue section is shown in Figure 3 as an example of SIMS analysis of a “larger” biological sample. Many tissue sections are large compared to the typical SIMS analysis areas of ~500 × 500 μm for ToF-SIMS and ~100 × 100 µm for NanoSIMS. For these instruments, stitching together multiple SIMS images to create a mosaic image is required to image an entire tissue section. However, for the FTICR-SIMS, as configured here, the primary ion beam of C60 stays in one location, and the sample stage is mechanically moved between beam pulses, defining the pixel size. With this setup, images can be taken across multiple centimeters, making it well suited for analysis of “larger” tissue areas. Figure 3b illustrates the approximate region of analysis of the rat brain tissue section, based on a serial section that has been H & E stained to elucidate the different anatomical areas. One can see the spectral complexity generated from SIMS analysis of the tissue section, where 2,783 separate peaks are detected over the entire sampling area (Figure 3a). The mass resolving power and mass accuracy of this SIMS instrument are unmatched, where in this case a mass resolution of ~97,000 is measured at m/z=634.601 (the most abundant peak) with <5 ppm error. However, mass resolving power >1,000,000 and mass errors <1 ppm have been reported using this instrument [Reference Smith9]. While there is extreme spectral richness evident in the FTICR-SIMS analysis of rat brain (Figure 3a), many of the peaks detected are not molecular species. Some of the peaks are either fragment ions of a parent species that are created by the impact of the primary ion beam or isotopologues (for example, naturally occurring 13C-speices) of abundant molecules in the sample.
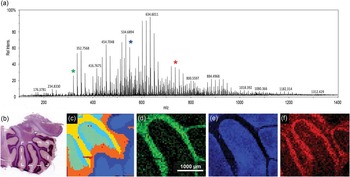
Figure 3 C60 FTICR-SIMS analysis of sagittal sectioned rat brain. (a) Average overall spectrum of the entire rat brain area imaged with a measured mass-resolving power of approximately 97,000 at m/z = 634.601. (b) Light microscopy image of the serial section (H & E stained) of the brain tissue that was analyzed. The white box indicates the approximate area of analysis within the cerebellum. (c) Dendrogram illustrating pixels that have similar spectra, created using SCiLS Lab. From the dendrogram we can see the spectral peaks that co-localize with areas identified in the H & E stained image of (b). (d) N-glycolylneuraminic acid at m/z = 326.109 co-localizes with the white matter of the cerebellum. (e) m/z = 550.663 is a possible lysolipid co-localized in the gray matter area. (f) Either PC (32:2) or PE (35:2)—same nominal mass— at m/z = 730.541 that co-localizes within the granular cell region. A 20 µm beam size was used with 50 µm steps between spectra.
Recent MSI analysis software tools, like SCiLS Lab and the NBToolbox, have been developed to assist in handling the complex data streams that are generated from MSI data. In this example, SCiLS Lab is used in spatial segmentation analysis of the FTICR-SIMS of the rat brain. This analysis identifies pixels in the image that have similar spectra, producing a dendrogram (Figure 3c) mapping the location of pixels with correlated spectra. The areas in the dedrogram correspond well with the anatomical features seen in Figure 3b, indicating that the FTICR-SIMS analysis is detecting different biochemical areas in this sample. The most prominent mass peaks associated with each of these features can be determined. Figure 3d shows the ion image of m/z = 326.109 corresponding to n-glycolylneuraminic acid, which co-localized with the yellow clusters in Figure 3c and with the white matter of the cerebellum. Figure 3e is the ion image of a possible lysolipid at m/z = 550.663 that correlates to the orange regions in Figure 3c and the gray matter of the rat brain. Finally, Figure 3f is the ion image of an intact lipid, PC (32:2) or PE (35:2) at m/z = 730.541 that co-localizes to the light blue areas in Figure 3c and with the granular cell region of the rat brain section. Tandem MS would be required for discrimination between PC and PE lipids with the same monoisotopic mass.
SIMS of insects (the medium scale).
Although different SIMS instruments have varying capabilities in spatial and mass resolution, their capabilities can overlap. In this section insects are examined using both C60 FTICR-SIMS and ToF-SIMS, providing a comparison of instrumentation capabilities.
In the first example, the C60 FTICR-SIMS instrument was used to collect images from a drosophila imaginal wing disc. Figure 4a shows a schematic of this feature, and Figure 4b shows an FTICR-SIMS image of the same area. These discs undergo tremendous changes during metamorphosis to give rise to the adult structure [Reference Hsiung12]. With the FTICR-SIMS we can visualize chemical patterns within the wing disc, which begin to form during this period. Because of the size of these discs, a smaller step size (35 µm) was required than in Figure 3 in order to laterally resolve regions within the wing disc. However, the lateral resolution of the FTICR-SIMS is significantly coarser than that of a ToF-SIMS instrument.
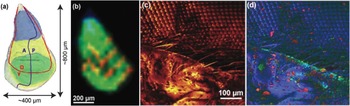
Figure 4 SIMS analysis of insects. (a) Anatomy of the drosophila wing imaginal disc during the 3rd instar larva developmental period, where A is the anterior, P is posterior, D is dorsal, and V is ventral. (b) C60 FTICR-SIMS image of drosophila wing disk (35 µm step size) following m/z = 554.7240 (blue), 570.7001 (green), and 980.4017 (red) (sample courtesy of Florian Marty). The identity of these species are unknown, as the m/z values have not been annotated in an online database. (c) ToF-SIMS image of an adult housefly eye taken with the IONTOF5 instrument at NESACBIO (image from Dan Graham) showing signal composed of all emitted positive ions. (d) ToF-SIMS image showing an overlay of image for 3 positive ion masses: Na+ peak in red, Si2C5H15O+ indicative of PDMS in green, and C4H5N+ peak in blue.
An example of the lateral resolution capabilities of ToF-SIMS is shown in Figure 4c, where an IONTOF TOF.SIMS5 instrument (Figure 2b) was used to image part of a common housefly eye. The LMIG in SIMS systems (such as the bismuth LMIG employed for the IONTOF data shown in Figures 4c and 4d) use electrostatic beam deflection to raster the tightly focused liquid metal ion beam across the surface, achieving submicron lateral resolution. In an image showing the intensity of the total positive ions emitted from the surface (Figure 4c), the fly’s bristles as well as details of the compound eye can easily be identified. As with the FTICR-SIMS, the ToF-SIMS data results in a large number of mass spectral secondary ion peaks. In Figure 4d a three-color overlay is used to represent position and intensity of three of the secondary ions detected in the ToF-SIMS spectra: sodium, polydimethyl siloxane (PDMS), and a C4H5N+ ion fragment. The salt (shown in red) is scattered across the fly eye. While the PDMS (green) is usually a contaminant that spreads across surfaces in vacuum, this effect was not as apparent on the compound eye part of the fly. Note that the organic peak attributed to C4H5N+ (blue in Figure 4d) appears to best represent the compound eye and other main features of the fly.
SIMS of bacteria (small scale).
The Cameca NanoSIMS 50/50L (Figure 2c) is a recently developed dynamic SIMS instrument capable of achieving a lateral resolution of 50 nm. In practice, lateral resolutions of 70 nm to 100 nm for measuring biological features are more common [Reference Frisz13]. This high lateral resolution is made possible by a number of factors, including the type of primary ion source, high-performance primary and secondary ion beam optics, and a special mass analyzer. The NanoSIMS uses the most electropositive and electronegative sources available (Cs+ and O-), which achieve the highest ionization efficiencies in negative and positive ion modes, respectively. The last focusing optic of the primary ion beam has a very short working distance to the sample (less than a millimeter), and the primary beam enters the sample orthogonal to the plane of the sample [Reference Hillion6]. The secondary ions are then analyzed using a magnetic sector mass spectrometer, where up to 5 or 7 (depending on NanoSIMS model) preselected ions can be detected simultaneously using electron multipliers. By finely tuning the magnetic field and aperture slits along the secondary ion path, mass resolutions capable of discriminating 12CHH- v. 12CD- and 12C15N- v 13C14N- are possible.
Figure 5 shows the usefulness of this instrument in an image of a unicyanobacterial consortium from Hot Lake, Washington, grown on a silicon wafer for 7 days with NH4 + as its primary nitrogen source. For the last 4 hours of film growth, it was fed isotopically labeled nitrogen (15NH4 +) prior to a NanoSIMS analysis to understand how this reduced form of nitrogen would be processed and incorporated into the community. Accordingly, Figure 5 provides a window into what is happening at the submicron scale in this film. In Figure 5c, it is apparent that consumption of NH4 + is localized primarily within the cyanobacteria filaments (the large structures exhibiting spots of 15N enrichment). With the NanoSIMS, individual heterotrophic bacteria were resolvable (cells that are typically less than 1 µm in size), and slight 15N-enrichment in individual heterotrophs was observed and quantifiable. These observations indicate either direct consumption of 15NH4 + by the heterotrophic bacteria or that the heterotrophs rapidly consumed a secondary metabolite made by the cyanobacteria using the 15NH4 +. These NanoSIMS measurements, and those described elsewhere [Reference Behrens14], were invaluable in determining actual metabolic processes within microbial communities.
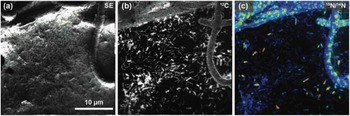
Figure 5 NanoSIMS image of the cyanobacteria community illustrates the high lateral resolution of SIMS. The secondary electron image (a) was collected simultaneously with the ion images (b and c). (b) Ion image of 12C- illustrates the location of biomaterial created by the community on the silicon wafer. (c) Ratio image showing the locations of nitrogen enrichment within the sample, where enrichment is shown by 12C15N-/12C14N- ranging from blue (1×) to red (10×) over the 15N natural abundance value (where 15N/14N=0.00367). This is a 256 pixel × 256 pixel image using a beam size of approximately 110 nm. The lateral resolution of this image is modestly low for a NanoSIMS image, here defined by a pixel size of 156 nm.
Three-dimensional SIMS.
The surface sensitivity of SIMS limits analysis to 2D images; however, it is possible to use the dynamic sputtering capabilities of the incoming ion beam to etch away part of the sample and reveal a lower layer (or slice) of the sample. Figure 6 shows a schematic of this process where a sputter ion source (usually primary ion beam different from that used for analysis) is employed to erode a layer of the sample followed by 2D image analysis with the analysis ion beam. In this manner a series of separate layers can be etched and then imaged. By reconstructing these serial 2D images a 3D representation of the sample can be formed—even the 3D reconstruction of a single cell [Reference Robinson15]. Figures 7a and 7b show an example of this with a reconstruction of C2C12 confluent cells grown on a silicon wafer (image provided by the Dr. Daniel Graham of the NESACBIO group). A bismuth LMIG analysis source in a ToF-SIMS was used to analyze the cells (acquire 2D images), and a C60 cluster ion source was used to sputter away the layers. Figure 7a shows a 3D reconstruction image using the m/z = 58 (choline) + m/z = 184 (phosphocholine) peaks, which are headgroup components of phosphatidylcholine (a component of the cell wall) showing the outer membrane of the cells. Figure 7b shows the same reconstruction, but only showing the lower half of the cell membranes. What appear as empty “holes” in the image are due to limited signal from these masses in the cell interiors. This type of data reconstruction demonstrates the possibility for ToF-SIMS to be used to create 3D molecular maps of cells and other biologically relevant samples with sub-micron resolution.
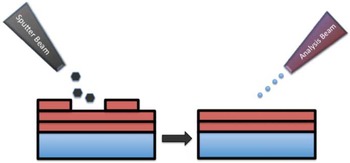
Figure 6 Schematic of the SIMS sputter-then-image method to create separate 3D images. A series of 2D images at increasing depths can be reconstructed to create a 3D representation of the sample.
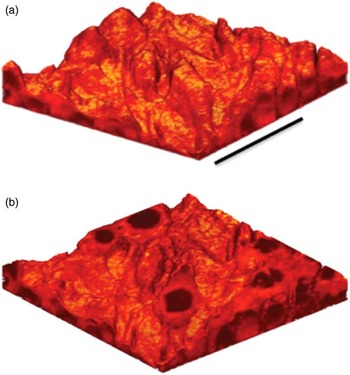
Figure 7 (a) 3D reconstruction of a ToF-SIMS depth profile of C2C12 cells taken with an IONTOF TOF.SIMS5 instrument at NESACBIO. A summation of the m/z = 58 (choline) + m/z = 184 (phosphocholine) peaks is used to show the position of the outer cellular membrane. Bar = 50 µm. (b) Same 3D reconstruction as in (a) but showing only the lower half of the cells. The cell interiors are dark because the signal displayed is related primarily to the cell membrane.
Discussion
The use of SIMS imaging techniques to analyze biologically relevant samples has increased in recent years as evidenced by the increasing number of published manuscripts and research groups using this MSI technique to characterize biologically related samples. There are different strengths and weaknesses in the different types of SIMS instrumentation and analysis modes. However, new instruments are being developed that combine capabilities. For example, coupling ToF-SIMS with tandem MS capabilities would allow for rapid imaging of a sample followed by verification of the structural confirmation of ions of interest. The introduction of cluster ion sources over the past decade has improved the mass analysis range of SIMS by increasing ion yields of higher mass fragments and intact molecular species. Cluster sources have also improved the 3D capabilities of the SIMS imaging by allowing thinner “slices” to be sputtered off the sample for higher z-dimension resolution. Data processing techniques (for example, multivariate analysis) are now more commonly applied, allowing for more information to be mined from the large amount of data produced with SIMS techniques [Reference Graham and Castner16].
Conclusion
SIMS has been a staple method of inorganic surface analysis for nearly half a century. However, SIMS has recently experienced a renaissance in the pursuit of novel chemical information about tissues, single cells, and microbial systems. New SIMS instrumentation, methods, and data analysis approaches have been and are continuing to be developed to obtain biochemical information previously unattainable. Here, we demonstrated the high mass-resolving power and mass-accuracy measurement FTICR-SIMS can provide. We show the value in ToF-SIMS to generate high-information-content chemical maps with an order of magnitude better lateral resolution than the FTICR-SIMS. We demonstrate that NanoSIMS is capable of producing very high spatial resolution information of submicron environments. Finally, we establish that reconstruction of images at progressive depths with SIMS allows 3D images of cell and tissue structure. Each of these methods has their limitation, but multi-technique approaches are useful to gain a greater understanding.
Acknowledgements
The authors would like to thank Dr. Daniel Graham (NESACBIO, University of Washington) for ToF-SIMS images and advice, and Ljiljana Pasa-Tolic (PNNL) for advice and useful discussions. They also thank Florian Marty (University of Zurich) and Ron M. A. Heeren (Maastricht University) for the wing disc sample and Jesse Cole (PNNL) for the cyanobacteria sample. LJG acknowledges the NESACBIO funding NIH P41 EB002027. Portions of the research were performed using the Environmental Molecular Sciences Laboratory, a national scientific user facility sponsored by the Department of Energy’s Office of Biological and Environmental Research located at PNNL. PNNL is a multi-program national laboratory operated by Battelle for DOE under Contract DE-AC05-76RL01830.


