


Introduction
Modern microscopy provides extraordinarily useful data about life science and materials science. As more capabilities are available in microanalytical instruments, the data being acquired, managed, and analyzed grows exponentially.
For example, some of the following often occur in a microanalysis workflow: (a) you conducted a number of image processing steps but forgot what you did on which saved image, or (b) you struggle with image segmentation because the automatic thresholding did not work, or (c) you launched a computation to finish over the weekend, but found on Monday that there was an operating system update that killed your session during a computer reboot, or (d) important images collected years ago were difficult to find. This article describes some solutions to these difficulties.
The problem
Recent advances in microscopy, such as improved resolution, new analytical capabilities, and the addition of the third spatial dimension, provide insights for both fundamental research and various industrial applications. The rapid adoption of advanced microscopy, however, has led to an explosion of imaging data. Different imaging methods, such as micro-computed X-ray tomography (MicroCT) and scanning electron microscopy (SEM), have different resolution capabilities and various fields of view (FOV). Analysis using multiple imaging methods at various resolutions (that is, correlative imaging) is often needed to solve complex problems. Furthermore, a sequence of processing and analysis steps is typically required. Each step creates new data that is either similar or larger than the size of the original image. For example, a three-dimensional (3D) MicroCT dataset often has 2000 images, with each image having 2000 × 2000 pixels with 16-bit grayscale intensity values. This dataset requires approximately 16 gigabytes (GB) of storage. A median image filter, for enhanced signal-to-noise ratio, will create a processed dataset that has the same size as the original data. However, an autocorrelation function, describing how well a microstructure phase correlates with itself when it is displaced in all possible directions, hence capturing dispersion patterns of the phase such as periodicity, produces data in 32-bit floating point values, which is twice the size of the original data, or 32 GB. Ultimately, in this simple, two-step microanalysis workflow, a total of 64 GB of data is generated. Practical microanalysis workflows often require more than two processing steps. Table 1 summarizes the possible data generation steps in the life cycle of a microscopy image. By the end of an analysis workflow, the data size could increase by up to 14–25 times from the size of the original image, reaching 224 GB to 650 GB. With multiple 3D datasets from multiple samples in a typical microanalysis project, the data size can be substantial. The management overhead of these datasets is a daunting challenge that renders conventional desktop-based hardware and software approaches ineffective.
Table 1: Steps of a typical image-analysis workflow and the corresponding data increases.

Desktop information technology systems may be inadequate
Although the cost of imaging devices is decreasing, that is not the case for high-end light microscopy, MicroCT, focused ion beam scanning electron microscopy (FIB-SEM), and transmission electron microscopy (TEM) systems, which are still exclusive to the million-dollar club. Expertise and time are required for both acquisition of high-quality images and analysis of them. When thresholding does not work well enough, considerable human effort is often needed for an accurate segmentation. Consequently, modern state-of-the-art microscopy with these high-end tools is expensive. Currently, these microscopy datasets and their derivatives are largely unmanaged. The microscopist has to manually archive the data, which involves copying the data and tracking the record. Searching, retrieving, and visualizing these data after some time is difficult, if not impossible. Corporate information technology (IT) solutions, designed to manage documents and spreadsheets, are unfit for image data. For example, it is a good practice to archive a series of WORD documents, to create multiple recovery points. The same strategy is impractical for a 16 GB MicroCT volume. As a consequence of these difficulties, most of acquired microscopy data cannot be shared, reused, or accessed easily and hence is severely underutilized.
AI and CC to the rescue
Artificial intelligence (AI) and cloud computing (CC) provide solutions to the life cycle management of imaging data that has benefits in the storage, sharing, reuse, and accessibility of microscopy data. Various AI methods can automate time-consuming image processing tasks, such as segmentation, and facilitate the extraction of new information from existing imaging data. Cloud computing alleviates problems associated with storage, data indexing, and hardware resource management problems.
Managed Image Processing and Analysis
AI image segmentation
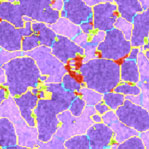
Due to the massive nature of the aforementioned data, manual processing and segmentation is not feasible in many research environments. Consider the problem of analyzing candidate drug formulations for effectiveness (Figure 1). Conventional image processing algorithms, such as thresholding, are challenged by features with similar grayscale histograms (for example, polymer phase and amorphous drug phase in Figures 1d and 1e), varying contrast from image to image, and intrinsic artifacts that convolve with the smallest image features. Supervised artificial intelligence [Reference Lézoray1] can recognize features and patterns within a large set of data that conventional algorithms fail to find. The recognized features, once validated on a smaller scale, can be deployed to automatically process massive amounts of similar data.
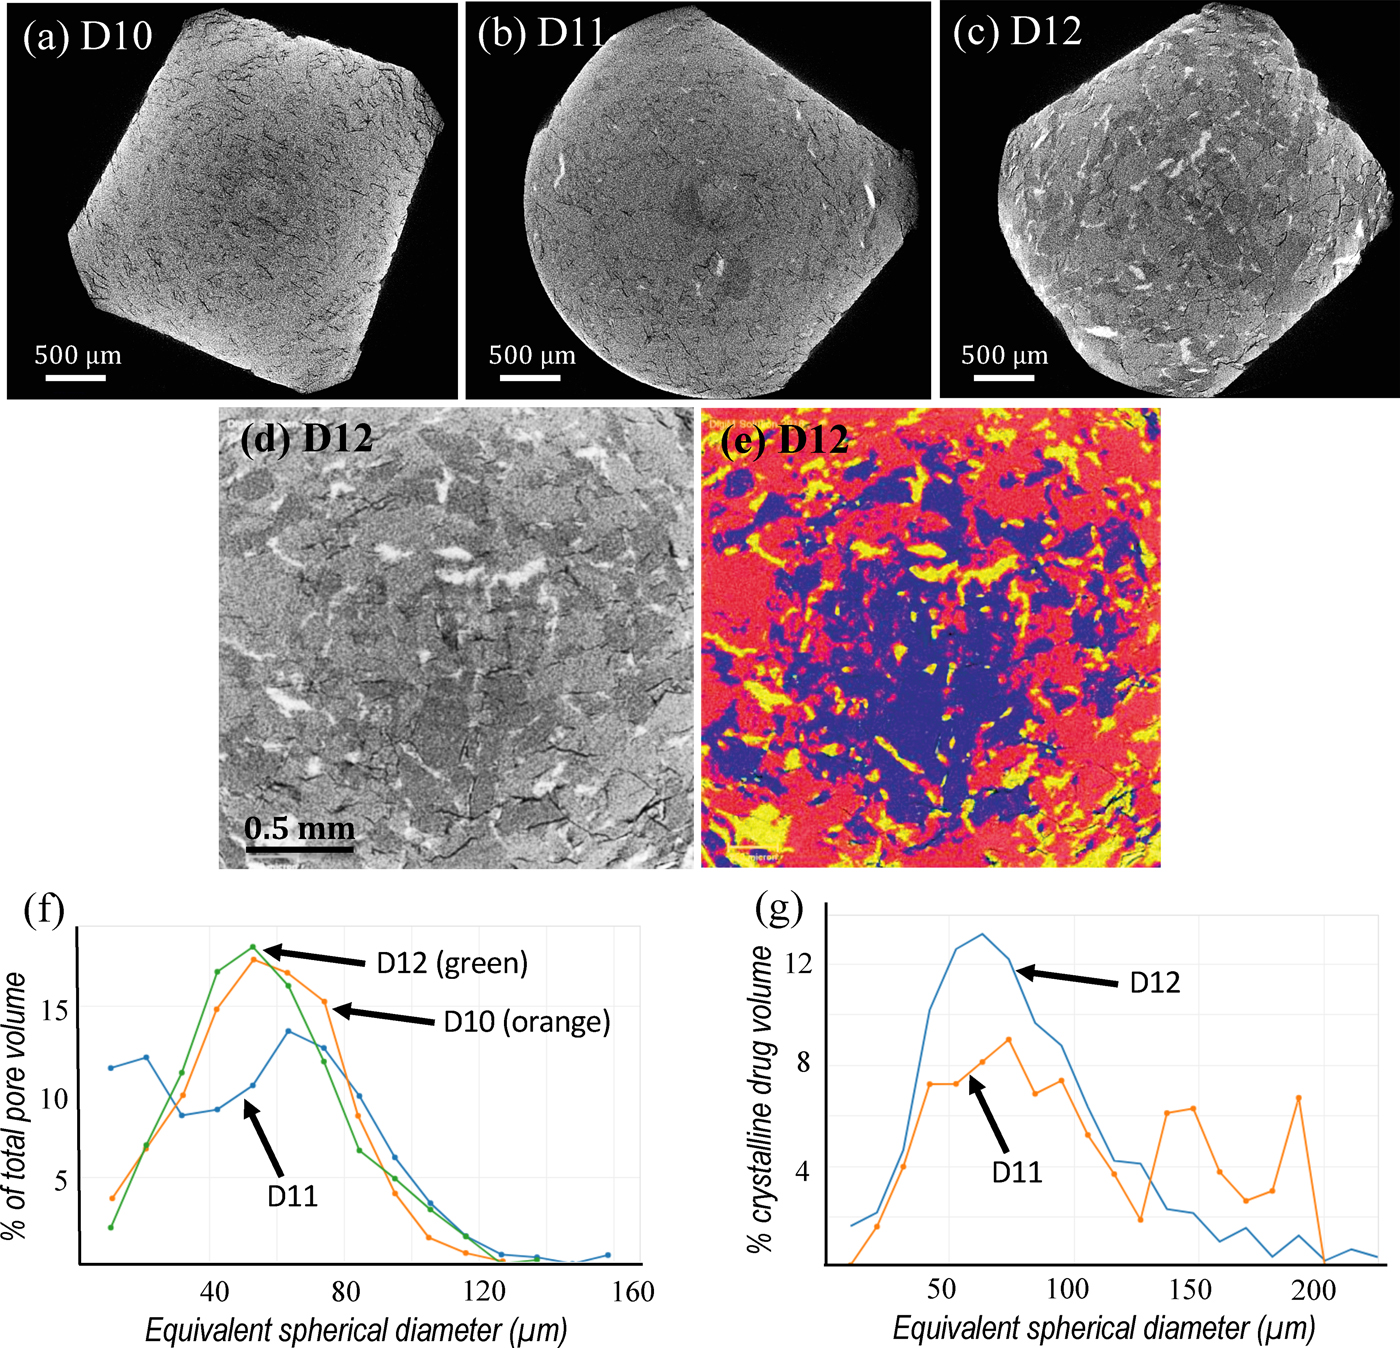
Figure 1: Bioavailability of active pharmaceutical ingredients in a biologically friendly amorphous state studied using DigiM I2S cloud image management and AI image segmentation [Reference Zhang3]. (a), (b) and (c) are cross-section images extracted from 3D X-ray MicroCT tomographs of three selected samples: D10 (no drug), D11 (low drug crystallinity), and D12 (high drug crystallinity). (d) Cross section of D12 at higher magnification. (e) Same image overlaid with AI-based segmentation of four phases: blue – copovidone polymer; red – amorphous drug; yellow – crystalline drug; black – pore. (f) Pore size distributions from the three samples: D10 (orange), D11 (blue), and D12 (green). (g) Crystalline drug particle size distributions for D11 (orange) and D12 (blue). Note curves in (f) and (g) are for data selected, from large numbers of measurements, for clearer comparisons. The jagged curve for D11 is due to a smaller number of particles measured.
Cloud computing
The benefit of automation with AI does come at a cost; it often requires extraordinary computational resources. Although desktop workstations are equipped with multiple cores, computations during a microanalysis workflow are not efficiently managed by most existing commercial and open-source software. The microscopist often needs to manually launch the computational tasks and monitor their progress. Cloud computing, in comparison, provides on-demand support for an analyst's processing requirements 24/7.
Simply put, cloud computing allows the user to store data and conduct computations in the cloud. The most important architectural benefit is the separation of the data, the hardware, the software, and the user interface (UI), which typically are all lumped together in the conventional desktop software approach. Through a web browser to a dedicated cloud platform, users have easy access to their data at any time, from anywhere, and using any device. By subscribing to a cloud software as a service (SaaS), the user is not required to purchase any hardware or software upfront. Installation, maintenance, and upgrades are all taken care of transparently, saving time and resources.
General purpose business-to-consumer (B2C) cloud computing technology (such as Google Drive and Dropbox) benefits the microscopy community already in cost and accessibility. Specific business-to-business (B2B) cloud computing, such as DigiM Image to Simulation (I2S) microscopy image management and processing software, emphasizes “computing” as much as “cloud.” Cloudified data can be made easily accessible to advanced algorithms, such as AI and computational physics, executed on massively parallel computing clusters specifically designed for quantification and image-based predictive simulation to a microanalysis workflow.
DigiM I2S
DigiM I2S [2] is a cloud software platform that integrates the management, quantification, and simulation of microscopy data. Its web-browser interface connects to the user's microscopy data via either a B2C cloud storage link (Google Drive, Dropbox, etc.) or an upload from the user's local computer disk. The I2S software organizes data into projects and generates browser-friendly previews of the original data, derived data, and quantitative results that facilitate comparisons among different samples. The user can iteratively refine the training of the I2S AI algorithm for recognizing features from a seed image. Once the training is considered satisfactory, a cloud computing session is launched to process a larger dataset, which can be one or more 3D images, a mosaic of 2D images, or a selection of similar images from different fields of view, different imaging methods, different dimensionalities, and even different samples.
Analysis and simulation
The processed image is then analyzed with computations of particle size distributions, volume fractions, shape factors, orientations, aspect ratios, etc. The microstructures found may be simulated with a computational physics engine to compute physical properties including transport properties (for example, permeability using Navier-Stokes equation and the diffusivity coefficient using Fick's equation), mechanical properties (for example, Young's Modulus using linear finite element methods), conductivity properties (for example, electrical conductivity using Ohm's law and thermal conductivity using Fourier's law), and complex properties with multiple solid and fluid phases under variable pressure, temperature, and flow conditions.
Image data and their analysis results are integrated with a database, which supports searching, indexing, logging, and tracking. The user retains access to all data at his or her fingertips all the time. Powerful web-based visualization software permits the user to share, communicate, and keep records on his data. The DigiM I2S software package also supports multi-user collaboration. It can operate either as a remote cloud, or as an on-premise private cloud, to satisfy a variety of needs in data amount, data confidentiality, and data transfer speed.
Cost advantages
Cloud computing is convenient and cost-effective. It reduces the upfront cost for the user of software, hardware, and IT to zero. Current commercial and open-source solutions tie functions with usage, and the premium usage fee is charged regardless how much a user uses a software. With a cloud computing platform such as DigiM I2S, a heavy user can subscribe at a premium level, which supports his interactions with large quantities of data and large computation demands. On the other hand, a light user will subscribe at a standard level and pay on-the-fly only when data access and computation are occasionally required. A light user does not necessarily mean a less sophisticated user. Hence cloud computing offers the same level of sophistication regardless of the frequency of use and commitment from the user. It is simply a different way of accounting usage time. Table 2 summarizes the technology and cost advantages of a cloud-based image processing approach over a desktop-based image processing approach.
Table 2: Technology and cost advantages of the cloud-based approach over a desktop-based approach. A more informative version can be accessed via http://www.digimsolution.com/software/digim-i2s/return-investment-comparison/

Example applications
Industrial applications rely increasingly on microscopy imaging and image processing to innovate. By employing a cloud-based approach, users gain the ability to solve problems previously considered unsolvable. Indeed, expanded capability rather than cost savings is more often the primary driving force for the adoption of cloud computing. The following examples give a glimpse into how researchers in pharmaceutical science, geoscience, and materials science are using a cloud-based image processing approach with the DigiM I2S. Note all DigiM I2S simulations are conducted directly on segmented imaging data, without simplifications of the microstructure or reductions of resolution using resampling.
Pharmaceutical
A common approach to improve the solubility and bioavailability of poorly soluble active pharmaceutical ingredients (APIs) is to formulate the API in a biologically friendly amorphous state. It is critical to control the amorphous solid dispersion (ASD) process and ensure that the API does not recrystallize. A pharmaceutical study was conducted jointly between AbbVie, Inc. and DigiM to measure crystalline APIs in an ASD formulation [Reference Zhang3]. The crystallinity of the API was quantitatively characterized using 3D X-ray MicroCT (XRTmicron, Rigaku Americas Corporation, The Woodlands, Texas). Tablet samples composed of indomethacin API in copovidone (PVPVA) polymer with similar drug loading but different levels of crystallinity were imaged (Figures 1a,1b,1c). Conventional threshold and gradient-based segmentation faced numerous technical challenges that were difficult to overcome. Upon a five-minute interactive training, the DigiM I2S AI image segmentation engine successfully segmented four material phases, namely, crystalline drug phase, amorphous drug phase, polymer phase, and porosity phase (Figures 1d,1e) on tens of thousands of images during an overnight cloud computing session. The size distribution of pores and the crystallinity of the API (Figures 1f,1g), as well as the volumes and surface areas for all four phases, were computed and validated. These quantifications are difficult, or impossible, to obtain with other laboratory methods. Only a limited amount of data was shown here for both clarity and confidentiality reasons. Through the DigiM I2S cloud, however, tens of thousands of measurements of dozens of microstructure phases from tens of 3D datasets can be AI-segmented automatically and compared to provide insight into the effectiveness of how an API is rendered in an amorphous state. Thus, DigiM I2S enables an analysis project to be completed in weeks, that would otherwise require years of effort from the same analysts. Such approaches could potentially improve drug-development efficiencies with respect to time and material costs, as well as reduce the burden of animal and/or clinical screening studies. Image-based characterization data were also used to correlate formulation parameters with drug release performance through numerical simulations of effective diffusivity coefficients, disintegration patterns, and various designed release behaviors [Reference Wu and Zhang4].
Geoscience
Tight rock, including shale, is not only an important hydrocarbon resource, but it is of interest in environmental research concerning underground storage of greenhouse gas and nuclear waste. The physical properties of these rocks, with sub-micron pore sizes and sub-millidarcy permeability, are difficult to study using physical laboratory core analysis. For example, in order to measure how hydrocarbons might flow through a rock sample, fluid is pushed through the sample via pressure. When the pores are small, excessive pressure will either damage the sample or deform the sample, altering the pore space being measured. Microscopy imaging, in combination with AI-based image processing and computational physics methods provided by DigiM I2S, offer great potential in characterizing these difficult rocks at reservoir temperature and pressure. A suite of characterization tools was developed in DigiM I2S and validated to correlate rock images with petrophysical properties of rocks such as relative permeability [Reference Byrnes5]. Raw SEM images were acquired on a Helios 660 FIB-SEM (Thermo Fisher Scientific, Waltham, MA), and X-ray MicroCT images were acquired with a Versa 520 (Carl Zeiss Microscopy, Pleasanton, CA). Cloud computing and AI image processing make it possible to manage, analyze, and simulate tens of thousands of images from hundreds of datasets collected from different samples, from different wells, and analyzed by different microscopists over several years. For simple rock types, such as Niobrara chalk, a single imaging method is sufficient to capture both the smallest feature and large enough field of view to be representative (Figures 2a,2b). Relative permeabilities for this extremely tight rock were computed and validated for the first time, which played a critical role in reservoir engineering decisions [Reference Byrnes6]. By comparison, complex rock types, such as Alaska sandstone, require multiple imaging modalities and more sophisticated modeling (Figures 2c,2d). Imaging of specific configurations of pores over a large size range in a single rock type was essential in this case for building a model that helps in understanding how microstructure variations affect permeability.

Figure 2: Two different rock types categorized by pore microstructure and the level of multi-scale imaging required to image the pore microstructure [Reference Byrnes5,Reference Byrnes6]. (a) SEM image of a cross section of Niobrara chalk with monodispered pores that can be sufficiently characterized by SEM imaging alone at a single magnification per sample. (b) Relative permeability simulation from DigiM I2S on four samples (solid symbols with four shapes). The x-axis is water saturation, and the y-axis is relative permeability on a log scale. Green and blue symbols and lines are simulation results for oil relative permeability and water relative permeability, respectively. Red dots are experimental oil permeability measurements that validate the simulation results. (c) SEM image of a cross section of Alaska sandstone, rock with clay-bound intercrystalline microporosity in addition to porosity related to larger cracks. (d) X-ray MicroCT image of cross section of Alaska sandstone overlaid with a micro-fracture model constructed from a series of SEM images. Red color indicates large pore throat size, and blue color indicates smaller pore throat size.
Materials science
Modern electrochemical energy storage and power generation devices depend on microstructures. However, each functional layer, or component, of these devices has a distinctive length scale. The design, characterization, and optimization of the structures demand both high-resolution imaging and device-scale imaging, which are difficult, if not impossible, to achieve simultaneously. The development of 3D microscopy techniques and the use of different instruments to examine the same region allows observations at various length scales. By combining AI and high-performance computing, a massive amount of 3D imaging data at various scales can be integrated. In addition to the benefit of direct visualization of microstructures at various scales, image-based simulation overcomes various difficulties and challenges from physical experiments. Figure 3 shows DigiM I2S software applied to a proton exchange membrane (PEM) fuel cell. The raw tomographs were acquired in a Technai Osiris TEM (Thermo Fisher Scientific, Waltham, MA), in an Helios Nanolab 650 FIB-SEM (Thermo Fisher Scientific, Waltham, MA), and in a Versa 520 X-ray MicroCT (Carl Zeiss Microscopy, Pleasanton, CA). These 3D images at three length scales, each using a different tomographic technique, were integrated with DigiM I2S. In the catalyst layer, nanometer-scale measurements were conducted on the TEM tomography volume, where the Pt catalyst particles were fully resolved enabling estimates of their contact surface areas in relation to changes in air flow and electrolyte. The calculated effective diffusivity and conductivity were then applied as effective properties of the porous media simulations using the FIB-SEM data at micrometer scale. These data were then iteratively applied to millimeter-scale effective media simulations using the MicroCT data. The multiscale imaging combined with multiscale simulations, over a scale range of eight orders of magnitude, helped to evaluate microstructures of various designs of PEM fuel cell samples [Reference Jankovic7].

Figure 3: Multi-scale 3D tomographs of a proton exchange membrane (PEM) fuel cell [Reference Jankovic7]. (a) A TEM tomograph image showing a nanometer-scale view within a catalyst layer of a PEM fuel cell. (b) One of the 385 x-y cross-section slices showing the same region reconstructed from the TEM tomograph. (c) Element map by X-ray spectrometry of the same area showing the Pt/C agglomerate with Pt (red), pores (blue), and ionomer (green). (d) A micrometer-scale view of a cross section the PEM fuel cell from an FIB-SEM tomographic dataset collected from the catalyst layer corresponding to (a). (e) Image segmentation results corresponding to the FIB-SEM image stack in (d), with white areas representing solid support material and black areas representing voids. (f) 3D reconstructed porous catalyst layer with light blue representing solid support material. (g-i) Millimeter-scale views of the PEM fuel cell assembly from X-ray MicroCT tomographs taken at three magnifications. The circles in (g) and (h) correspond to the approximate field of view in (i). Numbers in (i) indicate different layers of a typical PEM fuel cell assembly: 1– anode; 2 – separator; 3 – cathode, where TEM data corresponding to (a) and FIB-SEM data corresponding to (d) were collected; 4 – delamination; 5 – micro-porous layer; 6 – gas diffusion layer with polymer-coated carbon fibers.
Limitations
Internet availability and bandwidth are essential in accessing the cloud. Local client software serves as one solution to limited internet availability since the user will only need to access the internet occasionally. Customization can be incorporated into cloud software, like DigiM's I2S, to provide bandwidth intelligence to users with limited bandwidth.
Browser technology potentially limits memory use and the graphic visualization of a cloud-based system. However, as cloud-computing becomes more mainstream, browser technology should improve to meet the demand. A common misconception regarding the cloud is that all the stored data is public. Cloud computing is a technology platform. Whether or not the data deployed on the technology platform are public or private is solely dependent on user preferences.
Conclusion
Cloud computing and AI can be more than just the solution to the current inadequate state of image data management; it can be an enabling technology for industrial innovation. Without the extraneous costs and equipment that come with desktop-based approaches, a cloud-based approach is a cost-efficient way to store and analyze imaging data. With its logical storage and AI-based processing capacities, a cloud-based approach enables advanced algorithmic analysis of data that current desktop-based solutions are unable to handle. The state of cloud-computing today is exciting in that it has already contributed to the advancement of microscopy and microanalysis, but it has yet to reach its full potential.
Acknowledgments
The authors acknowledge their respective organizations for the permission to publish the images. We greatly appreciate the advice and guidance from Professor Charles Lyman, Editor-in-Chief of this publication.


