Introduction
In situ electron microscopy studies under gaseous environments have attracted attention not only for basic scientific research, but also for industrial applications. In the past decade, the majority of in situ TEM studies involving gas-solid interaction were performed in the differentially pumped environmental TEM (ETEM), which incorporates a series of differential pumping apertures and additional pumping capability to create a gaseous environment inside the microscope [Reference Sharma1,Reference Boyes2]. However, because of the current design of the ETEM, some constraints still exist: (1) the maximum gas pressure allowed in ETEM is only 15 Torr (0.02 atm), far from atmospheric pressure, which is not favorable for building a bridge between in situ results and real applications, particularly in catalysis research [Reference Li3]; (2) applicability of atomic-resolution high-angle annular dark-field scanning transmission electron microscopy (HAADF-STEM) imaging is limited by post-specimen differential pumping apertures [Reference Jinschek4].
Recently it has become possible to overcome these limitations for in situ atmospheric scanning transmission electron microscopy (STEM) studies through the use of a micro-electrical-mechanical systems (MEMS)-based, electron-transparent windowed gas cell [Reference de Jonge5]. Using this instrumentation, the sealed gaseous environment can reach atmospheric pressures during full HAADF-STEM imaging in a state-of-art probe-corrected TEM. In this article we illustrate the advantages of the windowed gas cell technique as applied to our in situ study of two important phenomena: (1) CO-induced Pt nanoparticle surface reconstruction at saturation coverage and (2) oxygen-driven Pt surface enrichment on supported Pt3Co nanoparticles.
Materials and Methods
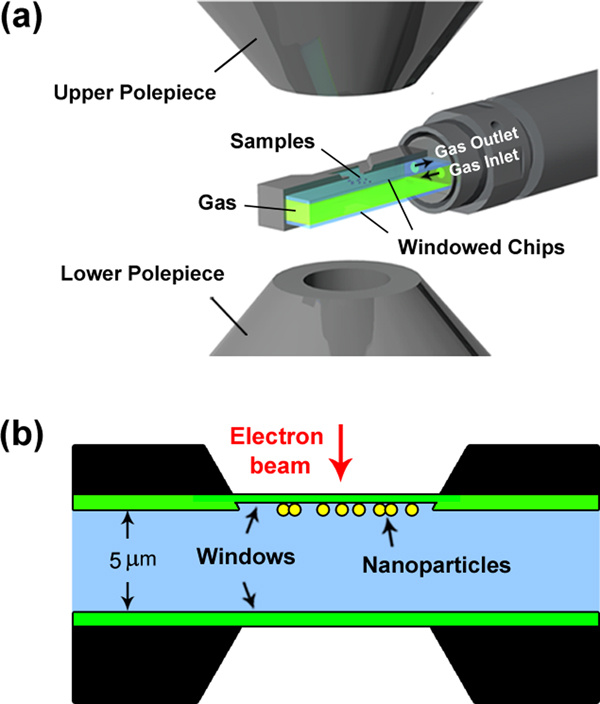
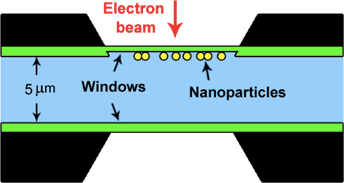
The design intent of the windowed gas cell is to modify the TEM specimen holder by placing a pair of electron transparent “windows” above and below the specimen to seal the gas atmosphere from the high vacuum of the TEM column (Protochips Atmosphere system), as shown in Figures 1a and 1b. Gas inlet and outlet tubes run through the specimen holder rod. The windows are made of amorphous SiNx to take advantage of this material's elastic properties and high fracture strength. These mechanical properties make the SiNx amorphous membrane strong enough to confine a pressurized gas up to four atmospheres [Reference Alan6]. In addition, the low electron diffraction contrast of the amorphous SiNx membrane does not limit the superposition of signals coming from the sample.

Figure 1: Schematic representation of the windowed gas cell TEM holder for in situ atmospheric STEM. (a) Cut-away view of windowed gas cell in the microscope gap (not to scale). (b) Cross-section drawing illustrating the structure of windowed gas cell. The black region is spacer, the green window is SiNx, and the light blue region indicates the gaseous area.
The gas cell holder can be safely inserted in conventional TEMs without modification to the column or vacuum system, which results in direct savings in terms of instrument cost and maintenance. No differential pumping apertures are required in this cell set up, making the electrons scattered at high angles available to the detectors and removing some of the limitations of HAADF-STEM imaging encountered in the differentially pumped ETEM. In addition, most powder samples can be easily loaded on this gas cell holder. For example, the powders are first dispersed in solvent, and the suspension is deposited directly onto one of the windows (the upper one or the lower one, depending on whether TEM mode or STEM mode is to be used). The powder samples are thus situated between the two windows, sealed in a gaseous environment.
Meanwhile, MEMS-based technology enables the integration of the SiNx windows into Si chips with heating capabilities. As shown in the schematic of the Protochips Atmosphere gas cell system (Figure 2), both chips are etched in the center region and support a thin (<50 nm) amorphous SiNx window over the open imaging area. In one style of the window chip, the amorphous SiNx window is supported over an array of 9 μm holes patterned in a thin low-conductivity SiC ceramic (see cutaway schematic in Figure 2), which serves as a heating unit. Gold electrode contact pads are fabricated on the two chips to allow current to pass from electrical leads coming through the specimen holder. With this design the heating membrane can achieve heating and cooling rates on the order of 106 °C/s, allowing more rapid thermal response and stabilization than with standard heating holders. It has been demonstrated that atomic resolution can be realized even at 1000 °C and 1 atm pressure in an aberration-corrected STEM/TEM instrument [Reference Allard7].

Figure 2: Windowed gas cell chip with heating capability. (left) Cutaway schematic of the six-hole gas cell heating chip with gold contacts to the heater. (right) Bright-field image of one of the holes in the SiC ceramic and the SiNx membrane window.
Results
CO-induced Pt nanoparticle surface reconstruction
This example is an observation of structural rearrangement on the surface of a Pt nanoparticle induced by adsorption of CO at saturation coverage and elevated temperature [Reference Avanesian8]. It is well known that the adsorption of reactive gaseous species can cause the reconstruction of metal surfaces, and it is also known that different configurations of surface atoms have different catalytic reactivities [Reference Gu9]. Thus, characterizing metallic surface structures under gaseous reaction conditions at atomic scale is critical for understanding reactivity.
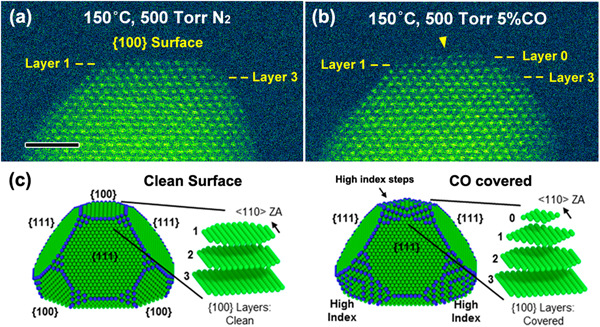
The specimen consists of ~10 nm diameter Pt nanoparticles in the shape of truncated octahedrons supported on carbon. As illustrated in Figure 3a, the atomic-scale HAADF-STEM image, taken at 150 °C in 500 Torr of N2, shows an edge view of flat {100} atomic planes at the surface of the as-prepared Pt nanoparticle (beam along the <110 > zone axis). This {100} surface configuration was stable under N2 atmosphere at 150 °C, and no morphological changes were identified during 30 minutes of in situ observation. At the end of that initial observation, and while the 150 °C temperature was maintained, the N2 was pumped out, and 500 Torr of reactive gas (5 vol% CO in 95% Ar) was introduced into the gas cell. It is notable that the partial pressure of CO reached 25 Torr, ensuring a saturation CO coverage on the Pt nanoparticle surfaces (saturation requires ~10 Torr) [Reference Longwitz10]. As a result, Figure 3b shows an in situ HAADF-STEM image of the same Pt nanoparticle after exposure to the CO environment for 10 minutes. For a clear comparison of structural differences induced by CO exposure, layers 1 and 3 are marked as a reference in both the initial and reconstructed states. Upon CO adsorption, a new atomic plane of Pt atoms (marked as Layer 0) emerged on top of the original {100} surface, indicated by the yellow arrow in the experimental image (Figure 3b).

Figure 3: In situ STEM measurement of CO-induced Pt nanoparticle surface reconstruction. (a) HAADF-STEM image of a Pt nanoparticle under a N2 environment. Scale bar = 2 nm. (b) Same particle under a CO environment, showing a surface reconstruction on the {100} surface. (c) Wulff constructions of a Pt nanoparticle, based on DFT-calculated surface-free energies of clean surfaces and CO-saturated surfaces.
A density functional theory (DFT) calculation based on Wulff construction models was performed by using the real space grid-based projector-augmented wave method (GPAW) open source code [Reference Enkovaara11]. The surface energies of bare Pt facets and CO-covered Pt facets were calculated. After CO adsorption, the surface free energy of the {100} facet was comparable to that of stepped vicinal surfaces, for example, {210} and {310}, which are higher index surfaces likely to be more reactive. Thus, as shown in Figure 3c, the newly formed Layer 0 is created through the migration of Pt atoms from lower {100} layers (for example, Layer 1 and Layer 2). More under-coordinated Pt surface atoms (with metal−metal coordination numbers of 6 or 7), as indicated by blue atoms in Figure 3c, come into appearance next to the (100) surface. Both the STEM image and the DFT simulations suggest that under saturation CO coverage, the terminating Pt {100} facets will reconstruct to vicinal steps. Upon further CO annealing at a higher temperature of 300 °C for 10 minutes, the layer 0 was observed to disappear and the Pt particle reverted to its original shape [Reference Avanesian8]. The reversibility of the Pt surface reconstruction reflects the desorption of CO molecules, shown by in situ infrared spectroscopy to take place above ~230 °C [Reference Kale12].
Ordering and Pt surface enrichment in Pt3Co nanoparticles
The second example we present is the in situ STEM observation of surface evolution in ordered Pt3Co nanoparticles [Reference Dai13], which is important for the oxygen reduction reaction (ORR) in fuel cell catalysts. To better understand the formation process of a Pt shell, which is crucial for enhancing ORR activity, we performed an in situ experiment on carbon-supported Pt3Co nanoparticles under static pure oxygen at 760 Torr.
During the in situ experiment, the temperature was first elevated to 720 °C, which is close but below to the order-disorder transition temperature of a 75 at%Pt-25 at%Co alloy, at a high rate of 5 °C/s. Upon oxygen annealing at 720 °C for 30 min, the initially disordered Pt3Co nanoparticles were transformed to an ordered intermetallic L12 phase where Pt surface segregation had also taken place to form a two-layer Pt-rich shell. Away from the particle surface, the ordered (100) planes alternate as pure Pt and pure Co planes. In the atomic-level HAADF-STEM imaging of the (100) planes, the last Co layer at the particle edge (low intensity) provided a marker and was labeled the #0 layer. Additional Pt layers caused by the processing in oxygen then could be identified and counted as layers #1 through #4.
After the processing above, the temperature was rapidly cooled to 300 °C. The surface configuration of the Pt3Co nanoparticle was stable as shown in Figures 4a and 4d. Sequential atomic-scale HAADF-STEM images were then taken at a scanning speed at one frame every 16 s at 300 °C. As shown in Figure 4b, the Pt3Co nanoparticle was found to be larger at an elapsed time of 64 s with the measured diameter, d 64s, of 13.18 nm, showing an increase of Δd = 0.39 nm (3.90 Å), compared to the particle status in Figure 4a. In the corresponding enlarged panel, Figure 4e, it is evident that an extra atomic layer (layer #3) had grown on the (100) surface. The lattice spacing between layer #2 and layer #3 is found to be 0.195 nm (1.95 Å), which is exactly half of Δd. This indicates another extra atomic layer has also started growing on the opposite (100) facet at the lower-right corner of Figure 4b. Similarly, by comparing Figures 4a and 4b, an extra layer can also be identified on the other two (100) surfaces (the one at the top right and the one at lower left). Furthermore, at an elapsed time of 128 s, Figure 4c, the measured diameter, d 128s = 13.57 nm, indicating a further increase of 0.39 nm (3.90 Å), demonstrating that the particle continued to undergo layer-by-layer growth at (100) surfaces. The atomic resolution image of Figure 4f shows the newly grown layer #4.

Figure 4: In situ STEM observation of layer-by-layer growth of a (100) Pt shell on ordered Pt3Co nanoparticles during oxygen annealing. (a–c) Sequential HAADF-STEM images taken at 0 s, 64 s, and 128 s during oxygen annealing at 300 °C, respectively. Scale bar = 2 nm. (d–f) Corresponding enlarged false-color images of the (100) cross section of the surface from region indicated by red boxes in (a–c), respectively. Beam direction along [Reference Sharma001]. Yellow and blue spheres represent Pt and Co atoms, respectively. Scale bar = 0.5 nm (5 Å).
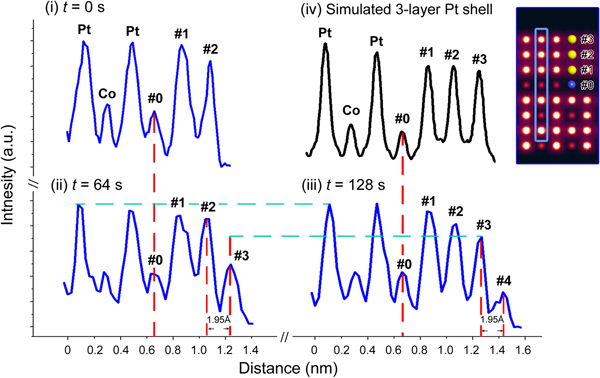
To determine the composition of the newly grown layers, HAADF-STEM intensity analysis was performed by using Gatan Microscopy Suite Software. Intensity profiles were obtained from the same (020) plane indicated by blue boxes in Figures 4d–4f at t = 0, 64, and 128 s, respectively. Then, as summarized in Figure 5, the new layers #3 and #4 can be quantitatively represented in the sequential intensity profiles. Comparison of profiles (ii) and (iii) indicates that the intensity of layer #3 is increasing during the interval of 64 s–128 s. At 128 s, layer #3 may be considered completely grown since the new layer #4 has started growing. The columns in layer #3 exhibit an intensity similar to that of the segregated Pt layers #1 and #2, which is higher than that of the inner Co columns. For confirmation, a HAADF-STEM image simulation was performed based on a segregated intermetallic Pt3Co model with a three-layer pure Pt shell, by using the QSTEM simulation package [Reference Koch14]. According to the simulation results, the intensity profile of the three-layer Pt shell shows the same trend as the corresponding layers #1–#3 in the experimental profile (iii), supporting the experimental result that the newly grown layer is, indeed, a Pt-rich shell.

Figure 5: Intensity profiles taken along the blue boxes in Figure 4 (0 s, 64 s, and 128 s) and (iv) the result of an HAADF image simulation. Inset shows a simulated image of the three-layer Pt shell on the (100) surface.
Discussion
Using a windowed gas cell specimen holder for in situ STEM, we observed surface phenomena that are difficult or impossible to observe by other methods. Direct observation of the reconstruction of metallic surfaces at realistic temperatures and pressures has been sought for decades.
In the first experiment, the truncated octahedron shape adopted by bare Pt nanoparticles was observed to reconstruct as a result of CO adsorption. In this facet-specific process, flat (100) facets roughen into vicinal stepped high Miller index facets, while it is assumed that flat (111) facets remained intact. The relatively high partial pressure of CO (> 20 Torr), allowed in the windowed gas cell, ensured saturation CO coverage, which triggered the observed surface reconstruction of Pt nanoparticles.
In the second experiment, the alternating Pt and Co (100) planes of ordered Pt3Co particle provided an internal marker for observation of surface reconstruction in oxygen. This allowed atomic-level compositional imaging at the surface. The details of this observed oxygen-driven Pt surface enrichment may pave a way for designing and tailoring the structure and performance of the Pt-Co ORR catalyst. This case study highlights the capability of Z-contrast HAADF-STEM imaging combined with image simulation for analysis of chemical composition changes at nanoparticle surfaces under realistic catalytic conditions.
Thus, a MEMs-based window gas cell enables an in situ atmospheric STEM study at atomic resolution to explore novel and interesting phenomena occurring during gas-solid interactions. However, some limitations still exist in the current form of the windowed gas cell for more general analyses on a wider range of materials. These limitations include a lower contrast for light-element materials (for example, graphene, boron nitride) because of the dimension of the SiNx windows and the single-tilting function of the current design. But it may only be a matter of time before these constraints are removed. We believe that atomic-resolution in situ STEM under atmospheric pressure will be an essential tool for advanced research of gas-solid interactions, and numerous exciting findings can be expected.
Conclusion
In summary, the windowed gas cell now allows atomic-resolution STEM observation of dynamic structure evolution of catalytic nanomaterials under realistic gaseous conditions, providing information that is beneficial to understanding their structure-properties relationship. The two application examples presented here clearly demonstrate the advantages and capability of this in situ technique, particularly the high spatial resolution and high stability under atmospheric gas pressure.
Acknowledgments
The authors thank Protochips Inc. for the technical support of the Atmosphere windowed gas cell facility. Additional support was provided by the University of California – Irvine Materials Research Institute (IMRI) for use of the state-of-the-art TEMs.