


Introduction
Confocal microscopy is widely used in cell biology. Like other filter-based systems, traditional confocal microscopes are limited by the spectral bands established by each optical filter. As a result, emission spectra from labels and/or autofluorescence can be overlapped leading to spectral crosstalk and inability to quantify the amount of signal originating from each individual fluorescent species. The need for accurate quantification of in vivo cellular processes and in-depth knowledge of organelle development and microstructure led Monsanto to search for non-commercial microscopes that could achieve those goals. Through a cooperative research and development agreement (CRADA) established between Monsanto and Sandia Corporation in August 2006, we built a new 3D-hyperspectral confocal fluorescence imaging system, specifically designed to meet the analytical requirements of plant specimens.
Instrumentation
The hyperspectral confocal fluorescence microscope is a non-filter-based imaging system developed for the quantitative analysis of fluorescence (primary or secondary) from biological and non-biological specimens. The instrument simultaneously records the entire emission spectrum from 500 nm to 800 nm (512 wavelengths) for every voxel within the imaged volume with a spectral resolution of at least 3 nm [Reference Sinclair1]. The current optical design employs a solid state 488-nm laser (Coherent Inc.) as the excitation source and a confocal pinhole to maximize spatial resolution and optical sectioning performance (Figure 1). Photon detection efficiency was optimized using a high-throughput prism spectrometer and a high quantum-efficiency electron multiplying charge coupled device (EMCCD) detector (Andor Technologies). A novel readout mode allows data to be acquired at a rate of ~8300 spectra per second, so that a two-dimensional hyperspectral image of a 25 μm by 25 μm field of view, sampled at 0.12-μm intervals, can be acquired in 5 seconds. The readout mode also eliminates keystone and curvature distortions that often plague spectral imaging systems. Epi and Trans light emitting diodes (LEDs) and an Andor Luca camera were added to the microscope for conferring wide-field epi-fluorescence capability for quick selection of regions of interest on the specimen prior to hyperspectral image capture (Figure 2). For a detailed description of the instrument see Sinclair et al. 2006 [Reference Sinclair1].
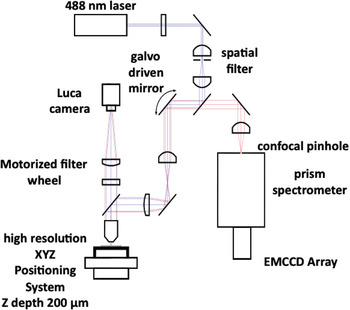
Figure 1: Optical layout of the hyperspectral confocal fluorescence microscope.
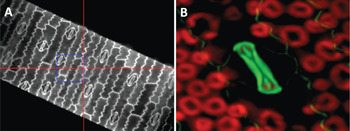
Figure 2: Low magnification lenses and wide-field epi-fluorescence capability provide spatial information prior to hyperspectral image acquisition. (A) Maize leaf epidermis illuminated by a Trans-LED (500-μm field of view). (B) Upper leaf page of an unstained maize leaf illuminated by Epi-LED. Epidermis showing a closed stoma (center, green) and sub-epidermal parenchyma cells (red, chlorophyll in chloroplasts). Field of view = 50 μm.
The information-rich and very large hyperspectral images collected by our microscope require fast and efficient analysis algorithms to provide qualitative and quantitative information about the images in a timely manner. Sandia National Laboratories has developed such algorithms using multivariate curve resolution (MCR) and have incorporated these algorithms into their MCR analysis software package (runAxsia) customized for pre-processing, analyzing, and viewing these types of hyperspectral fluorescence images. This hyperspectral image analysis software was written in Matlab (The MathWorks, Inc. Natick, MA) and calls C++ code (AXSIA) [Reference Ohlhausen2], which is the engine for all MCR analyses. The MCR algorithms use a constrained alternating least-squares implementation to extract the pure spectral components (the qualitative information) and the corresponding intensities (the quantitative information) of each spectral component for each voxel in the image. The advantage of using this MCR software is that it can discover and quantify all independently emitting species within the image that are above the noise without the need for standards or any a priori information about the sample. This makes MCR an ideal analysis technique when using our hyperspectral microscope for exploring unknown biological samples [Reference Timlin4, Reference Vermaas5, Reference Haaland6, Reference Haaland7]. There are other commercial software packages that utilize MCR to analyze spectroscopic data (for example, software from CAMO, Inc.), however Sandia's implementation of MCR is very fast and memory efficient [Reference Ohlhausen2]. A single hyperspectral image containing over 40,000 spectra can be analyzed in less than 5 seconds.
To improve our MCR results, it is necessary to employ pre-processing techniques to remove unwanted features from the hyperspectral image datasets. These pre-processing steps include removing: 1) spikes in the spectral data that are the result of cosmic rays hitting the detector, 2) offsets that were added to each spectrum from the EMCCD detector, and 3) a dark image collected close in time to the sample image. These pre-processing techniques are described in full detail elsewhere [Reference Jones3]. A summarized description of the MCR algorithm applied to our hyperspectral fluorescence image data has been reported elsewhere [Reference Haaland7]. In addition, we have developed techniques to improve MCR analysis results by properly weighting the data to account for instrument noise sources [Reference Jones3].
Thus, this instrument has the ability to follow many spectrally and spatially overlapping tags simultaneously and to discriminate them against autofluorescence or impurity emissions. The 3D-hyperspectral images obtained are analyzed using multivariate curve resolution software that can reveal emitting components with no a priori information, determine each emission spectral component, and provide relative concentration maps of each spectral component. Although the diffraction-limited resolu-tion obtained with this new microscope is comparable to that obtained with conventional confocal instruments (lateral resolution of ~0.25 μm), the hyperspectral images generated reveal structural details not observed with traditional confocal microscopes (Figure 3). Identification of noise sources and optimization of pre-processing and processing steps have significantly improved the quality of the images and information generated [Reference Jones3, Reference Haaland7].
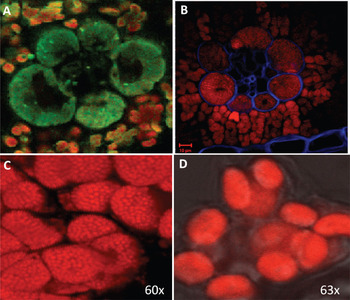
Figure 3: Comparison between images generated by our hyperspectral confocal microscope and images obtained using Monsanto's two-photon Zeiss LSM510 META, a filter-based system. Hyperspectral micrographs of a cross section of unstained maize leaf (A: 100-μm field of view) and of maize mesophyll chloroplasts (C: 25-μm field of view). Confocal micrographs of a stained cross-section of maize leaf (B) and of maize mesophyll chloroplasts (D) from the same plant. For (B), note that Calcofluor White (blue) was used to improve cell wall visualization, a step not required for hyperspectral microscopy (see Figure 5).
Applications
In addition to the applications developed for conventional confocal microscopy, this instrument has been used for the investigation of autofluorescence and differential photobleaching of pure spectral components as potential tools to further expand the power and applications of hyperspectral confocal microscopy. Our recent studies have focused on photosynthetic model systems such as maize (Zea mays) and arabidopsis (Arabidopsis thaliana).
Hyperspectral imaging of unstained maize leaf cross sections followed by MCR analysis consistently showed the presence of five pure spectral components in those samples (Figure 4A). The cellular location of the five pure emission spectra showed they originated from individual autofluorescent components in the chloroplasts (pures 1, 3–5) and in the cell wall (pure 2) (Figure 4B). Additional hyperspectral studies with maize and arabidopsis leaf mutants confirmed that pures 1, 3, 4, and 5 corresponded to the emission spectra of chlorophylls a and b and photosystems I and II. In contrast, only two fluorescence components were detected by traditional filter-based confocal microscopes: a broad spectrum originated from cell wall autofluorescence, and another broad spectrum originated from chlorophylls autofluorescence. As autofluorescence from cell walls was very weak, we used Calcofluor White for improving cell-wall visualization (Figure 3B). As mentioned previously, MCR analysis of hyperspectral images enables us to determine the relative spatial concentration of each pure spectral component per voxel and visualize its distribution in the sample. The relative concentration maps for maize leaf cross sections revealed differences in the amounts and distributions of chloroplast pigments between mesophyll and bundle sheath chloroplasts (Figure 4B). Those differences were clearly visualized in the corresponding RGB image (Figure 5) where the color assigned to each pure component in the spectral pure-component graph (Figure 4A) corresponds to the three RGB colors (pures 1, 2, and 3) in the image generated (Figure 5). High spectral resolution and minimization of sources of noise during image processing also enabled the visualization of regions of grana in the chloroplasts (Figure 3C versus Figure 3D), and this allowed the detection of the spatial distribution of chlorophylls a and b in each chloroplast (Figure 6). This proved to be a powerful application of this technology allowing the quantification and comparison of chloroplast pigment differences between plants with different leaf phenotypes, as well the correlation of hyperspectral imaging results with chloroplast ultrastructure and photosynthetic efficiency.
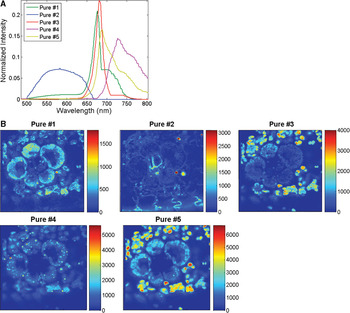
Figure 4: MCR analysis of hyperspectral images of maize leaf revealed the presence of five pure spectral components in those samples (A), and provided relative concentrations and the 3D spatial location of those pure components (B). Pure 2 is an autofluorescent component of cell wall; and pures 1, 3, 4, and 5 originate from chloroplast pigments.
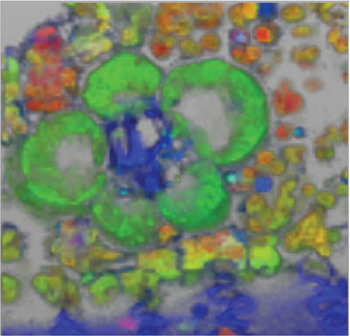
Figure 5: Tridimensional-hyperspectral micrograph of a fresh, unstained cross section of maize leaf. The color of the fluorescence in this RGB image corre-sponds to the relative intensity of the colors in the spectral pure-component graph (Figure 4A). Field of view = 100 μm.
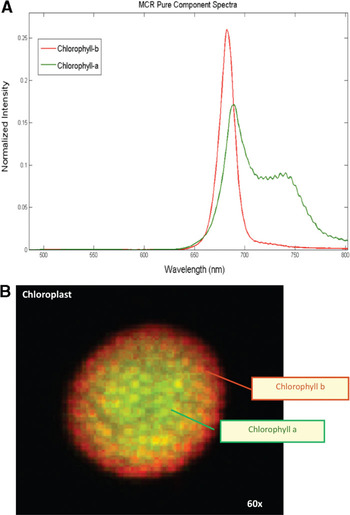
Figure 6: Spectra and distribution of chlorophylls a (red component) and b (green) in a maize chloroplast. Field of view = 25 μm.
Advantages and Potential
The evaluation studies performed using our hyperspectral confocal fluorescence microscope revealed significant advantages over traditional confocal microscopes, namely the ability to detect and measure fluorescent components in the plant cell not detected by commercial microscopes. When compared to a high-end commercial confocal microscope, the hyperspectral microscope proved superior for the following:
(1) Experiments using dyes and/or fluorophores, thus allowing the use of more labels per cell, lower concentrations of dyes, and detection of weak signals. Multiple labeling experiments can be carried out in a cell with Alexa probes and/or quantum dots, and/or coupled with a fluorescent staining. The upper limit of the number of fluorescent species that can be detected per sample has not been established yet. As fluorescent molecules have different photobleaching rates, photobleaching can be used to separate covarying spectral components. Double staining of organs, tissues, or cells can now be achieved for dyes with overlapping spectra (that is, staining of protein and lipid bodies using dyes that emit in the red). Also due to the sensitivity of the instrument, common cell viability or nuclear dyes can be diluted 10- to 100-fold. Detection of low abundant immunolabeled proteins, in which signal was undetectable using traditional confocal microscopes, was also possible. Very weak fluorescence signals can now be detected and measured in the presence of a very strong leaf fluorescence background.
(2) Detection of fixation artifacts and false positives. Spectral changes were detected after fixation with typical plant fixatives. However, for 3.7% formaldehyde, emission spectra from membrane-bound autofluorescent components were only significantly affected after the first eleven days in fixative, contrary to glutaraldehyde, acetone, or ethanol, which should be avoided. This new instrument also enabled the detection of false positives thus significantly improving the accuracy of diagnostic tests. For example, experiments with model systems transiently expressing green fluorescent protein (GFP) revealed that not all cells showing green fluorescence were expressing GFP. A spectral component with an emission peak close to that of GFP can be present on transfected cells and can be mistakenly quantified as GFP on filter-based systems.
(3) Detection, identification, and quantification of autofluorescent cellular components (such as chlorophyll a, b, carotenoids, and cell-wall components) as described above. The upgrade of the current instrument to include a two-photon laser with a wide tuning range will strengthen the power of this technology for the study of cellular components with optimal excitations below 488 nm.
(4) Separation of overlapping fluorescence signals, such as green autofluorescence and green fluorescent protein (GFP) or Fluorescein Diacetate (FD). This capability enabled us to use combinations of dyes and probes impossible to use effectively with traditional microscopes and to discriminate and quantify autofluorescent components co-localized with the molecule(s) of interest.
Conclusion
The hyperspectral confocal fluorescence microscope and MCR software package developed by Sandia National Laboratories overcomes the limitations of traditional filter-based confocal systems, providing the ability to follow many spectrally and spatially overlapping tags simultaneously and to discriminate them against autofluorescence or impurity emissions. Apart from the conventional confocal microscopy applications, this instrument allows the detection, identification, and accurate measurement of autofluorescent cellular components, weak fluorescence signals, fixation artifacts, and false positives, among others. This diffraction-limited imaging microscope has proven to offer a new look into the living cell, enabling the observation and quantification of pure emission fluorescent components never before achieved.
Acknowledgments
The support of Monsanto and Sandia management is gratefully acknowledged. Portions of this work were supported by the Laboratory Directed Research and Development program at Sandia National Laboratories. Sandia National Laboratories is a multi-program laboratory operated by Sandia Corporation, a wholly owned subsidiary of Lockheed Martin Company, for the U.S. Department of Energy's National Nuclear Security Administration under contract DE-AC04-94AL85000.


