INTRODUCTION
Reliable and valid diagnostic tests form the foundation for neuropsychological assessment across many domains of cognition. These paper-and-pencil tests are often standardized and are relatively easy to administer, requiring minimal equipment. For instance, line cancellation, line bisection, and visual search have played a major role in measuring and studying visual hemispatial neglect (a neurological disorder in which patients fail to attend to or make explicit use of contralesional information; e.g., Albert, 1973; Behrmann et al., 2004; Buxbaum et al., 2004; Ferber & Karnath, 2001; Halligan & Marshall, 1991). Although traditional paper-and-pencil tests are useful in assessing clinical signs, computerized testing can offer better control of stimulus parameters. By exploiting dynamic control over stimulus presentation time, speed of stimulus motion, or stimulus salience, some investigations have already shown that otherwise-obscured factors can contribute to neglect (e.g., Brooks et al., 2005; Deouell et al., 2005).
Nevertheless, almost all widely used tests of visual hemispatial neglect (computerized or otherwise) use fixed stimulus parameters. For example, most experiments use only a single duration for stimulus presentation. If the chosen duration is too long, only patients with the most severe impairments may show a deficit, whereas those with subtle deficits will not.a
Such omissions may be of particular concern when measuring perceptual and attentional processes operating on the order of milliseconds.
In neuropsychological populations, a truly successful diagnostic tool should accommodate each individual's level of impairment (as argued by Barrett et al., 2006, and others). Adaptive psychophysical (or, staircase) procedures permit this diagnostic flexibility. In adaptive procedures, a chosen stimulus parameter (e.g., stimulus duration) is manipulated until a desired level of performance is reached. The resultant value of the parameter at a particular level of performance (e.g., 500-ms duration required for 75% accuracy) can then be used as a quantitative index of impairment.
Here, we used such adaptive psychophysical procedures to assess visual hemispatial neglect in patients with unilateral brain injury. We used feature and conjunction search tasks for two reasons. First, we wanted to compare adaptive search measures with outcomes from traditional search tasks, which are frequently included in neuropsychological assessments of neglect [e.g., the Behavioural Inattention Tests (BIT), Wilson et al., 1987; Standardized Comprehensive Assessment of Neglect (SCAN), McGlinchey-Berroth et al., 1996]. Second, we wanted to determine whether the adaptive search measures reflect a dissociation previously found in fixed-parameter search studies. Specifically, patients with hemispatial neglect have shown greater difficulty finding conjunctions of features (such as a red square among red triangles and blue squares) than finding singleton features (such as a blue circle among red and yellow circles) when presented in their contralesional field (e.g., Eglin et al., 1989, 1991, 1994; Esterman et al., 2000; Hildebrandt et al., 2005; Laeng et al., 2002; Pavlovskaya et al., 2002; Riddoch & Humphreys, 1987).b
Note. A broad literature suggests that feature and conjunction search tasks probe different forms of visual processing: Conjunction search requires the serial deployment of spatial attention, whereas feature search does not. In neurologically healthy populations, feature search is often characterized as a parallel process (supported by data showing no increase in reaction time with increasing distracter number). Conjunction search is instead characterized as a serial process (supported by data showing a systematic increase in reaction time with increasing distracter number, and a ∼2:1 target-absent to target-present reaction time ratio). See Treisman and Gelade (1980) for early experiments and Wolfe (2003) for a more recent review of the relevant literature.
Furthermore, we focused our investigation on lateralized visual impairments in hemispatial neglect. We minimized response demands by requiring participants to respond verbally without time pressure. The adaptive procedure we used also incorporates a response bias correction (Kaernbach, 1990; see the Methods section).c
For an alternative approach to analyzing fixed-measure data, while separately estimating perceptual and response biases in hemispatial neglect, see Toraldo et al. (2004).
In the experiments that follow, we examined the ability of adaptive procedures to capture lateralized visual search impairments. In Experiment 1, we tested a group of healthy individuals to determine whether performance was symmetric across visual fields when using adaptive procedures in visual search. In Experiment 2, we tested a group of patients with unilateral brain injury on both standard paper-and-pencil search tasks, and adaptive feature and conjunction search tasks. We compared results from the standard and adaptive tasks, and examined whether adaptive outcomes replicate previous fixed-measure findings differentiating feature and conjunction search performance. In Experiment 3, we re-tested a subset of patients using better matched search displays than were used in Experiment 2, ruling out a potential stimulus confound. Together, the experiments reveal adaptive procedures to be a useful tool by means of which neuropsychological deficits may be characterized.
EXPERIMENT 1
Twelve healthy individuals performed three adaptive search tasks: two feature search tasks [Feature Search (FS) and Scattered Feature Search (SFS)] and a Conjunction Search (CS) task. No lateralized differences were expected in healthy individuals' performance.
Methods
Participants
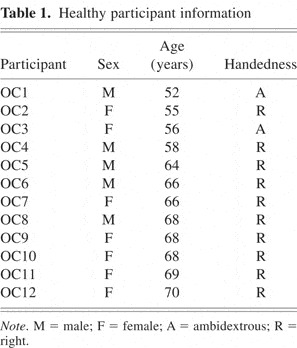
Twelve healthy individuals (7 women) gave informed consent before participation, in compliance with the University of California, Berkeley's Office for the Protection of Human Subjects. Their mean age was 63 years (range = 52–70 years). Two participants were ambidextrous, and all others were right-handed (Table 1).
Healthy participant information
Apparatus
Participants viewed stimuli from 60 to 70 cm, with their line of sight perpendicular to the widescreen LCD panel of a laptop computer. Screen resolution was 1280 by 800 pixels and the refresh rate was 60 Hz. The adaptive procedures were controlled by Presentation software (http://www.neurobs.com/).
Stimuli
Feature Search
Displays contained eight “O”s (Arial font, size 40). Items were arranged every 45° along an invisible 5.72°-radius ring, centered about the central fixation crosshair (Figure 1). None of the items fell on the vertical or horizontal meridians of the display. Targets were blue (RGB = 14, 67, 202) and distracters were red (RGB = 255, 0, 0), presented on a gray (RGB = 190, 190, 190) background. Targets appeared equiprobably at each location. Target-present trials contained one target, whereas target-absent trials contained none.

Stimulus displays for the adaptive Feature Search (FS) task, illustrating target-absent (top) and target-present (bottom) displays. Displays used colored stimuli, but for illustrative purposes, white replaces red and black replaces blue. Targets were blue (shown as black) “O”s.
Scattered Feature Search
Displays contained a central fixation crosshair and 14 squares (spanning 1.64°/side). Red targets and blue distracters were presented on a gray background. Colors were as above. One item was always presented in each of 14 locations (positioned between 5.72° and 8.17° from center; Figure 2). Targets appeared equiprobably at all locations. Target-present trials contained one target, whereas target-absent trials contained none.
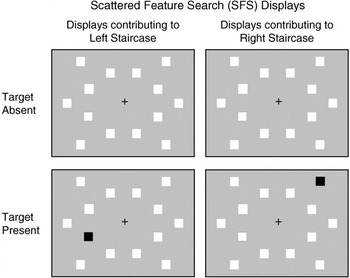
Stimulus displays for the adaptive Scattered Feature Search (SFS) task, illustrating target-absent (top) and target-present (bottom) displays. Displays used colored stimuli, but for illustrative purposes, white replaces blue and black replaces red. Targets were red (shown as black) squares.
Conjunction Search
Displays contained a central fixation crosshair and 14 items (spanning 1.64°/side), arranged as in the SFS. In addition to red and blue squares, red triangles were presented (Figure 3). Targets (red squares) were a conjunction of one feature from each of the distracters (i.e., color: red and shape: square). Colors were as in the feature search displays. Targets appeared equiprobably at all locations: Seven displays contained a right target and seven displays contained a left target, each with different distracter arrangements. Fourteen different target-absent displays were presented.

Stimulus displays for the adaptive Conjunction Search (CS) task, illustrating target-absent (top) and target-present (bottom) displays. Displays used colored stimuli, but for illustrative purposes, white replaces blue and black replaces red. Targets were red (shown as black) squares.
Design
Side (left, right) was entered as the single factor in the within-subjects experimental design. For each side of the display, the dependent measure was the stimulus duration necessary for 75% adjusted accuracy rate (described in detail below).
Procedure
To orient participants to each adaptive search task, they were shown three sample displays (with and without targets). Participants were instructed to fixate the central crosshair at the start of each trial, and to indicate whether or not a target was present on each trial by verbally responding “yes” or “no.” The experimenter entered participants' responses. Participants were encouraged to report what they saw as accurately as possible and were reminded that the speed of response was not important. If uncertain of their response, they were asked to guess. If participants failed to fixate initially, trials were marked and excluded from the staircase procedure (described below). FS, SFS, and CS task order was counterbalanced across participants.
In adaptive procedures, a stimulus parameter is manipulated until a desired performance level is attained. This is accomplished by adjusting the chosen stimulus parameter according to participant responses. The type of response (hit, miss, false alarm, or correct rejection) on one observation determines the direction of the adjustment (increment or decrement) for the next observation. Adjustment increments can be made progressively finer to more efficiently approach the desired performance level (Figure 4).
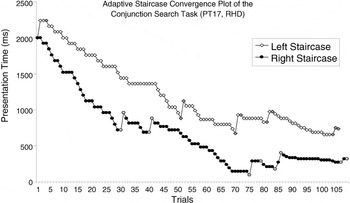
An example of a psychophysical staircase progression for the adaptive Conjunction Search task. Presentation time began at 2000 ms for both left (open white diamonds) and right (solid black circles) staircases. Points of inflection in the plots, that is, reversals, are indicated in gray. Each staircase ended after 10 reversals, and the threshold presentation times for target detection on the left and right sides were calculated from the average of the last eight reversal points.
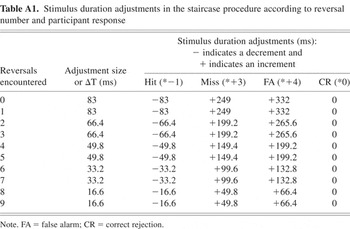
We adopted a yes–no adaptive procedure described by Kaernbach (1990). We manipulated stimulus duration to reach an adjusted accuracy rate of 75%. To accomplish this, the total adjustment to the stimulus duration was a function of the adjustment size (ΔT), response type and a set of ratios (determined based on the desired accuracy rate). Accordingly, stimulus duration was adjusted as follows: hits reduced it by 1 * ΔT, misses increased it by 3 * ΔT, false alarms increased it by 4 * ΔT, and correct rejections resulted in no change. Over the course of this procedure, adjustment size (ΔT) decreased after every two staircase reversals (reversals occur when stimulus parameter adjustments change from increments to decrements, or vice versa; gray points in Figure 4). The Appendix (Table A1) lists the adjustments according to response type and reversals encountered. Initial stimulus durations were 800 ms for FS and SFS, and 2000 ms for CS.
The adjustment size calculations are formally defined as ΔT = [6 − ([r + 1] − mod[(r + 1),2])/2] * 16.6, where ΔT = the (time) adjustment size in milliseconds, r = the number of reversals, and mod[(r + 1),2] is the modulus of (r + 1) by 2, that is, the remainder after dividing (r + 1) by 2. By design, initial adjustment size is made progressively finer: ΔT ranged from 83 ms (no reversals yet, early in the procedure) to ∼16.6 ms (after eight reversals, late in the procedure). As described above, based on the participant's response, the adjustment time was then multiplied by the corresponding ratio (hits *−1, misses *+3, false alarms *+4, and correct rejection *0).
Staircases terminated after 10 reversals, and a threshold presentation time (TPT) was calculated by averaging the stimulus durations over the final eight reversal points. Two separate TPTs were estimated: one from the adaptive staircase for left target detection, one from the adaptive staircase for right target detection. These two estimations occurred simultaneously because all trial types (left target-present, left target-absent, right target-present, right target-absent) were randomly interleaved and equiprobable until one staircase terminated (Figures 1, 2, and 3). Thereafter, displays from the completed staircase continued to be presented, including target-present and target-absent trials (each at a reduced probability of 0.1). These postconvergence data points were not included in the TPT calculation.
Search Scoring
Each adaptive search procedure output a left and a right TPT. To calculate lateralized FS scores (FSSs), SFS scores (SFSSs), and CS scores (CSSs), a difference score was obtained by subtracting left from right TPTs. A score of 0 revealed no lateralized difference. Positive scores resulted when right TPTs were longer, and negative scores resulted when left TPTs were longer.
Results
Mean deviations from 0 are reported, as are the distributions of signed scores. Each task was evaluated against 0 with one-sample t tests. We also tested for correlations between tasks.
A +3-ms FSS mean was obtained (SD = 11, range = −18–22). Eight participants scored 0, three required longer right presentations, and one required longer left presentations. The mean SFSS was −1 ms (SD = 2, range = −8–0). Of 11 participants (1 was excluded as an outlier: >3 SD from the mean), 10 scored 0 and 1 required longer left presentations. The mean CSS was −10 ms (SD = 117, range = −180–192). Of 11 participants (1 was excluded as an outlier), 7 required longer left durations and 4 required longer right durations.
None of the mean scores were significantly different from 0 (all t values ≤ 1.02). None were significantly different from one another (all t values ≤ 1.13), nor were any correlated (all p values > .25, Pearson; Figure 5).
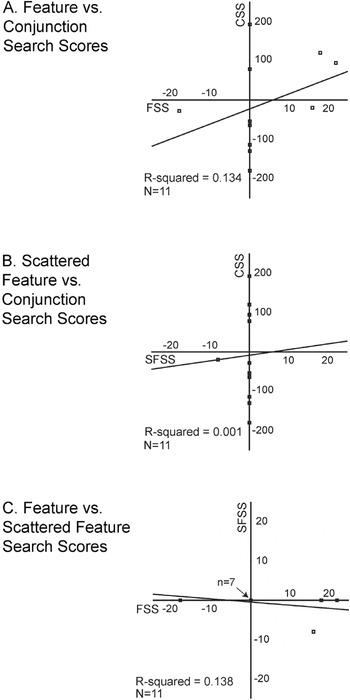
Scatter plots of healthy performance on the adaptive tasks: (A) Feature versus Conjunction Search, (B) Scattered Feature versus Conjunction Search, and (C) Feature versus Scattered Feature Search. Regression lines and R2 values are shown for each pair of measures. Negative scores indicate that left target detection required longer presentation times than right target detection; conversely, positive scores indicate that right target detection required longer presentation times than left target detection. Scores of 0 indicate no field differences in target detection. Note that the scales vary: for CS it spans ± 250, and for FS and SFS it spans ± 25. In plot C, 7 points overlap (with scores of 0 on both measures). FS = Feature Search; CS = Conjunction Search; SFS = Scattered Feature Search; FSS = FS scores; CSS = CS scores; SFSS = FS scores.
Discussion
As predicted, Experiment 1 demonstrated that performance was symmetric on all adaptive measures in healthy participants. Performance of healthy individuals provides a context in which patient performance (Experiments 2 and 3) can be evaluated.
EXPERIMENT 2
In Experiment 2, patients with unilateral brain injuries were tested on both traditional paper-and-pencil Standard Search (SS) tasks (Figure 6) and adaptive FS and CS tasks (Figures 1 and 3). We hypothesized that SS performance would positively correlate with adaptive CS performance, but not necessarily with adaptive FS performance. Furthermore, we expected patients to show contralesional search deficits and that these would be greater on the CS task than on the FS task.
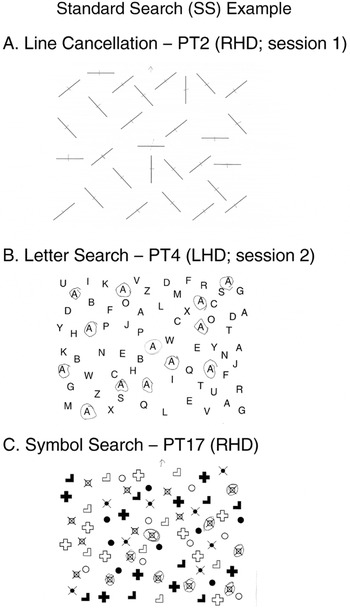
Three standard fixed-measure paper-and-pencil search tasks [adapted from the Standardized Comprehensive Assessment of Neglect (SCAN); McGlinchey-Berroth et al., 1996]. Each was presented on letter-sized paper, aligned with participant's midline such that items were evenly distributed on the left and right sides. The experimenter marked the central demonstration item before participants searched for the remaining lines in (A) the line cancellation task, the remaining target letter “A”s in (B) the letter search task, or the remaining target symbols (s) in (C) the symbol search task. As is shown, lines were “cancelled,” that is, marked with a pen stroke, whereas target letters and symbols were circled. Three different patients' performance is shown, and marked with the side of their lesion (RHD = right hemisphere damage; LHD = left hemisphere damage). Asymptomatic performance is illustrated in (A) the line cancellation task, that is, no lines were missed. Right-sided neglect (i.e., more right- than left-sided misses) is illustrated in (B) the letter search task. Note that the patient omitted one target on the right side, and three on the left side. This patient's score for the letter search task would be 2 (three contralesional misses minus one ipsilesional miss). Left-sided neglect (i.e., more than left- than right-sided misses) is illustrated in (C) the symbol search task. Note that the patient omitted six targets on the left side and two on the right side. This patient's score for the symbol search would be 4 (six contralesional misses minus two ipsilesional misses).
Methods
Participants
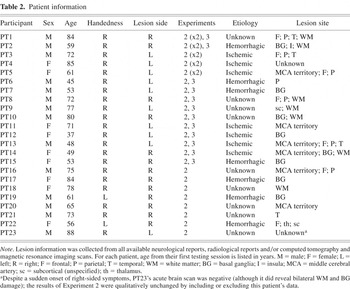
A total of 23 patients (9 women) provided informed consent before participating. Their ages spanned 37–88 years (mean = 66 years; SD = 14). Two were left-handed and all others were right-handed (Table 2). Participants were recruited on the basis of a unilateral lesion (13 right-sided). Those with a history of seizure disorder, dementia, or other neurological impairment were excluded from enrollment, as were those who had been substance abusers within the past 3 years, were legally blind, or required an interpreter. Remaining candidate patients were assessed for visual field deficits through confrontation testing, and those exhibiting homonymous hemianopsia or quadrantanopsia were not enrolled in this study.d
Note. Visual field confrontation testing required patients to fixate on the experimenter's nose from approximately arm's length. Patients closed or covered one eye at a time (or, if necessary, a patch was applied over one eye). The patient was then asked to indicate when they saw a finger enter their visual field. The experimenter probed each quadrant of the visual field separately, mid-distance between themselves and the patient by advancing their finger from the outside edge of the field toward the midline on an oblique trajectory. Experimenters used their own nasal and temporal fields to determine visual loss. Patients with hemianopsia or quadrantanopsia fail to see the finger until it nears midline.
Patient information
Standard Search Tasks
Stimuli
Black stimuli were presented on white letter-sized (8.5″ × 11″) pages, with half of the items on each side of the page (details below), and one central “demonstration” item.
Line Cancellation
A total of 29 lines were presented: 14 on each side of the page surrounding 1 central demonstration item (Figure 6A). Lines measured 35 mm with a 1-mm line-width and were presented at four possible orientations (vertical, horizontal, or ± 45°).
Letter Search
A total of 73 letters were presented: 36 on each side of the page, including 8 target letters (“A”s), and 1 central demonstration “A” (Figure 6B). Each letter measured 9 × 6.5 mm.
Symbol Search
A total of 73 symbols (Figure 6C) were presented: 36 on each side of the page, including 8 target symbols (

), and 1 central demonstration target symbol (

). Each symbol measured 8–15 mm2 (targets spanned 10 mm2).
Procedure
Participants completed the SS tasks in a fixed order: line cancellation, letter search, and symbol search (Figure 6; adapted from McGlinchey-Berroth et al., 1996), as is customary when administering assessment batteries (e.g., SCAN, BIT). Test materials were presented 60–70 cm in front of participants and were centered with their body midline. The experimenter marked the central demonstration item and then asked participants to find and similarly mark all like items. Specifically, for the line cancellation task, participants were asked to mark each line with a pen stroke, and to circle all target letters (“A”s) and target symbols (

) in the letter and symbol search tasks, respectively. Patients were to inform the experimenter when they were done (i.e., they were not under time pressure).
Adaptive Search Tasks
In Experiment 2, patients participated in two adaptive search tasks: FS and CS (described in Experiment 1). Because a version had been previously used with neglect patients (Brooks et al., 2005), we used the Feature Search (FS) task in the current experiment. Task order was partially counterbalanced. All TPTs were calculated as in Experiment 1. In the CS task, one participant viewed stimuli presented on a black background and, due to experimenter error, four CS sessions began with start times other than 2000 ms (600, 800, 1200, and 1500 ms). In two of the reported CS sessions, the procedure was terminated after 8 and 9 reversals (instead of the usual 10 reversals) due to technical difficulty. In those sessions, as with other TPT calculations, the final eight reversals were averaged to obtain the TPT.
Search Scoring
For each task, a single score was calculated to reflect the lateralized deficit. As before, performance was quantified as a difference score between left and right TPTs. Depending on each patient's lesion side, left and right TPTs were classified as either contralesional or ipsilesional. Ipsilesional TPTs were subtracted from contralesional TPTs. Each patient's ipsilesional performance thereby served as the control for contralesional performance. Therefore, greater contralesional than ipsilesional deficits resulted in positive scores [i.e., hemispatial neglect)e
Conversely, greater ipsilesional than contralesional deficits resulted in negative scores (see the General Discussion for more on this issue).
Note that those who have a deficit, but omit equal numbers of items bilaterally, are given a score of 0. This has the added benefit of eliminating some general confounds (e.g., arousal), and focusing the measure on lateralized impairments.
Standard Search Score (SSS)
For each SS task (line cancellation, letter and symbol search), the total number of items missed on the left and right sides were classified as contralesional or ipsilesional.g
All scores were blindly checked by a second experimenter. If a scoring discrepancy was found, a third experimenter determined thefinal score.
Adaptive Feature Search Score (FSS) and Conjunction Search Score (CSS)
Adaptive search procedures output left and right TPTs. Again, TPTs were classified as either contralesional or ipsilesional, and a difference score was calculated. Figure 4 shows the staircase progression for a patient with right hemisphere damage (RHD). For this patient, the left TPT (834 ms) is contralesional and the right TPT (390 ms) is ipsilesional, resulting in a CSS of 444 ms. There was no a priori maximum score range in the adaptive tasks.
Results
A total of 28 sessions were included in the analysis: 5 participants contributed 2 sessions, and 18 contributed 1 session.h
Five participants were tested at two different times post-stroke, and for these participants both sessions were entered into the analysis. The first adaptive session was conducted within 3–9 months post-stroke [mean = 167 days, range = 111–265 days], and the second adaptive session was conducted at least 1-year post-stroke [mean = 421 days, range = 367–512 days]). When the same analyses were run with a maximum of one session/participant, no differences appeared (in direction of means, differences from 0 or correlations). The effect of lesion side on CSSs and the difference between FSSs and CSSs were less robust statistically, but were present numerically.
Testing session times: age (years) and delays post-stroke (days) for each patient

SSSs were available from 27 sessions (1 was excluded as an outlier: >3 SDs from the mean). SSSs averaged to 1.11-item misses (SD = 1.34; range = −1.0–4.0), with a mode of 0 (no lateralized deficits in 10 sessions), and deviated from 0 [t(26) = 4.31, p < .001], indicating that contralesional deficits exceeded ipsilesional ones (Figure 7A). An independent-samples t test failed to reveal any differences between those with LHD or RHD (1.00 vs. 1.21, respectively; t value < 1.0).

Histograms of patient performance on (A) the fixed-measure Standard Search task, (B) the adaptive Feature Search task, and (C) the adaptive Conjunction Search task. In all plots, positive values indicate contralesional scores (i.e., hemispatial neglect), whereas negative values indicate ipsilesional scores. No differences between contralesional and ipsilesional target detection result in 0 scores. In each plot, data were sorted into 11 bins spanning: 1 item (A), 50 ms (B), and 500 ms (C). Data are shaded according to the patient's lesion side, as are mean scores (indicated by downward-pointing arrows). SSS = Standard Search score; FSS = Feature Search score; CSS = Conjunction Search score; RHD = right hemisphere damage; LHD = left hemisphere damage.
Adaptive FSSs were available from 23 sessions. In four sessions, the test was not conducted and one session was excluded as an outlier (>3 SDs from the mean). FSSs averaged 24 ms longer for contralesional than ipsilesional targets (SD = 60, range = −100–158, mode = 0; Figure 7B) and showed a trend to differ from 0 [t(22) = 1.93; p = .07]. An independent samples t test was run comparing those with LHD and RHD and revealed no difference in FS performance (32 ms vs. 17 ms, respectively; t value < 1.0).
Adaptive CSSs were available from 26 sessions (in 2 sessions, the test was not conducted). CSSs averaged 366 ms longer for contralesional than ipsilesional targets (SD = 630; range = −1026–2088; Figure 7C) and reliably differed from 0 [t(25) = 2.96; p < .01]. An independent samples t test showed that RHD resulted in greater contralesional CS deficits than LHD [589 ms vs. 106 ms, respectively: t(24) = 2.07; p < .05]. Exploring further, the CSSs for those with LHD was not different from 0 (t value < 1.0), whereas the CSSs for those with RHD was different from 0 [t(13) = 3.47; p < .005].
The 329-ms difference between FSSs and CSSs reached significance [t(20) = 2.47; p < .05]. Those with LHD performed equivalently in the two search tasks (t value < 1.0; n = 10), whereas those with RHD performed worse on the CS than FS task [t(10) = 2.83; p < .05].
We conducted bivariate Pearson correlations between Standard, Feature, and Conjunction SSs (Figure 8). Consistent with our initial hypothesis, the SSSs correlated with CSSs (r = 0.447; p < .05; n = 25), but not with FSSs (r = 0.255; p > .25; n = 22).i
The results were comparable, numerically and statistically, whether or not line cancellation performance was included in the SSS.

Scatter plots of patient performance on the Standard Search task versus performance on the adaptive (A) Feature and (B) Conjunction Search tasks. Positive values indicate contralesional scores (i.e., hemispatial neglect), whereas negative values indicate ipsilesional scores. No differences between contralesional and ipsilesional target detection result in 0 scores. Regression lines and R2 values are shown for each pair of measures. Patient lesion side is indicated by filled triangles for left hemisphere damage (LHD) and open circles for right hemisphere damage (RHD). Note that the y axis scales in (A) and (B) are different: spanning ± 250 and ±2500, respectively. In plot A, two LHD points overlap (with scores of 0 on both measures). SSS = Standard Search score; FSS = Feature Search score; CSS = Conjunction Search score.
To determine the influence of time since stroke on search performance, we conducted a median split on the basis of delay post-stroke (i.e., the 28 sessions were divided into early and late test groups: conducted within or after 384.5 days post-stroke, respectively). When this factor was entered into independent-samples t tests, SSSs did not reliably change with delay post-stroke [1.43 early vs. 0.77 late; t(25) = 1.29; p > .20], nor did CSSs (339 ms early vs. 393 ms late; t-value < 1.0). However, FSSs improved with delay post-stroke [49 ms early vs. 1 ms late; t(21) = 2.05; p = .053].
Two additional points bear mention. First, when patient scores are evaluated on the basis of whether they exceed healthy mean performance (by 1, 2, or 3 SDs), the adaptive measures clearly differentiate the two groups (Table 4). Second, using eight reversal points in the TPT calculation may have included “pre-asymptote” staircase points. However, when TPTs were recalculated on the basis of a mean of four reversals or a median of eight reversals, the results from the adaptive tasks were consistent regardless of the measure adopted (Table 5).
Count of patient performance from Experiment 2 falling outside healthy means (Experiment 1) by ± 1, 2 or 3 SDs

Experiment 2 results when calculating TPTs from means of eight or four reversals and medians of eight reversals

Discussion
Experiment 2 illustrates that both standard and adaptive procedures capture lateralized visual search deficits in the patient population tested (albeit only a trend in FS). Furthermore, comparing performance from Experiments 1 and 2 reveals an obvious differentiation between symmetric healthy performance and lateralized patient performance in the same adaptive tasks.
Adaptive procedures also revealed lateralized deficits not detected by SS tasks. Some patients who scored 0 on the SS tasks showed contralesional deficits in the adaptive search tasks (5 in FS and 7 in CS, of 10 patients scoring 0 on SS). Additionally, the results from the adaptive CS task corroborated an often-reported finding that RHD produces greater spatial attention deficits than LHD (e.g., Behrmann et al., 2004; Stone et al., 1993). Although suggestive, we cannot rule out the possibility that other group differences (e.g., anatomical differences in left vs. right lesion volume, extent, or location) might underlie the differences found in CS performance.
Two findings lend further credibility to the use of adaptive measures in neuropsychological investigations. First, even with patient participants, in whom performance can be noisy, the adaptive measures were impressively stable. Whether using the means of four or eight, or medians of eight staircase reversal points to calculate TPTs, statistical analyses were equivalent (Table 5). Second, performance in the adaptive visual search tasks was consistent with well-established fixed-measure findings in the neglect literature: CS tasks were more sensitive to lateralized deficits than were FS tasks (e.g., Behrmann et al., 2004; Eglin et al., 1991; Esterman et al., 2000). Nevertheless, to increase confidence in this conclusion, we ran another experiment matching the stimulus configuration of the feature and conjunction displays. Thus, in Experiment 3, FS was replaced with Scattered Feature Search (SFS).
EXPERIMENT 3
Twelve patients returned for an adaptive testing session in which they performed the SFS task and a repeat CS task. In the SFS task, the stimuli were spatially distributed in the same manner as in the CS task (as described in Experiment 1). The SFS and CS tasks were also matched in target-to-distracter ratio, and target shape, color, and size (Figures 2 and 3). Experiment 3 also presented the opportunity to compare patients' CSSs across two sessions (the original session reported in Experiment 2 and this repeat session collected as part of Experiment 3).
Methods
Participants
A total of 12 right-handed patients (4 women) participated. Their mean age at the time of testing was 63 years (range = 38–85 years). The mean delay between testing sessions was 385 days (SD = 230; range = 141–1000 days; Table 3), during which time none had experienced intervening neurological events. Six had unilateral LHD and six had unilateral RHD.
Stimuli and procedure
Eleven patients were tested on both the SFS and CS tasks, and testing order was counterbalanced. One patient only contributed data on the SFS task. The tasks were administered and scored as in the previous Experiments.
Results
The mean SFSS was +9 ms (SD = 42; range = −24–128) and was not reliably different from 0 (t value < 1.00). One session was excluded as an outlier (>3 SDs from the mean). Six patients scored 0, three had ipsilesional scores, and two had contralesional scores.
The mean CSSs deviated contralesionally by 430 ms (SD = 551; range = −62–1862), with 9 of 11 patients showing a contralesional deficit. The CSS was reliably different from 0 [t(10) = 2.59; p < .05].
In the 10 patients with both SFS and CS scores, the CSSs differed from the SFSSs by 276 ms [t(9) = 2.85; p < .02], indicating a greater contralesional impairment in CS than in SFS, when stimuli were closely matched across search tasks. As before, this performance dissociation was supported by the lack of a correlation (r = −0.217; p > .50).
Lastly, we compared CSSs across sessions in the 10 patients with two CSSs. The CSSs from session 1 (mean = 583 days post-stroke; range = 38–1250) were compared with CSSs from session 2 (mean = 969 days post-stroke; range = 373–1648). Session 1's CSS mean was 536 ms (SD = 794; range = −200–2088), tending to differ from 0 [t(9) = 2.14; p = .06] and session 2's CSS mean was 476 ms (SD = 558, range = −62–1862), which reliably differed from 0 [t(9) = 2.70; p < .05]. Although it appears that CS performance improved, this was not statistically borne out (t value < 1.00), nor were the scores correlated (one-way intraclass correlation: single measures = 0.488; average measures = 0.656; Figure 9). Participants showed different patterns across testing sessions: Half improved and half worsened.
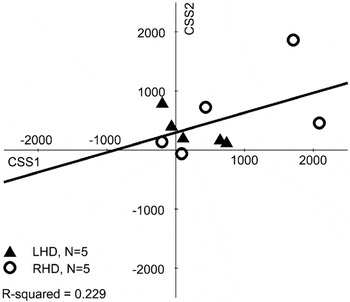
Scatter plots of patient performance on the Conjunction Search task at two different delays post-stroke (on average, with ∼1-year delay). Positive values indicate contralesional scores (i.e., hemispatial neglect), whereas negative values indicate ipsilesional scores. No differences between contralesional and ipsilesional target detection result in 0 scores. The regression line and R2 value is shown. Patient lesion side is indicated by filled triangles for left hemisphere damage (LHD) and open circles for right hemisphere damage (RHD).
Discussion
As in Experiment 2, contralesional targets defined by conjunctions of two features were reliably more difficult to detect than contralesional targets defined by only one feature. Because display configuration was matched across search tasks in Experiment 3, we can more confidently claim that the present adaptive results converge with previous fixed-measure studies dissociating feature from conjunction search performance in patients with unilateral brain injury.
Although statistically ambiguous, the test–retest sessions revealed comparable performance: The CSSs were contralesionally deviated in both sessions (with some reduction in variability at second testing). There is insufficient data to examine all variables that may have influenced test–retest outcomes (e.g., practice, aging). However, the potential benefits of practice or spontaneous recovery were insufficient to reliably ameliorate the patients' performance, at least as a group. Adaptive measures may yet prove useful in characterizing recovery of function, when initial testing sessions are carried out during more acute stages (the majority of the patients reported in Experiment 3 were in chronic stages for both testing sessions) or when interventions or treatments are applied between testing sessions.
GENERAL DISCUSSION
In an effort to provide a focused contribution to the growing use of computerized testing in the classification and quantification of common neuropsychological syndromes and their component deficits, the current investigation evaluated adaptive visual search tasks as a tool for detecting lateralized visual deficits in patients with unilateral brain injury. We used feature and conjunction search tasks in our adaptive procedures because they have been well-studied, in both healthy and neuropsychological populations (for reviews, see Robertson, 2004; Robertson & Schendel, 2000). By minimizing response demands, we aimed to isolate visual deficits. We compared the adaptive computerized procedure outcomes with fixed-measure outcomes from a standard hemispatial neglect search test.
The adaptive procedures were successful in detecting lateralized deficits in patient performance. Patient performance also varied by task, as we had predicted: Greater contralesional deficits were present in conjunction search (CS) performance than in either adaptive feature search task (FS or SFS). Adaptive CS performance also distinguished between those with LHD and RHD, corroborating research reporting greater spatial attention deficits after RHD than after LHD. Interestingly, this differentiation in patient performance was found in the adaptive CS task, but not in the Standard Search (SS) task, establishing the sensitivity of this adaptive technique. Notably, lateralized biases were not present in healthy individuals on any measure (Experiment 1).
One point of curiosity was the presence of ipsilesional scores (on standard and adaptive tasks).Various possible explanations for these exist. Ipsilesional scores may reflect noise in the measure and/or in the participants' performance (e.g., arousal changes, environmental distractions). Or, perhaps a true ipsilesional deficit emerged. Patients may develop compensatory strategies encouraging contralesional hyperattention (e.g., “look left”), which could induce impaired ipsilesional performance. Alternatively, Butter and colleagues (1988) described a neglect patient, who in the chronic stage demonstrated a strong contralesional visual grasp reflex.j
We thank Stephen Nadeau for drawing our attention to this literature.
In summary, we implemented adaptive procedures to measure lateralized visual search deficits present in hemispatial neglect. Here, adaptive outcomes were successful in detecting lateralized visual deficits, and corroborated previous fixed-measure findings showing that contralesional CS was more impaired than FS in patients with unilateral brain injury. Furthermore, RHD was shown to be more detrimental than LHD for conjunction search, but this dissociation was only revealed by the adaptive measure, and not by the standard search measures used. We, therefore, propose that adopting adaptive tools to test for component deficits in other neuropsychological syndromes may be more broadly beneficial.
Practically speaking, adaptive tests were quick to administer (5–20 min each). Contrary to fixed-measure studies, an exceptionally important asset of the adaptive procedure is its fast and effortless flexibility to adjust to individual patients' level of performance (between individuals or at varying stages of recovery). Because the procedure is adaptive and scales the chosen experimental parameter (here, stimulus duration) according to the participant's responses, patients with arousal difficulties, as well as those seemingly unaffected by their stroke, can be tested at their individual level of performance. Given the wide range of individual differences in deficits among patients with visual hemispatial neglect, and in stroke patients more generally, an adaptive procedure is an elegant way to minimize testing duration while obtaining meaningful data.
ACKNOWLEDGMENTS
The research in this report was supported by NIH grant MH62331 and a VA Merit Grant Award to L.C.R. A.L. received funding from F31 NS047836, A.V.F. and J.L.B. received funding from T32 MH62997, and T.M.V. was funded by a VA Merit Grant Award (98-11-00065). We acknowledge the generosity of the patients who volunteered their time participating in this research project. We also thank Lauren Friedman, Alice Albrecht, Mitchell Liverant, David Zlotnick, Linh Dang, and Joseph Degutis for the time they dedicated to this project. We are also thankful for referrals and recruitment help from Dr. Jack Fahy and Dr. James Muir.
APPENDIX
Table A1: Stimulus duration adjustments in the staircase procedure according to reversal number and participant response