


1 Introduction
The role of pensions in providing adequate means of living is gaining in importance in ageing societies. Pension income, in turn, depends very much on persons’ long-term economic status. Gender and socioeconomic differences in pension income are prevalent reflecting the group differences in the employment records: women's lower and intermittent involvement with paid labour and lower social classes’ higher unemployment risk and modest earnings. Recent pension reforms, particularly the strengthened link between lifetime earnings and benefits, have raised concern about increasing gender and class differences (e.g. Whitehouse and Zaidi, Reference Whitehouse and Zaidi2008; Frericks et al., Reference Frericks, Knijn and Maier2009; Horstmann and Hüllsman, Reference Horstmann and Hüllsman2009; Bettio et al., Reference Bettio, Tinios and Betti2013). Increased evidence on longevity and social differences in life expectancy and their implications for redistributive outcomes of pension policy have further fostered discussion on social class differences (see e.g., Whitehouse and Zaidi, Reference Whitehouse and Zaidi2008).
While the income position in old age may generally reflect the accumulating life chances over the life course, the pension income is also determined by pension schemes and its rules, which translate the individual biography into a certain pension income (e.g. Leitner, Reference Leitner2001; Arza, Reference Arza, Arza and Kohli2008). The welfare state is a system of stratification (Esping-Andersen, Reference Esping-Andersen1990: 23) and pension benefits do not make an exception to this. However, pension systems within and between countries differ substantially in the degree to which retirement benefits are linked to earnings (Whitehouse and Zaidi, Reference Whitehouse and Zaidi2008; Storelli and Williamson, Reference Storelli, Williamson, Formosa and Higgs2015). Some systems reproduce more the original inequalities created by the labour market and reinforce effect on the existing socioeconomic and gender differences, while others compensate for unstable or non-standard biographies, cushioning and moderating differences and equalizing retirement income. Pension systems that combine easily accessible occupational pensions and offer earnings-related benefits to all economically active individuals in addition to basic pension seem to best protect against old-age poverty (Korpi and Palme, Reference Korpi and Palme1998). They also seem to be best equipped to encounter the negative consequences of the de-standardization of employment histories (Möhring, Reference Möhring2015).
Past years have witnessed a growing number of empirical studies exploring the individual determinants of the income position in later life in different pension systems. Studies that utilize longitudinal surveys show a significant association between the number of years in employment and pension income (Sefton et al., Reference Sefton, Evandrou, Falkingham and Vlachantoni2011; Dewilde, Reference Dewilde2012; Fasang et al., Reference Fasang, Aisenbrey and Schömann2013; Möhring, Reference Möhring2015). Expectedly, they discover that women's work histories are shorter than men's (Sefton et al., Reference Sefton, Evandrou, Falkingham and Vlachantoni2011; Dewilde, Reference Dewilde2012; Bettio et al., Reference Bettio, Tinios and Betti2013) and find notable gender gap in pension income (Bettio et al., Reference Bettio, Tinios and Betti2013). Consequently, the income position in old age is driven by the strong link of educational level and occupational status (Dewilde, Reference Dewilde2012; Fasang et al., Reference Fasang, Aisenbrey and Schömann2013; Möhring, Reference Möhring2015).
Empirical evidence on the relationship between individual lifetime work histories and level of income received in the old-age has been limited, though, making it difficult to quantify how, exactly, gender and socioeconomic differences in employment records contribute to the respective inequalities in pension income. More specifically, empirical studies available so far face the challenge of how to reliably measure the individual work histories spanning over several decades. Typically, studies looking at pension income and the length of working life have utilized survey data, such as SHARELIFE, where information is self-reported, often retrospective life-history information (e.g. Lodovici et al., Reference Lodovici, Crepaldi, Corsi and Naaf2011; Sefton et al., Reference Sefton, Evandrou, Falkingham and Vlachantoni2011; Dewilde, Reference Dewilde2012; Bettio et al., Reference Bettio, Tinios and Betti2013; Fasang et al., Reference Fasang, Aisenbrey and Schömann2013; Möhring, Reference Möhring2015). Self-reported measures, particularly retrospective ones, are vulnerable to vast errors and hence lack reliability. Moreover, the sample sizes tend to be rather small in this kind of datasets.Footnote 1
In this study, we analyze gender and socioeconomic differences in the length of working lives and pension income in Finland, how these are related to each other and how the pension system cushions inequalities in pension income. While there is quite much literature on gender differences, socioeconomic differences in late-life are less studied or focus on health and mortality (e.g. Stirbu et al., Reference Stirbu, Kunst, Bopp, Leinsalu, Regidor, Esnaola, Costa, Martikainen, Borrell, Deboosere, Kalediene, Rychtarikova, Artnik and Mackenbach2010; Gallo et al., Reference Gallo, Mackenbach, Ezzati, Menvielle, Kunst and Rohrmann2012). By analyzing how pension income is related to the length of working life in one recent Finnish retiree cohort (those receiving old-age pension first time in 2011, N = 64,993), we aim at gaining a better understanding of the interaction between pension system, working life length and incomes in later life in different socioeconomic and gender groups. We utilize internationally unique register data covering 50 years of recorded and detailed information derived from the national and employee pension institutions in Finland on individual employment histories as well as pension income on the first full year on an old-age pension. This way, we are able to trace lifetime work histories and pension incomes in a much greater detail and precision than has been possible so far with survey data.
The Finnish case is particularly interesting since, by international standards, Finland is a very gender-equal society. For example, the labour force participation of Finnish women is very high, and unlike in many countries, women are not secondary earners, i.e., there is a dual-breadwinner system. As much as 74% of 15–64-year old women participate in the labour force, while the respective figure for men is 77%. Women have accounted for 47–48% of the total workforce at least since the beginning of the 1980s. Moreover, Finnish women tend to be even better educated than men. (See e.g., Statistics Finland, 2016). In addition, Finland has well-developed work-family reconciliation policies, i.e., the society in many ways encourages mothers’ and married women's employment. For example, spouses have separate taxation and high-quality public day-care is provided.
Nevertheless, women and men are in very different positions in the labour market: women's wages are lower (around 80% of men's wages), and they more often work part-time and have fixed-term contracts. This being said, by international comparison relatively little part-time work is done in Finland (Drange and Egeland, Reference Drange and Egeland2014). Part of the wage difference results from fairly strong occupational segregation. In fact, Finland, along with other Nordic countries, UK and Ireland is among the most occupationally segregated countries in Europe (see Dijkstra, Reference Dijkstra, Dijkstra and Plantenga1997). This results in the different socioeconomic composition of female and male workers; lower non-manual occupations are female dominated, while the opposite is true for manual and upper non-manual employees.
These gender-related characteristics of the Finnish labour market offer a particularly interesting opportunity to examine how socioeconomic and gender differences in employment translate into pension income inequalities in the Finnish pension system with its comprehensive earnings-related pension scheme and how inequalities in earnings-related pension income are compensated by the national non-contributory pension scheme. In contrast to many other countries, in which earnings-related and occupational pension schemes often leave work typical for women and low wage occupations uncovered (Ginn and Arber, Reference Ginn and Arber1999; Gruber and Wise, Reference Gruber and Wise2004), the Finnish statutory earnings-related employment pension covers almost all earnings with a uniform benefits and conditions of receiving benefits. Additionally, the residence-based national pension scheme ensures basic income security for those with no or only limited earning-related pension accrual. The Finnish case thus provides valuable insights into what extent pension system design is needed to cushion (mainly gender-related) pension income differences and inequalities based on working lives in a very gender equal society.
The paper proceeds as follows: In section 2, a brief description of the Finnish pension system and how working history and earnings are translated into pension income is offered. Section 3 describes the data and the variables used. The empirical findings are presented in two steps in section 4. First, differences in the length of working life by gender and socioeconomic and then the differences in the level of pension income (both earnings-related pensions alone and all pension income) are reported. Second, the cushioning role of the non-contributory national pension in labour market-related pension income is examined by looking at the relationship of pension income with and without the national pension component across different lengths of working life by gender and socioeconomic group. Section 5 concludes by discussing challenges of equal income in old age and the role of pension system therein in the reflection of our findings.
2 The Finnish pension system
The Finnish statutory pension system (1st pillar) consists of the employment-based earnings-related pension, a residence-based national pension and a guarantee pension. The national and guarantee pensions aim at ensuring a basic income security and giving protection against old age poverty, while the tasks of employment-related pensions are at income smoothing, and to a reasonable degree, maintaining the income level achieved during the working career. The earnings-related pension security covers those in gainful employment, including the self-employed. The earnings-related pension includes both private- and public sector pensions, which after the reforms in the 1990s and 2005 provide virtually identical benefits and conditions of receiving benefits. The national and guarantee pension cover everyone living in Finland with the certain requirements for residence. The national non-contributory pension system plays nowadays a smaller role, although its role in providing basic security is important. Since the earnings-related employment pension scheme covers practically all types of employment with no upper limit on pensionable earnings or pensions, the role of second pillar employer-specific occupational pensions or third pillar provision based on individual private pension insurance, is very modest in Finland (Kangas and Luna, Reference Kangas, Luna and Ebbinghaus2011; Barr, Reference Barr2013).
The earnings-related pension and national pension have complemented each other since the start of the earnings-related pension scheme. The amount of earnings-related pension affects the national pension.Footnote 2 The amount of national pension gradually decreases as the amount of earnings-related pension grows. Pensioners whose earnings-related pension is more than €1,257.96 a month (in 2012) are not entitled any more to national or guarantee pension. If the earnings-related pension is low due to a brief or split working career, the national pension complements the income of the pensioner. The full national pension is granted on the basis of 40 years of residence in Finland. The national pension is supplemented by a guaranteed pension that is payable in full for those pensioners whose only income consists of the national pension. The guarantee pension was introduced in 2011, establishing a minimum level of pension income that people receive (€713.73 per month in 2012).Footnote 3 Any pension income diminishes the guarantee pension share in full. Figure 1 presents the composition of pension benefits at different levels of income.

Figure 1. Composition of pension benefits at different levels of income in 2012.
While incremental reforms of the Finnish pension system have taken place since the 1990s like in a vast majority of industrial countries (Hinrichs and Kangas, Reference Hinrichs and Kangas2003, Kangas et al., Reference Kangas, Lundberg and Ploug2010), a major earning-related reform to date was implemented in 2005 which also had wide-ranging consequences for the importance of the length of working life for benefit calculation. For one, the benefit formula was changed. According to the 2005 pension act, the pension is calculated on the basis of the entire working career between the ages of 18 and 67 years. The change introduced a tighter link between earnings paid and benefits receivedFootnote 4. Prior to 2005, employment between 23 and 64 and the earnings of the last 10 years were taken into account separately for each contract of employmentFootnote 5. The reform was seen as an important step to reduce inequalities, as the length of employment contracts no longer determined the pension income.
Second, in the new scheme, the accrual rate was age-dependent and progressive. The ‘super’ accrual rate of 4.5% was set up as an incentive to encourage the postponement of retirement. The age-based accrual rates were seen to benefit those with a patchy working career (Tuominen, Reference Tuominen2004). A higher accrual rate at an older age can benefit women, who often have a shorter working career, but also other groups with typically higher earnings at later stages of their careers (Lodovici et al., Reference Lodovici, Crepaldi, Corsi and Naaf2011: 101). The Act of 2005 stipulated also the life expectancy coefficientFootnote 6. Finally, the reform introduced a flexible retirement age (63–68 years of age) in the earning-related pensionFootnote 7. This way, the 2005 reform redefined the way in which the length of working life and life-time earnings are translated into pension income.
3 Data and research design
3.1 Data
The analysis focuses on persons who started receiving an old-age pension in 2011 in Finland and is based on individual level register data including the whole population. Information on individual employment history, retirement and pension income is derived from administrative registers owned by employee pension institutions and the Social Insurance Institution of Finland (Kela). Occupational data are collected by Statistics Finland from several different sources, such as the registers of employment relationships, statistics on wages and salaries, and from enterprises.
Our analysis focuses on persons who received Finnish earnings-related pension with or without a complementing national pension. The final data set includes 64,993 persons. Our sample was restricted to Finnish citizens resident in Finland, whose entire employment history took place in Finland. Excluded were persons who got any amount of pension from some other country, whose occupational status could not be identifiedFootnote 8, or who died between 2011 (the year of retirement to old-age pension) and 2012 (the year of measurement of monthly pension income). Furthermore, persons whose only pension income was non-contributory national pension were excluded from analysis. This is justified, as the idea of the study is to examine the relationship between earnings-related pension income and the length of working life, and how national pension cushions the resulting gender and socioeconomic differences.
The data set is unique in its comprehensiveness in several different ways: based on administrative registers on insured employment and pension entitlements it contains no memory flaws on retrospective employment data or on the level of pension income and no attrition except due to death. Data cover practically all paid work because earnings-related pension insurance has been obligatory from the beginning and earnings threshold is low.Footnote 9 Contrary to many other countries, where administration of pension entitlements is completely decentralized to independent pension insurance providers, the administrative data are comprehensively pooled in Finland and managed by a joint provider of pension insurance information systems ensuring a full coverage of data on all insured persons. The analysis, therefore, presents a full population data on persons retired to earnings related old-age pension first time in 2011, with the restrictions described above.
3.2 Variables
Retirement to old-age pension is based on receiving a statutory old-age pension for the first time. The reference year is 2011. A person may have received another type of pension (disability pension, unemployment pension etc.) before retirement to the old-age pension. In fact, only 53% retired directly from work to old-age pension, the rest were unemployed or on some other pension before old-age retirement. We take these spells as a part of the (shortened) working life and, therefore, want to focus on the moment when the actual old-age retirement begins. The mean age of old-age retirement in the final data set was 63.6 years with a standard deviation of 1.6 years. Deviation in the age of retirement occurs in part because of the general flexible old-age retirement age between 63 and 68 years of age, in part because lower old-age retirement applies to certain professions through the transitional period, and also because the unemployed and those who took early old-age pension were entitled to old-age retirement already at the age of 62.
Observed length of working life is obtained from the pension accrual register. It refers to the time a person has been covered by the statutory earning-related pension as employee, self-employed or self-employed farmer. The length of working life per person is measured starting from the implementation of earnings-related pensions scheme in 1962, and may cover up to 50 years of working life. Full-time and part-time work add to the length of working life equally as these cannot be separated on the basis of registers.
The measure aims at capturing the time spent in paid work. However, periods of unpaid leave are also included in the length of working life under a valid employment contract. In general, prior to the year 2005, an unpaid leave for less than a year and under a valid employment contract added to the length of working life and it also accrued pension entitlements as if the person had been working. Since 2005, all unpaid leave under a valid employment contract is included in the length of working life irrespective of the length of the leave. Table 1 summarizes how various forms of income and unpaid leave are treated in the calculation of the observed length of working life.
Table 1. Periods of paid/unpaid leave in the calculation of the observed length of working life

Pension income refers to the person's gross monthly pension. It is measured in the first full year in old-age pension, 2012. Survivor's pension is not included, because our focus is on independently accumulated retirement income. In this study, the total pension income is divided into two components: earnings-related pension income and non-contributory national pension income. These are separate pension benefits that are coordinated in a way that reduces the non-contributory national pension income as the level of earnings-related pension increases (Figure 1).
The socioeconomic group is defined on the basis of a person's occupationFootnote 10 and the type of earnings-related pension insuranceFootnote 11 he or she was covered by, and refers to the most recent paid work the person had. Social class includes five categories: upper non-manual, lower non-manual, and manual employees, self-employed, and farmers. If the information was missing, it was obtained from the previous years back to the year 1995. Therefore, we were able to define a social class on the basis of the previous occupation also for those who were unemployed or outside the labour force before they retired to the old-age pension.
4 Empirical findings
4.1 Differences in the observed length of working lives
We begin our analysis by describing the average length and the variation in the length of the working life. An overview of the observed lengths of working lives for both men and women and for five social classes is presented in Table 2. As can be seen, the mean and median values vary. In the following, we focus on the median value, because the distribution is skewed to the right. The results show that half of those who started receiving old age pension in 2011 had worked at least 37.6 years.
Table 2. Observed length of working life for persons receiving an old-age pension for the first time in 2011, by gender and socioeconomic group (n = 64,993)

Source: Authors’ calculations based on register data by the Finnish Centre for Pensions.
The average length of the working life varies according to gender and social class. The unequal distribution of men and women to social classes is reflected in the differences. Lower non-manual employees account for nearly 40% of all recent retirees, followed by manual employees (34%), upper non-manual employees (16%), self-employed (8%) and farmers (4%). There is also a strong occupational gender segregation, typical of Nordic countries (see e.g., Dijkstra, Reference Dijkstra, Dijkstra and Plantenga1997), indicated in the data with women over-represented in lower non-manual (70%) social class, and men over-represented in manual (61%) and upper non-manual (57%) social classes, as well as among farmers (65%) and self-employed (65%).
The gender difference in the length of working life is approximately 2 years. The difference is very small in international comparison, as the length of working lives for the Finnish women are much longer than in most European countries (cf. Vogler-Ludwig, Reference Vogler-Ludwig2009; Sefton et al., Reference Sefton, Evandrou, Falkingham and Vlachantoni2011; Bettio et al., Reference Bettio, Tinios and Betti2013: 55). Female employment is high in Finland. The Nordic welfare state is described as women-friendly; the provision of social services prominently in the area of care for children and the elderly has facilitated the entry of women into the labour market (e.g., Huber and Stephens, Reference Huber and Stephens2000). Single mothers feature high employment rate as well (e.g., Kilkey and Bradshaw, Reference Kilkey, Bradshaw and Sainsbury1999). It is, however, noteworthy to bear in mind that the working biographies of those women and men who started to receive old-age pension first time in 2011 have taken shape over the past four decades, in which the differences in men's and women's employment were more apparent than today.Footnote 12 Another important reason for the small difference is that prior to 2005, parental leave was registered as normal employment if the person returned to the same employment relationship within 1 year. Despite potential career breaks for caring responsibilities, parental leave periods, therefore, did not necessarily cause breaks in the accumulation of pension rights. Women's role as primary carers is identified as one of the most important reasons for women's shorter working lives and lower incomes (e.g. Ginn and Arber, Reference Ginn and Arber1999) and presumably, despite above described practice, career breaks for caring responsibilities explain the 2-year gender difference also in Finland to a great extent.
Furthermore, there are differences in the length of working lives between social classes, but the differences are modest. In fact, the socioeconomic differences are smaller than gender differences. The socioeconomic differences in the length of working lives are also less apparent than previously estimated based on working life expectancies (Järnefelt and Nurminen, Reference Järnefelt, Nurminen, Järnefelt, Kautto, Nurminen and Salonen2013). Self-employed and self-employed farmers have the longest working lives. Of the employees, the working lives of the upper non-manual are the longest. However, the differences are very modest between paid employees. The median length of the working life of manual employees is only 0.4 years shorter and lower non-manual employees 0.3 years shorter than of upper non-manual employees.
The similar lengths of working lives of manual employees and upper non-manual employees are plausible when taking into consideration the difference in the timing of their life-course events. For upper non-manual employees the longer time spent in education decreases their time spent in working life, whereas a higher risk of disability and unemployment shortens manual employees’ time in work life (Leinonen et al., Reference Leinonen, Martikainen and Lahelma2012; Polvinen et al., Reference Polvinen, Gould, Lahelma and Martikainen2013). Among upper non-manual employees more stable labour market situation, better health, and the possibilities to continue working until the retirement age have prolonged their working lives. Manual employees’ working lives have started earlier, which has contributed to the length of working life.
Table 2 also reveals that socioeconomic differences are smaller among men than women. Women's working lives are more heterogeneous than men's (see also Dewilde, Reference Dewilde2012; Bettio et al., Reference Bettio, Tinios and Betti2013; Möhring, Reference Möhring2015). For women, the differences in the length between those having the longest (self-employed and farmers) and the lowest (manual employees) working lives is 2.9 years, while the difference between male self-employee and the lower non-manual employee is 2.7 years. Noticeable is the length of the working lives of manual employee women. In relation to other female employees, their higher risk of disability pension and unemployment shortens their working lives. At the same time, the standard deviation is highest in this group because of the above mentioned. Altogether, the results imply that risk factors relating on one hand to class and on the other hand to womanhood accumulate for female manual employees.
4.2 Differences in monthly pension income
In a next step, we move on to examining gender and socioeconomic differences in pension income. Monthly levels of pension income are displayed by gender and social class in Figure 2. Pension income refers here to the total amount of pensions in one's own right. Depending on one's employment history pension income may consist only of earning-related pensions, or earning-related pensions and national pensions, or only of national pension in a case one has no work history. Here the focus in on the two first mentioned groups.

Figure 2. Total monthly pension income of those receiving earnings-related pension in 2012 by gender and socioeconomic group.
When turning to pension levels, gender and socioeconomic differences are apparent. On average, the level of women's pension is roughly one quarter lower than that of men's (Figure 2). The difference is large considering the modest deviations in the length of working life between men and women (as shown above) and that Finland presented high rates of women's full-time employment already in 1960s and 1970s (Drange and Egeland, Reference Drange and Egeland2014: 29–30). The explanation is likely found in wage differentials. Due to the fact that wages and labour markets are gendered, (earnings-related) pensions are per se gendered. Moreover, the gender pension gap tends to be wider than the earnings gap (Tinios et al., Reference Tinios, Bettio and Betti2015).Footnote 13
Different career profiles of men and women are also reflected in the composition of social classes. The divergence between males and females varies according to the socioeconomic group: the difference in the level of personal pension income is greatest for manual and upper non-manual employees and smallest for farmers. Note, however, that group sizes vary considerably.
Despite the inequality between men and women, socioeconomic differences surpass gender differences. Upper non-manual employees’ personal pension income is the highest and of classes the only one whose level exceeds the overall average amount. At the other end of the spectrum are farmers, who have the lowest pension income level. To be more concrete, the upper non-manuals’ pension income is 2.4 times higher than that of farmers. This holds true when inspecting both genders separately, even though socioeconomic differences in pension income are somewhat greater for men than for women.
Besides variation in the level of pension income, there are differences in the structure of pension income. Table 3 shows the share and the level of pension income for those receiving only earnings-related pension. It appears that women are less likely to be in receipt of a solely earning-related pension. In Finland, due to the very comprehensive nature of the Finnish earnings-related pension, women's lower share is not because women would not meet contributory requirements as it is the case in some countries, but more because of women's shorter working career and lower earnings. Of men, 85% receive only earning-related pension, while the proportion is 70% for women. This means that women receive more frequently national pension. Nearly every third woman receives also national pension and of men every seventh.Footnote 14 From this point of view, the national pension is particularly relevant for women. Gender difference in the earnings-related pension is the highest for non-manual workers reflecting habitually earnings differences; gender wage gap is wider in the upper-income brackets and classes (Bettio et al., Reference Bettio, Tinios and Betti2013).
Table 3. Monthly pension income of those receiving only earnings-related pension in 2012 by gender and socioeconomic group

Source: Authors’ calculations based on register data by the Finnish Centre for Pensions.
The structure of pension income also varies according to social class. The earnings-related pension is the primary source of pension income for a majority of upper non-manual employees, 95% receive earnings-related pension only, and just a small minority receive a national pension. For other socioeconomic groups, earnings-related pensions play a less dominant role although the proportion of lower non-manual and manual employees as well as of self-employed receiving only earnings-related pension is still high, around three quarters. This indicates that the overreaching majority of employees is covered by earnings-related pension irrespective of the social class. The high share of retirees receiving only earnings-related pensions thus reveals the dominant role of earnings-related pensions in the Finnish pension scheme.
If we look at those who receive both national and earnings-related pension, gender or socioeconomic differences in pension income are mainly small (Figure 3). In this group, national pension represents about 20% of monthly pension income. In this respect, national pension appears to make a significant contribution to compensating the inequalities with regard to retirement income. On the other hand, it should be noted that pension income level of those receiving also national pension is fairly low, and the majority of recipients are women.

Figure 3. Monthly pension income of those receiving both national and earnings-related pension in 2012.
Differences observed in pension income can mainly be explained by differences in working life lengths and earnings levels. Every year in employment increases accrued pension rights through a certain earnings-based accrual rate. One of the strongest advantage of our data is that we have detailed information on the length of working life, which is a central factor affecting the level of the final pension benefit. We also know the exact amount of monthly pension benefit. Moreover, part of the earnings differences can be captured by inspecting different social classes separately (see Storelli and Williamson, Reference Storelli, Williamson, Formosa and Higgs2015). Therefore, we will next analyze to what extent the level of earning-related pension depends on the number of years spent on paid work, and how much each additional year in employment increases the pension income for men and women and for different social classes.
4.3 The relationship between pension income and the length of working life
The bivariate relationships between the length of working life and pension income are presented in Figure 4 per social class and for both men and women. Pension income is measured by total pension income, which consists of earnings-related pension income and non-contributory national pension income (gray shadowed dots). In addition, earnings-related part of pension income is presented separately (black dots). This makes it easier to understand the role of non-contributory national pension income in securing a sustainable level of total pension income. The solid line represents the bivariate regression slope of earnings-related pensions and working life length in each social class and gender, and the dashed line indicates the linear fit of total pension income and working life length, respectively. In other words, each line presents a group-specific regression model with working-life length as the independent variable and the logarithm of pension income as the dependent variable.
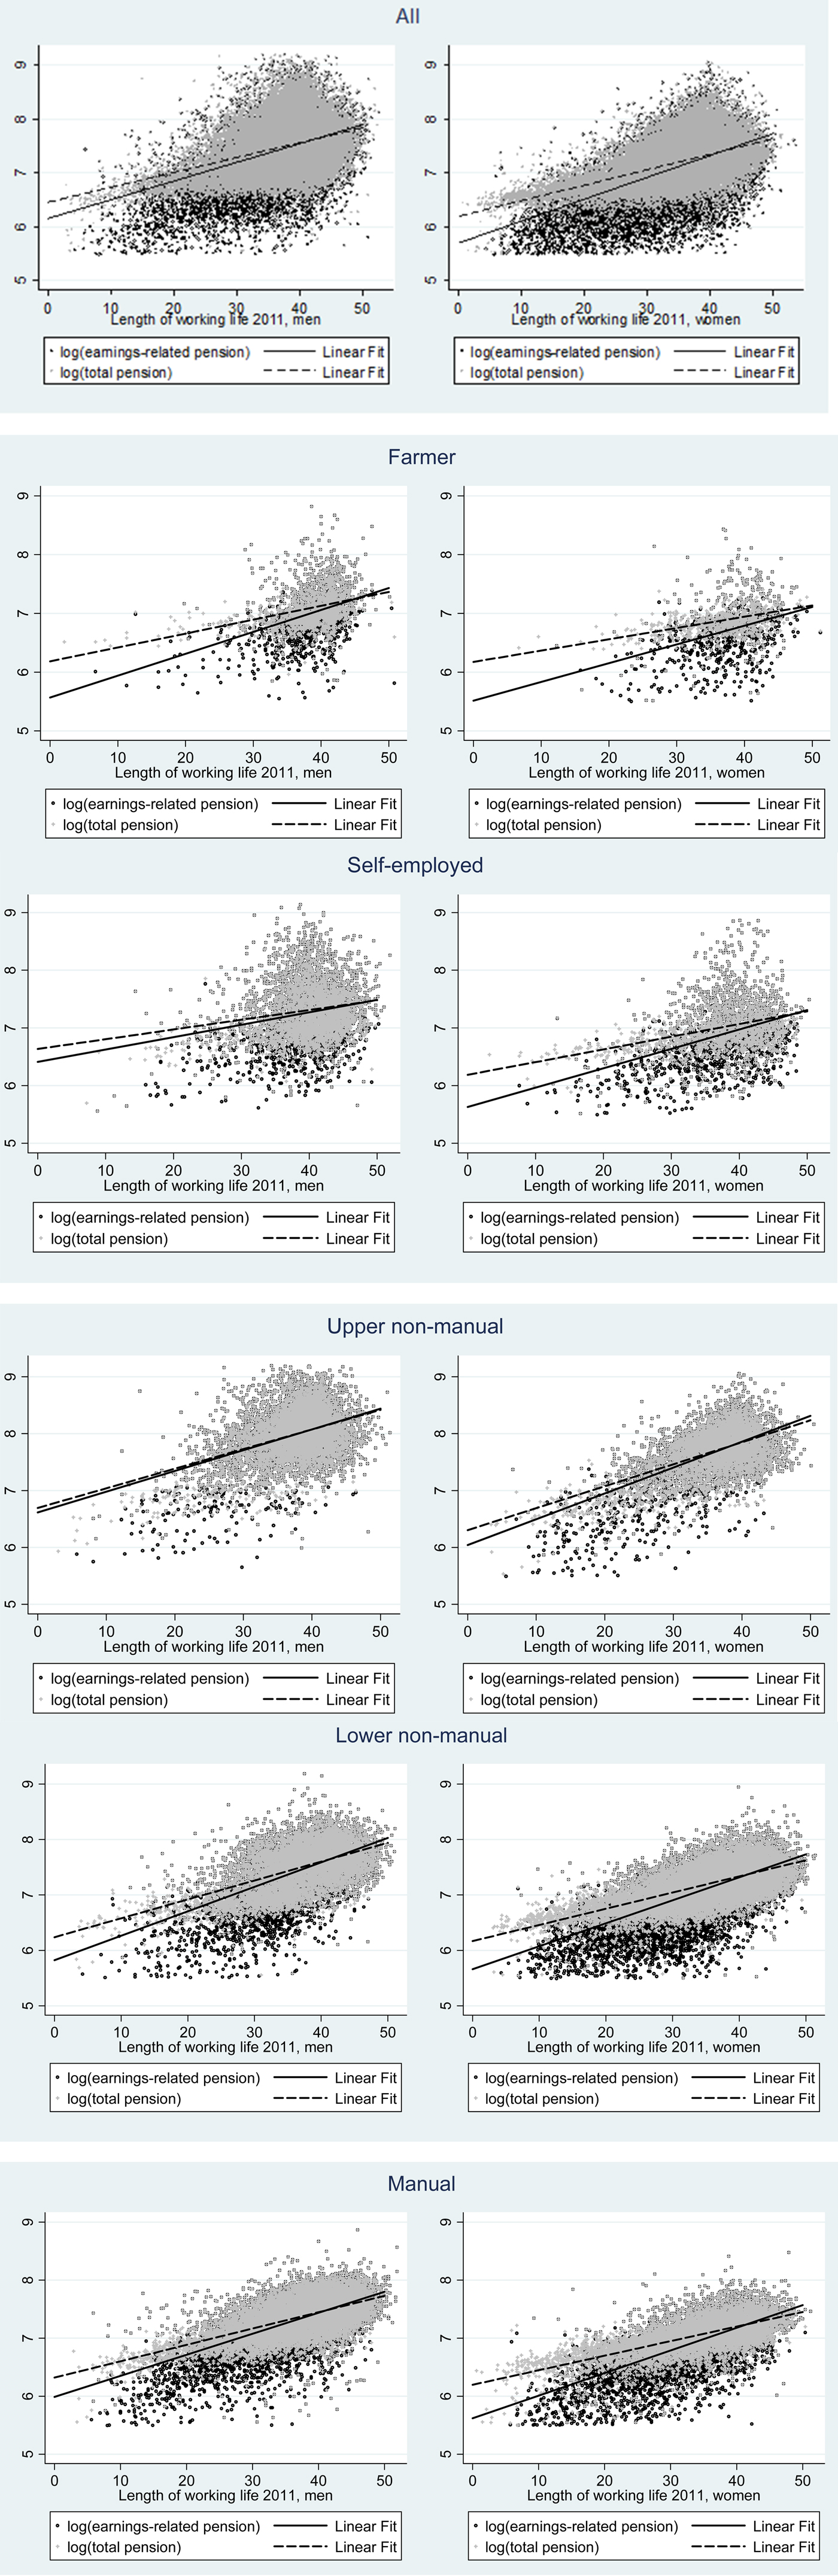
Figure 4. (Colour online) Relationship between pension income (log) and the length of working life by gender and socioeconomic group.
Figure 4 shows the pension levels in logarithmic form, i.e., the slope of the linear fit gives the relative growth in pension level. There is a clear association between the length of working life and pension income; the longer the length of working life, the higher the monthly pension benefit. This applies especially to lower non-manual men, the slope of the relationship between working life length and earnings-related pension income being steeper in relation to other men. Among women, an extra year of work is most profitable for upper non-manual workers. The correlation between length of working life and pension income is less pronounced within self-employed men and farmer women with long careers. Gender differences are noticeable, too. Independent of the length of working life or social class, men have higher pension income levels than women. However, it can be seen that an extra year in work increases earnings-related pension for upper non-manual, manual, and self-employed women relatively faster than for men. For example, for upper non-manual men, every year in working life increases earnings-related pension by 3.7%. The respective change for women is 4.5%. This is due to women's lower starting level of pension. In absolute terms, men have steeper slopes when continuing working.
When comparing the fitted values of earnings-related pension income and total pension income, the cushioning role of non-contributory national pension income is obvious among women. This holds true practically in every social class, except for upper non-manual employees. As can be seen, the effect of non-contributory national pension slowly vanishes in concert with increasing working years.
In principle, independent of gender, those working in farming have the longest working lives. Despite the length of their working lives, their pension income is lowest among all social classes, even after adding non-contributory national pension income to their earnings-related pension income. At the other end of the spectrum are non-manual workers. Upper non-manual workers have by far the highest pension income. In addition, upper non-manual men are the only group where the role of non-contributory national pension is basically irrelevant.
5 Conclusion
Pension systems are under reforms and, according to many views, current changes amplify gender and socioeconomic differences. In particular, the tightened link between life-time earnings and/ or number of contributory years and benefits is seen putting women with lower earnings and shorter contributory periods at disadvantage and thus increasing existing inequalities in the labour market (see e.g Frericks and Maier, Reference Frericks, Maier, Arza and Kohli2008; Horstmann and Hüllsman, Reference Horstmann and Hüllsman2009; Bettio et al., Reference Bettio, Tinios and Betti2013). Socioeconomic differences related to pension system have been on political agenda because of increased empirical evidence on intensified social differences in mortality and life expectancy and their implications for the redistributive properties of pensions systems (Whitehouse and Zaidi, Reference Whitehouse and Zaidi2008).
In this paper, we analyzed the socioeconomic and gender differences in pension income and the length of working lives in Finland. We used internationally unique data covering 50 years of recorded and detailed information on individual employment histories as well as pension income in the first full year on old-age pension, derived from the national and employee pension institutions in Finland. Earlier research has primarily relied on self-reported retrospective information. Here, the focus was register-based information on the observed length of employment episodes and monthly pensions payable.
Our results show, contrary to what was expected, that gender and socioeconomic differences in the length of working life were modest. The small gender difference observed in our data relates to high female employment in Finland, typical also for the other Nordic countries. It is also due to the practise prior to 2005, as short parental leave breaks did not cause breaks in pension accumulation rights. In recent years, many European countries have established specific pension entitlements to credit parenthood and/or childcare (see OECD, 2015). Even though credits are cited as valuable and justified compensating mechanism to close gaps in the pension, the care entitlements embedded in national pension systems do not have a significant impact on mothers’ income position in old age (see Frericks and Maier, Reference Frericks, Maier, Arza and Kohli2008; Frericks et al., Reference Frericks, Maier and de Graaf2008; Horstmann and Hüllsman, Reference Horstmann and Hüllsman2009).
Socioeconomic differences in the length of working lives were even smaller than gender difference. The small difference is plausible considering the difference in the timing of employment in the life course events in different social classes. Manual employees begin their working life at an earlier stage, whereas non-manual employees, particularly upper non-manual, continue working longer. Another reason relates to an artefact of mortality selection; we focused our analyses only on those surviving until old-age retirement in 2011.
While the differences in the length of working life were smaller than expected, the differences in pension income were more prominent. Women's pension income was roughly three quarters that of men. The socioeconomic differences were much wider than gender differences. Upper non-manual employees had clearly higher pension income level than the other groups (150% of the average pension income), while farmers and manual employees (particularly females) had the lowest level (around 60% of the average pension income). Upper non-manual employees were also most often receiving only earnings-related pension. Differences observed in the pension levels seem to reflect differences in earning levels. Here, we analyzed only the absolute levels of pension income. However, as the aim of employment-related pension is not only to provide protection against poverty but also to maintain the income level achieved during the working career, analyzing replacement rates would add on insights on the realization of this task.
Moreover, the results of this study also reveal a clear association between the length of working life and pension income; the longer the length of working life, the higher the monthly pension benefit. This applies especially to men. Taking this result into account, worries about increasing socioeconomic and gender differences due to a closer link between life-time earnings and pension income seem justified.
The analysis also showed that although there were notable differences in pension income level, earnings-related pension is the major source of income in old age. Irrespective of gender or social class, the majority of those who received first time old-age pension in 2011 received only earnings-related pension. Moreover, the results of our analysis revealed that the national non-contributory pension has a significant role in equalizing and cushioning both gender and socioeconomic differences. The role was particularly important for women working in farming, manual employees and self-employed who face a double risk in the labour market, both because of their gender and because of their socioeconomic position. In this paper, the interest was in personal pension income and another type of pension potentially cushioning inequalities in pension income, survivors’ pension, was not taken into account. A majority of recipients of survivors’ pensions is women and including it into the analysis may reduce the difference between women and men pension to some extent (see Takala et al., Reference Takala, Salonen and Lampi2015).
The Finnish case shows that striving for the more equal length of working life alone does not eliminate the gender gap in pensions. Structural earnings differences between genders which are embedded in occupational segregation are equally important. Policy measures aiming at reducing labor market and wage inequality should thus be advanced in order to combat gender pension gap (European Commission, 2018). Furthermore, our case study of Finland points to the importance of non-earnings-related components of pension systems ensuring adequate pension for women and, in more general, those with weaker labor market positions. Therefore, policymakers should secure the cushioning role of minimum and basic pensions when reforming pension systems.
This paper provided empirical evidence on gender and socioeconomic differences in the length of working life and pension income. Future research should focus more on the development of these differences; based on our analyses nothing can be said on the magnitude of these differences in previous decades or in which direction they will evolve. It is also important to study the impacts of pension reforms on these differences, although the graduality and recurrence of reforms make it difficult to study their overall effects.
Although pension policies and reforms determine the later life income, pension policies alone cannot reduce gender and socioeconomic differences in pension income, as they largely reflect gender gaps and social class differences in the labour market. Women tend to have lower wages than men and interrupted employment histories, and lower social class tend to have higher unemployment and disability risk. In order to reduce gender gaps and socioeconomic differences in pension income it is necessary to adopt broader policy measures that equalize chances at earlier stages of the life course.


 Open access