


Typical portion weight data as derived from national food consumption surveys have wide-ranging applications. They provide a useful reference against which to compare future data from the same population. They enable researchers to assign realistic portion weights in non-weighed methods of dietary assessment (for example, when using FFQ), and lend themselves to the development of more accurate and age-appropriate quantification tools, such as photographic food atlases, for use in dietary assessment. Dietitians may find such data useful in their management of child and adult patients. Another application of typical portion weight data is in the establishment of ‘suggested serving sizes’, as used by food manufacturers in food labelling.
Despite their uses, published data on typical food portion sizes as consumed by different populations are somewhat limited for European Union countries. Weighed intake data from the National Diet and Nutrition Surveys have been used to document typical portion sizes of a range of food items consumed by children( Reference Wrieden, Longbottom and Adamson 1 ) and adults( Reference Wrieden and Barton 2 ) in Great Britain. The portion sizes of snacks consumed by adolescents in Britain in 1997 and Northern Ireland in 2005 have also been documented( Reference Kerr, Rennie and McCaffrey 3 ). Older portion size data are available in the Food Portion Sizes publications( 4 , 5 ), which contain a substantial amount of manufacturers' information in addition to ‘average’ portion size data for many food items, mainly derived from the 1986/1987 Dietary and Nutritional Survey of British Adults( Reference Gregory, Foster and Tyler 6 ). The typical portion sizes of foods consumed by children, adolescents and adults in the Republic of Ireland are described for the first time in the Irish Food Portion Sizes Database (available at www.iuna.net).
The present study describes the methodologies used to develop the Irish Food Portion Sizes Database, and some key characteristics of the data contained therein.
Methods
Survey methodologies
The National Children's Food Survey (NCFS) (2003–2004), National Teens' Food Survey (NTFS) (2005–2006) and National Adult Nutrition Survey (NANS) (2008–2010) were carried out as a programme of national nutrition surveys by the Irish Universities Nutrition Alliance (IUNA), a formal association of the nutrition units at University College Cork, University College Dublin, the University of Ulster at Coleraine and Trinity College Dublin. The primary objective of the surveys was to gather information about the dietary habits and nutritional status of the Irish population. Participants on the NCFS and NTFS were recruited from primary and secondary schools that had been randomly selected from a database held by the Irish Department of Education and Science to include a mix of school types (for example, urban/rural, disadvantaged/not disadvantaged, etc.). Similarly, participants on the NANS were randomly selected from a database of names held by An Post (the Irish postal service). The final response rates were 66 % (NCFS), 63 % (NTFS) and 60 % (NANS). Analysis of the demographic features of each of the samples has shown them to be representative of Irish children, adolescents and adults with respect to age, sex, social class, socio-economic group and geographic location when compared with the relevant census data. The NCFS used a 7 d weighed food record to collect intake data from 594 children aged 5–12 years, while the NTFS used a 7 d semi-weighed food record to collect intake data from 441 adolescents aged 13–17 years. The NANS used a 4 d semi-weighed food record to collect intake data from 1500 adults, but data from adults aged 18–64 years only (n 1274) have been included in the Irish Food Portion Sizes Database. Participants were responsible for defining eating occasions. Further detail on the survey methodologies is available at www.iuna.net
Definition of food portion size
For the purpose of the present study, ‘food portion size’ is defined as the weight of food consumed per eating occasion, i.e. weight served minus leftovers. It is not a measure of ‘serving size’, i.e. the weight of food served at an eating occasion, without accounting for leftovers. For ease, the term ‘food portion size’ is used to describe portions of both foods and beverages.
Quantification methods used in surveys
Food weights were included in the estimation of typical portion size regardless of the method of quantification used. A quantification protocol established by the IUNA for the North/South Ireland Food Consumption Survey( Reference Harrington, Robson and Kiely 7 ) was subsequently adapted for the NCFS, NTFS and NANS. All methods of quantification were used with all population groups. The ethos of the protocol was to obtain the best food weight estimates possible using a hierarchy of quantification methods, as described below. Leftovers were also quantified, typically using digital scales, photographic food atlas or household measures, to obtain an accurate estimate of the amount consumed.
Weighed by participant
Each participant (or their parent/guardian in the case of younger children) was provided with a digital food scales and given instructions regarding their use. Participants on the NCFS were asked to weigh all foods consumed throughout the recording period (‘weighed study’), while participants on the NTFS and NANS were asked to weigh as many foods as possible (‘semi-weighed studies’).
Manufacturers' weights
For some foods, it was possible to obtain the amounts eaten from weights printed on food packaging or directly from the manufacturer. To facilitate this, participants were asked to retain food and beverage packaging for collection by the researcher.
Photographic food atlas
A photographic food atlas( Reference Nelson, Atkinson and Meyer 8 ) was used to pictorially quantify foods and beverages, with participants asked to describe food quantities in terms of fractions or multiples of the amounts shown in the food atlas.
Irish Universities Nutrition Alliance weights
Average portion weight data collated by the IUNA survey team for certain foods were applied where appropriate. These foods included items from local chip shop menus and loose fruit and vegetables, weighed in triplicate to provide average values.
Food Portion Sizes publications
Food Portion Sizes ( 4 , 5 ) publications were used to assign average portion weights to foods and beverages where none of the previous methods had provided quantities.
Household measures
Measures such as ‘teaspoon’, ‘tablespoon’ and ‘pint’ were used to quantify certain food items (for example, sugar, oils).
Estimated
The researcher made an estimate of the amount of food or beverage likely to have been consumed based on their knowledge of the participants' eating habits as observed during the recording period.
Selection of food items for analysis
All foods and beverages consumed on each of the surveys were assigned to one of sixty-eight different food groups previously defined by the IUNA research group. Within each food group, foods were ranked by frequency of consumption (i.e. number of eating occasions) to determine key items for analysis. Foods that were very infrequently consumed were excluded from the analysis. Similar foods within a food group were aggregated where appropriate, for example, ‘mayonnaise, retail’, ‘mayonnaise, homemade’ and ‘mayonnaise, reduced calorie’ were combined for portion size analysis of ‘mayonnaise’. An extensive selection of foods from all of the major food categories (i.e. starchy foods, fruit and vegetables, milk and dairy foods, meat and other protein foods, and foods high in fat or sugar) was included for analysis. Food items were subsequently re-grouped into twenty-three food groups for presentation in the database.
Estimation of typical food portion size
For each food item examined, descriptive statistics were performed to obtain the median, 25th and 75th percentile portion weights, split by age group or sex, as appropriate. The adult and adolescent portion weight data are presented overall, and separately for males and females, to reflect the disparity in their energy requirements. Adult and adolescent data have not been split by age group, however, as the differences in energy requirements that occur in each sex between the ages of 18 and 64 years, and during the narrow age range examined for adolescents, are relatively small( 9 ). As male and female children of the same age have similar energy requirements( 9 ), this group was not split by sex. Instead, the group was split into younger (5–8 years) and older (9–12 years) age groups to reflect the increase in energy requirements that occurs with age in young children( 9 ). Portion weights from all eating occasions of a particular food were included for analysis, while non-consumers of that food were excluded. Data manipulation and statistical analysis were conducted using SPSS version 15.0 for Windows (SPSS Inc.). Before the estimation of typical (median) portion weights, identical food codes within a meal were aggregated so that if, for example, two potatoes eaten at the same meal were entered into the food consumption database separately with weights of 65 g and 70 g, the portion weight carried forward for analysis was 135 g.
Inclusion of reference weights
‘Reference weights’ are described in the database for food items wherever available (in square brackets immediately following the food descriptor). These weights comprise a mixture of manufacturers' information (for example, one Weetabix biscuit = 19 g), IUNA information (for example, one medium tomato = 80 g) and data from the Food Portion Sizes publication( 4 ) (one medium boiled egg = 50 g). These are not suggested portion sizes and are included solely to provide some context for the typical portion weight data generated for the different population groups.
Standardising edible fractions
Certain foods have different portion weights depending on the form in which they are weighed (for example, bananas weighed with or without skin). It was considered acceptable for participants to report food portions to include non-edible food parts. Where this occurred, a factor was applied so that the weight of the edible fraction only was recorded. This was done using standard published factors for stone-containing fruits (olives, peaches, nectarines, plums), fruits weighed with skin where the skin is not eaten (bananas, oranges, melons) and fruits weighed with cores (apples, pears)( Reference Holland, Unwin and Buss 10 ). A published conversion factor was also applied to lamb and pork chops weighed with bone to ascertain the weight of the edible fraction only( Reference Chan, Brown and Lee 11 ).
Examining the effect of under-reporting of energy intake
Adult participants identified as having a ratio of energy intake:estimated BMR of less than less than 1.10 were defined as energy under-reporters( Reference Goldberg, Black and Jebb 12 ). Energy under-reporters were not excluded from the estimation of typical food portion weights in any of the survey groups. To investigate whether the inclusion of energy under-reporters may have introduced bias to the analysis, median and interquartile range (IQR) portion weights of a subsample of foods consumed by men and women on the NANS were compared to include and exclude energy under-reporters. Foods within this subsample were selected based on their relatively large n values (number of eating occasions), and in order to represent all of the major food categories (i.e. starchy foods, fruit and vegetables, milk and dairy foods, meat and other protein foods, and foods high in fat or sugar).
Results and discussion
Foods included in database
The Irish Food Portion Sizes Database (available at www.iuna.net) contains median and percentile portion weight information for the foods most commonly consumed by Irish children (5–12 years), adolescents (13–17 years) and adults (18–64 years) based on intake data from the NCFS, NTFS and NANS. Typical portion weights are reported for a total of 545 food items across twenty-three food groups (Table 1), covering the vast majority of items consumed on each of the surveys (NANS, 93 %; NTFS, 85 %; NCFS, 91 %). For each food item examined, portion weights from all eating occasions were included for analysis. This was carried out to capture the full distribution of portion weights and allow for within-person variability in portion size, rather than a mean weight being calculated for each participant before calculating the overall ‘average’ portion weight. The methodology is in agreement with that used in previous studies that have estimated typical food portion sizes( Reference Wrieden and Barton 2 , Reference Rangan, Schindeler and Hector 13 , Reference Fox, Reidy and Karwe 14 ) or examined trends in food portion sizes over time( Reference Nielsen and Popkin 15 – Reference Smiciklas-Wright, Mitchell and Mickle 17 ).
Table 1. Food groups included in the Irish Food Portion Sizes Database

NCFS, National Children's Food Survey; NTFS, National Teens' Food Survey; NANS, National Adult Nutrition Survey.
Methods of quantification
A breakdown of the quantification methods used in each of the surveys is provided in Table 2. The top two methods of quantification, i.e. ‘weighed by participant’ and ‘assigned a manufacturer's weight’, which is generally considered as reliable as the participant weighing the food, accounted for 86 % (NCFS), 46 % (NTFS) and 57 % (NANS) of the quantification used in the surveys. While a significant number of data were quantified using non-weighed methods, particularly in the case of adolescents and adults, Wrieden & Barton( Reference Wrieden and Barton 2 ) have used data from the British National Diet and Nutrition Surveys of adults aged 19–64 years( Reference Henderson, Gregory and Swan 18 ) and people aged 65 years and over( Reference Finch, Doyle and Lowe 19 ) to show that there was little difference in the energy and nutrient intakes obtained from ‘weighed’ data only, when compared with both ‘weighed’ and ‘non-weighed’ data. Both ‘weighed’ and ‘non-weighed’ data were subsequently included in the estimation of typical food portion sizes for adults( Reference Wrieden and Barton 2 ) and children( Reference Wrieden, Longbottom and Adamson 1 ) in Great Britain, and in comparing the portion sizes of snacks consumed by adolescents in Britain in 1997 and Northern Ireland in 2005( Reference Kerr, Rennie and McCaffrey 3 ). All other studies identified as having estimated typical portion sizes( Reference Rangan, Schindeler and Hector 13 , Reference Fox, Reidy and Karwe 14 ) or examined trends in portion sizes over time( Reference Nielsen and Popkin 15 – Reference Smiciklas-Wright, Mitchell and Mickle 17 ) have relied on a full set of ‘non-weighed’ data in their analyses.
Table 2. Percentage of food-eating occasions by method of quantification on the National Children's Food Survey (NCFS), National Teens' Food Survey (NTFS) and National Adult Nutrition Survey (NANS)

IUNA, Irish Universities Nutrition Alliance.
*Data from participants aged 18–64 years only.
Use of median and interquartile range portion weights
Reporting typical portion weights using median and IQR values means that a robust set of data is produced, eliminating the need to remove outliers. Median portion weights were shown to be the most appropriate value to use in reporting typical portion sizes in an analysis performed on the National Diet and Nutrition Survey databases of children aged 1½–4½ years( Reference Gregory, Collins and Davies 20 ) and young people aged 4–18 years( Reference Gregory and Lowe 21 ). Presenting the data in this way also allows for comparison with the typical portion size data previously reported for British children, adolescents and adults( Reference Wrieden, Longbottom and Adamson 1 – Reference Kerr, Rennie and McCaffrey 3 ) and Australian adults( Reference Rangan, Schindeler and Hector 13 ).
Treatment of energy under-reporters
Table 3 shows that the inclusion of energy under-reporters made little difference to the estimation of median and IQR portion weights for a selected subsample of foods consumed on the NANS. This finding held true for foods that might be perceived as ‘healthy’ (for example, boiled carrots) and ‘less healthy’ (for example, chips and wedges). The finding suggests that energy under-reporting may occur more typically as the ‘omission’ of food items than as the ‘underestimation’ of portion weights. Since under-reporters of energy intake do not appear to be significant mis-reporters of portion size, it would seem appropriate to continue to include them in the estimation of typical portion weights for a population. Thus, the Irish Food Portion Sizes Database made no adjustments to account for under-reporting of energy intake on any of the surveys. Including energy under-reporters in the analysis meant that a greater number of eating occasions were available to work with (larger n values), and more food items could be included in the analysis. Previous studies reporting typical food portion sizes in children, adolescents and adults have also opted to include all reporters in their analysis( Reference Wrieden, Longbottom and Adamson 1 , Reference Wrieden and Barton 2 ). Similarly, studies which have observed trends in food portion sizes over time have included all reporters( Reference Nielsen and Popkin 15 , Reference Nielsen and Popkin 16 ).
Table 3. Effect of under-reporting of energy intake on estimates of food portion weights in Irish adults aged 18–64 years
(Numbers, medians and interquartile ranges (IQR))
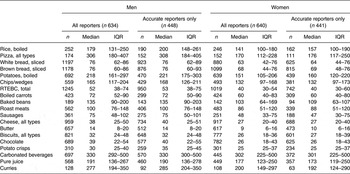
RTEBC, ready-to-eat breakfast cereals.
Comparison between population groups
The median portion weights reported for Irish adolescents and adults in the database appear similar for many foods, while those reported for children are notably smaller. Older-aged children (9–12 years) reported larger median portion weights for most foods than younger children (5–8 years). However, identical portion weights were reported by children for a range of packaged food items that tend to be consumed in unit amounts (for example, yoghurts, crisps). Typical portion weights were estimated overall, and separately for males and females, for the adolescent and adult groups. In both groups, the median portion weights consumed by males tended to be greater than those consumed by females, particularly for foods that may be self-served (for example, pasta, breakfast cereals, composite meals). Median portion weights were more similar among males and females for packaged foods that tend to be consumed in unit amounts (for example, yoghurt, popcorn), and for other foods that may be consumed in more fixed amounts (for example, sliced bread, eggs, bananas). Typical portion weight data should be estimated separately for children and adults, and for adult males and females, due to the disparity in the typical portion weights reported by these groups.
Comparison with other data
A comparison of the typical portion weights reported for Irish adults with the equivalent data for adults in Great Britain( Reference Wrieden and Barton 2 ) suggests that portion sizes are broadly similar between the cohorts for the majority of food categories. For most foods examined, the UK median weights were slightly (5–10 %) smaller than the Irish median weights; however, this may be partly attributable to the fact that the Irish group consisted of adults aged 18–64 years only, while the UK group included ‘elderly adults’, whose reduced energy needs might be expected to reduce the overall median portion weights of the group. Foods that tend to be consumed in unit amounts (for example, yoghurts, crisps) were, in many cases, reported with identical portion weights, as were ‘condiment’ type foods (for example, butter, spreads, sugar, jam, ketchup). Irish adults reported larger portions of boiled and mashed potatoes, scones, breakfast cereals, tea, coffee and milk, while UK adults reported larger portions of fairy cakes, fruit crumble and custard. The differences may be attributable to cultural factors, or to methodological differences in the estimation of portion size (for example, a heavier reliance on non-weighed methods of quantification for a particular food may have biased portion weight estimates for that food).
Strengths and limitations
The Irish Food Portion Sizes Database has two notable strengths: first, it is based on data collected from nationally representative samples of the Irish population; and second, it is the output of very carefully quantified food intake data. A limitation is that the database does not account for possible differences in portion weight relating to the eating occasion at which a food was consumed (for example, a typical portion of roast chicken consumed as part of an evening meal may be larger than a typical portion consumed as part of a sandwich).
Possible applications of the data
Being the first extensive set of food portion size data for Irish children, adolescents and adults, the Irish Food Portion Sizes Database will serve as a useful reference against which to compare future Irish portion size data. This is of public health interest, with large portion sizes considered a possible dietary risk factor for obesity( 22 ). Age- and sex-specific typical portion weights are of use in dietary intake assessment, allowing researchers to avoid reliance on ‘standard’ portion sizes, which have been shown to underestimate energy and nutrient intakes( Reference Hendricks, Tang and Spiegelman 23 , Reference Welten, Carpenter and McPherson 24 ). In addition, the 25th percentile, median and 75th percentile values could conceivably be considered ‘small’, ‘medium’ and ‘large’ portion weights in non-weighed methods of dietary assessment, according to how they are described by participants. The data will also enable researchers to improve quantification tools for use in dietary intake assessment, for example, age-appropriate food atlases, which have previously been shown to improve the accuracy of food portion size estimation in children( Reference Foster, Matthews and Lloyd 25 ). Dietitians and other health professionals may also find this resource useful in their management of child and adult patients. A further application of the data is in the establishment of ‘suggested serving sizes’ as used in food labelling.
Conclusions
The Irish Food Portion Sizes Database describes typical portion weights for a total of 545 food items for Irish children, adolescents and adults. The typical portion weights reported for children are notably smaller than those reported for adolescents or adults, and adolescent and adult males tend to consume larger portions than females. The inclusion of energy under-reporters makes little difference to the estimation of typical portion weights in adults. The data provide a useful reference against which to compare any future food portion size data, and may have applications for dietary intake assessment, food labelling or public health initiatives.
Acknowledgements
The present study was funded by the Irish Department of Agriculture, Food and the Marine under the Food for Health Research Initiative 2007–2012, supported by the Irish Department of Health and the Health Research Board.
J. L. was involved in the collection and analysis of data, and preparation of the manuscript; A. F. was involved in the conception of the study and was a grant holder; J. W. was involved in the design and implementation of the studies. All authors contributed to the writing of the manuscript.
There are no personal or financial conflicts of interest.


 Open access