


Introduction
Eating behaviours are physical and behavioural processes mainly focused on meeting the requirements for health and growth, and they evolve during the first years of life(Reference Savage, Fisher and Birch1). Eating behaviours may vary on a range from picky eating to overeating or binge eating(Reference Lewinsohn, Holm-Denoma and Gau2,Reference Marcus and Kalarchian3) . A wide range of prevalence rates have been reported due to variability in definition; it is estimated that approximately 25 % of normally developing children, and up to 80 % of children with developmental delays, display some type of feeding problems(Reference Linscheid, Budd, Rasnake and Roberts4,Reference Bryant-Waugh, Markham and Kreipe5) .
Measurement methods that are feasible and sensitive to cultural differences are essential for understanding eating behaviour differences. Although direct observation may be considered the ideal method, it is extremely costly and has been found to interfere with the typical behaviours of the participant, particularly those under investigation(Reference Mallan, Liu and Mehta6). In response to methodological difficulties in studying eating behaviours, some standardised feasible psychometric tools have been developed to assess children's eating behaviour, namely the Dutch Eating Behaviour Questionnaire (DEBQ)(Reference Van Strien, Frijters and Bergers7), the Children's Eating Behaviour Inventory (CEBI)(Reference Archer, Rosenbaum and Streiner8) and the Children's Eating Behaviour Questionnaire (CEBQ)(Reference Wardle, Guthrie and Sanderson9). The latter is the most comprehensive and widely used parent-report tool that assesses children's eating styles in terms of both obesity risk and undereating. The tool has been found to have a high reliability and validity in several countries(Reference Domoff, Miller and Kaciroti10–Reference Sleddens, Kremers and Thijs12). The original CEBQ is founded on an 8-scale conceptualisation of eating styles which can be categorised as food approach and food avoidance. The food approach category consists of (1) the desire to drink scale, which was developed to detect an increased desire for drink, particularly sugar-sweetened drinks(Reference Wardle, Guthrie and Sanderson9), (2) the enjoyment of food scale which represents a general interest in food and (3) the food responsiveness scale that measures eating in response to external food cues(Reference Wardle, Guthrie and Sanderson9,Reference Svensson, Lundborg and Cao13) . The food avoidance category consists of (1) the satiety responsiveness scale, which reflects the ability to regulate the amount of food that is eaten according to internal satiety cues(Reference Sleddens, Kremers and Thijs12), and (2) the slowness in eating scale which measures the speed of eating during the course of a meal. A reduction in speed reflects a loss of interest in a meal(Reference Sleddens, Kremers and Thijs12) while (3) food fussiness reflects a lack of interest in food or being selective of certain types of food and an unwillingness to try new foods (food neophobia) leading to the consumption an inadequate variety of foods(Reference Wardle, Guthrie and Sanderson9,Reference Falciglia, Couch and Gribble14) . Finally, the scales of emotional overeating and emotional undereating are characterised by either increased or decreased eating in response to negative emotions such as anger and anxiety(Reference Wardle, Guthrie and Sanderson9).
Several studies have assessed the applicability of the CEBQ in populations other than the one in which it was developed (i.e. well-educated parents of children aged 2–9 years living in the UK). Most of the studies, however, were conducted among wealthier countries such as Sweden(Reference Svensson, Lundborg and Cao13), the Netherlands(Reference Sleddens, Kremers and Thijs12), the USA(Reference Domoff, Miller and Kaciroti10) and China(Reference Cao, Svensson and Marcus15). Problems at both the item and factor level have emerged in these studies. For example, the validation study conducted in China indicated that the CEBQ in its original form may not be culturally appropriate for non-Western populations and proposed an alternative 19-item version of the tool (based on Principal Component Analysis (PCA))(Reference Cao, Svensson and Marcus15). A more recent study conducted in Indonesia has found that the original eight-factor structure of the CEBQ showed adequate validity (based on Confirmatory Factor Analysis (CFA)), and stated that it is culturally appropriate for mothers of preschool children living in low- and middle-income countries(Reference Purwaningrum, Arcot and Hadi11).
Socio-cultural and other related contexts play a role in shaping eating behaviours(Reference Savage, Fisher and Birch1). Understanding the local context is, thus, imperative to explaining the dynamics of the child feeding process(Reference Savage, Fisher and Birch1). The fast-progression of urbanisation and rapid socioeconomic and lifestyle changes in cities of developing countries are disrupting both access to food and feeding practices(Reference Berhane, Ekström and Jirström16). However, there is a limited evidence about child feeding and eating behaviours in most African countries such as Ethiopia. A recent study conducted in Addis Ababa found that the overall mean score for the eight scales of the CEBQ was close to the midpoint (2⋅5); however, emotional overeating (mean: 1⋅31, sd: 0⋅59) and slowness in eating (mean: 3⋅47, sd: 0⋅86) mark the opposite extremes of the spectrum(Reference Gebru, Gebreyesus and Yirgu17). The study also found a strong association between the eating behaviour scales and caregiver's controlling feeding practices(Reference Gebru, Gebreyesus and Yirgu17). Moreover, studies done among adolescents in Addis Ababa have also revealed that there is a cultural influence on perceptions of ‘healthy’ appearance and the presence of unhealthy weight control behaviour practices(Reference Yirga, Gelaw and Derso18,Reference Tuffa, Gebreyesus and Endris19) . This indicates the importance of more research on eating behaviours that manifest in early childhood as they can be a precursor to maladaptive eating later in life. Targeting children's eating behaviours is important to prevent health-related problems, such as poor growth and obesity(Reference Jansen, Roza and Jaddoe20,Reference Kwon, Shim and Kang21) . Developing countries including the study area are currently facing a double burden of malnutrition(Reference Abdullah22). A recent study documented the co-existence among preschoolers in our study area, where a high prevalence of overweight/obesity (11⋅4 %) and undernutrition (19⋅6 %) was reported(Reference Berhane, Jirström and Abdelmenan23). Therefore, having an instrument with the capacity to measure children's eating behaviours with good reliability and validity is crucial for early detection and monitoring of children at risk and to provide evidence to enhance theoretical development(Reference Mallan, Liu and Mehta6). Validity of the CEBQ, however, remains under-researched in Sub-Saharan African countries. The present study, thus, aims to investigate the psychometric validity of the Ethiopian version of CEBQ in preschool children.
Materials and methods
Study design and procedures
We conducted a school-based cross-sectional study among 542 caregivers of children aged between three and six attending preschools in Addis Ababa, the capital city of Ethiopia. We used a multi-stage sampling technique to obtain a representative sample of study participants. The study examined all preschool children attending selected schools in Addis Ababa during the academic year 2018/19 and their parents/caregivers. The schools were selected by first stratifying the sub-cities into three strata by using socioeconomic status indicators. And finally, a simple random procedure was used to select students using school registers from each grade.
Parents/caregivers of the randomly selected students were recruited by sending an invitation to participate in the study through the school's teachers and the students’ communication books. Those willing to participate came to the schools at the appointed time. Informed consent was obtained after explaining the main purpose of the study. Finally, the parents/caregivers completed an interview-based questionnaire. The children's anthropometric measurements were taken the next day. We conducted a 7-h session to train interviewers on how to administer the CEBQ self-report interviews for the caregivers. The training session gave overviews of standard interview practices and the content of the CEBQ items both in English and in Amharic. In addition, the training also covered the use of certain interview probes and their purposes. There was also a demonstration of an interview using role-playing methods by the trainees.
Ethical declaration
This study was conducted according to the guidelines laid down in the Declaration of Helsinki, and all procedures involving research study participants were approved by the ethical review board of Addis Ababa University under project number 0011. Written informed consent was obtained from all caregivers.
Measures
Children's eating behaviour
The CEBQ is a retrospective, parental/caregiver reported questionnaire that has been used worldwide to examine eating behaviours of children aged 2–9 years(Reference Wardle, Guthrie and Sanderson9). The original version of CEBQ consists of 35 items that evaluates eight subscales of eating behaviour: food responsiveness (FR = 5 items), enjoyment of food (EF = 4 items), emotional overeating (EOE = 4 items), desire to drink (DD = 3 items), slowness in eating (SE = 4 items), satiety responsiveness (SR = 5 items), food fussiness (FF = 6 items) and emotional undereating (EUE = 4 items). The items are rated on a five-point Likert scale (1 = Never, 2 = Rarely, 3 = Sometimes, 4 = Often, 5 = Always).
Assessment of face validity
CEBQ was first translated by a qualified bilingual researcher whose mother tongue is Amharic into the Amharic version and then back translated into English by a different bilingual researcher whose mother tongue is Amharic to ensure the quality of the translation and maintain consistency in the questionnaire. The researchers were independent of the study to ensure the accuracy of the Amharic version. However, we faced some errors/discrepancies during the translation process due to the usage of wrong words, phrases being too complex and some were performed through the word to word translation which distorted the overall meaning of the questions, for 7 items of the questionnaire. Then, a consensual translation of the questionnaire was performed. Face validity was conducted for the 35 items of the CEBQ(Reference Wardle, Guthrie and Sanderson9). Two focus group discussions with a total of twenty parents, ten parents per each focus group which had comparable socio-demographic status with the study sample, were conducted with the aim of clarifying the wording of the instruments and their intended meaning. Some of the discussion points were concerned with how best to structure the items in a way that could be understood in the context of the country without losing the original meaning of the questions. Participants were also asked for ideas about improving the wording of questions that were perceived as vague or unclear; constructive feedback from parents at this point was used to refine the questionnaire. During the focus group discussions, nine of the thirty-five questions had a discrepancy between the translated questionnaire and their intended meaning. Several items seemed redundant using the equivalent Amharic terminologies: item 2 ‘My child eats more when worried’, item 9 ‘My child eats less when angry’, item 13 ‘My child eats more when annoyed’ and item 15 ‘My child eats more when anxious’. In addition, based on the constructive feedback from five parents, we decided to clarify and rephrase item 27 ‘My child eats more when s/he has nothing else to do’, item 30 ‘My child cannot eat a meal if s/he has had a snack just before’ and item 34 ‘If given the chance, my child would always have food in his/her mouth’. All of the items were then modified and rephrased based on the feedback received from the parents into more widely available and contextually acceptable phrases. The remaining items were retained in their original form since the parents understood the intended meaning of the items and there was no confusion with their meaning.
Anthropometric measurements
Anthropometric measurements were taken to compute the children's BMI to assess the convergent validity of the CEBQ eight-factor tool. Weight was measured to the nearest 0⋅1 kg using an electronic portable scale (Seca), while height was measured in the standing position to the nearest 0⋅1 cm using a portable locally made stadiometer. We conducted an anthropometric measurement (weight and height) standardisation exercise among selected children and calculated the intra- and inter-observer technical errors of measurement (TEM). The intra-observer technical error of measurement for height was found to be 0⋅19 and for weight 0⋅12. The inter-observer technical error of measurement for height was found to be 0⋅21 and for weight 0⋅21. The coefficient of reliability was 97⋅5 %. All the measurements were found to be within an acceptable range.
Demographic and socioeconomic characteristics
The children's sex and age (in completed years) were measured. The caregivers’ education levels were measured using a scale of (1) no formal education, (2) primary education, (3) secondary education, (4) technical school and above. Socioeconomic status was assessed through ownership of household assets and housing condition-related variables.
Data management and analysis
We used the Stata version 15.0 statistical software package for data cleaning and analysis. Descriptive data were presented using frequency, percentage and mean (sd). All the analyses performed were pre-specified and based on the study objective.
The World Health Organization's (WHO) 2007 growth reference was used as a standard reference for classifying preschool children's BMI using the WHO's Anthro Plus software, version 1.0.21. Children's weight status was classified using the WHO 2007 growth reference for BMI-for-age cut-offs. Children that were 5 years and above with BAZ < −3 were classified as severely underweight, and children between −3 and −2 as underweight, between −2 and +1 as normal, between +1 and +2 as overweight and >+2 as obese(Reference Van den Broeck, Willie and Younger24). Children aged below 5 years with BAZ < −3 were classified as severely underweight, and children between −3 and −2 as underweight, between −2 and +1 as normal, between +1 and +2 as at risk of overweight, between +2 and +3 as overweight and >+3 as obese(25).
The socioeconomic status of the study households was determined using the PCA. Household asset ownership and variables related to housing conditions were used in the analysis to categorise households into wealth quintiles, ranging from poorest to the wealthiest.
The construct validity was assessed by subjecting the items of the instrument to CFA. The CFA was done to confirm whether the items were a good measure of the latent constructs, to check the item load on the proposed constructs and to consider the appropriateness of the factor structure(Reference Steiger26). CFA is considered to be the ‘gold standard’ for validating hypothesised factor structures (models) and provides a more accurate examination of the structure of the data and variable correlations(Reference Kim27). First, Kaiser-Meyer-Olkin (KMO) test was done to indicate the adequacy of the sample for factor analysis; it was considered adequate if above 0⋅5. Moreover, for each CFA, we allowed intercorrelations between each of the factors and did not allow cross-factor loadings. We decided not to use χ 2 statistics to evaluate model fit due to its sensitivity to sample size. Therefore, three common model fit indices were adopted to evaluate fit of the overall model: Comparative Fit Index (CFI), Tucker–Lewis Index (TLI) and root-mean-square error of approximation (RMSEA). Commonly used cut-off values were used in the present study: TLI/CFI > 0⋅95 (good fit), 0⋅90–0⋅95 (borderline fit) and <0⋅90 (poor fit); RMSEA <0⋅06 (good fit), 0⋅06–0⋅08 (fair fit), 0⋅08–0⋅10 (borderline fit) and >0⋅10 (poor fit)(Reference Lt and Bentler28). In addition, we judged the acceptability of model fit indices relative to the ideal values and re-specified the models based on standard regression coefficient loadings, modification indices and important theoretical grounds.
Bivariate correlations between each of the eight CEBQ subscales and the child's BMI z-scores were computed to assess convergent validity. Furthermore, discriminant validity was tested using factor–factor correlations. Cronbach's αs were also calculated to assess the internal reliability of the subscales.
Result
Participants characteristics
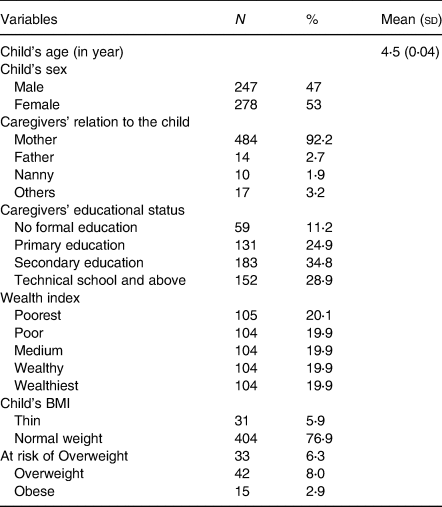
From a total of 542 caregivers we approached, 525 participated in the study, resulting in a response rate of 96⋅8 %. A total of 17 caregiver–child dyads were not included in the study because the caregivers did not have adequate time/refused to be interviewed. The socio-demographic characteristics of caregiver–child dyads are presented in Table 1. Most of the respondents (92⋅2 %) were the mothers of the index children. The mean age of the children was 4⋅5 years (±sd = 0⋅04). We found that 76⋅9 % (404) of the children had normal BMI-for-age scores. However, 8⋅0 % (42) children were overweight, and 2⋅9 % (15) were obese. Our findings also showed that 5⋅9 % (31) children were underweight (see Table 1).
Table 1. Characteristics of the preschool children and their caregivers in Addis Ababa, Ethiopia
The eight-factor confirmatory factor analysis
The KMO of the tool was 0⋅83, which shows the data were suited for factor analysis. The analysis commenced with 35 items and involved a series of iterations, based on the accepted methods of identifying the best model. We tested the eight factors (35 items) of the original CEBQ. Of these, seven items were removed based on their low factor loading (<0⋅30): one item from food responsiveness ‘Even if my child is full up s/he finds room to eat his/her favorite food’, one item from desire to drink ‘My child is always asking for a drink’, two items from food fussiness ‘My child refuses new foods at first’ and ‘My child is difficult to please with meals’, one item from satiety responsiveness ‘My child cannot eat a meal if s/he has had a snack just before’, one item from slowness in eating ‘My child eats more and more slowly during the course of a meal’ and one item from emotional undereating ‘My child eats more when she is happy’. The finding that such items had a low factor loading is similar to other studies(Reference Purwaningrum, Arcot and Hadi11,Reference Cao, Svensson and Marcus15) . The fitness of the eight-factor model (28 items) after the removal of low loading items had RMSEA = 0⋅09 (90 % CI 0⋅087, 0⋅096); CFI = 0⋅70 and TLI = 0⋅64, providing a poor model fit (see Table 2).
Table 2. Confirmatory factor analysis of Children's Eating Behaviour Questionnaire, Addis Ababa, Ethiopia

CFI, Comparative Fit Index; TLI, Tucker–Lewis Index; RMSEA, root-mean-square error of approximation; CI, confidence interval.
a Model: Baseline model which is the original eight-factor model with 35 items.
b Model: the eight-factor model after the low loading items were removed (28 items).
c Model: the modified and final model fit after correlation of residuals and identification of some cross loadings items.
After reviewing the modification indices, however, correlation of residuals was conducted. We also identified some cross loadings that may have potentially contributed to the poor model fit. One of the cross loadings identified was a reverse-scored item from the Satiety Responsiveness subscale ‘My child has a big appetite’, which was also loaded on the Enjoyment of Food factor (in an opposite direction). This item was then specified to load only on Enjoyment of Food. The rationale for making this modification is that a child with a ‘big appetite’ may appear to enjoy food more and might describe how much s/he wants to eat(Reference Wardle, Guthrie and Sanderson9). This was similar to other studies(Reference Quah, Fries and Chan29,Reference Quah, Cheung and Pang30) . The other cross loading was one of the items of the Emotional Overeating subscale ‘My child eats more when s/he has nothing else to do’, which had a significant cross loading on the Food Responsiveness factor so we loaded the item onto Food responsiveness. Based on the literature, the loading of this item onto Food Responsiveness is a clear reflection that this item describes external eating, a type of eating behaviour basic to food responsiveness(Reference Wardle, Guthrie and Sanderson9). This finding has also been found elsewhere(Reference Domoff, Miller and Kaciroti10). After making these modifications, we found RMSEA = 0⋅05 (90 % CI 0⋅045, 0⋅055); CFI = 0⋅92 and TLI = 0⋅90, providing an acceptable model fit (see Table 2). The revised enjoyment of food and food responsiveness scales had five items each including those items that were previously loaded on another scale (see Table 3).
Table 3. Standardised regression weight for the modified eight-factor CEBQ tool in Addis Ababa, Ethiopia
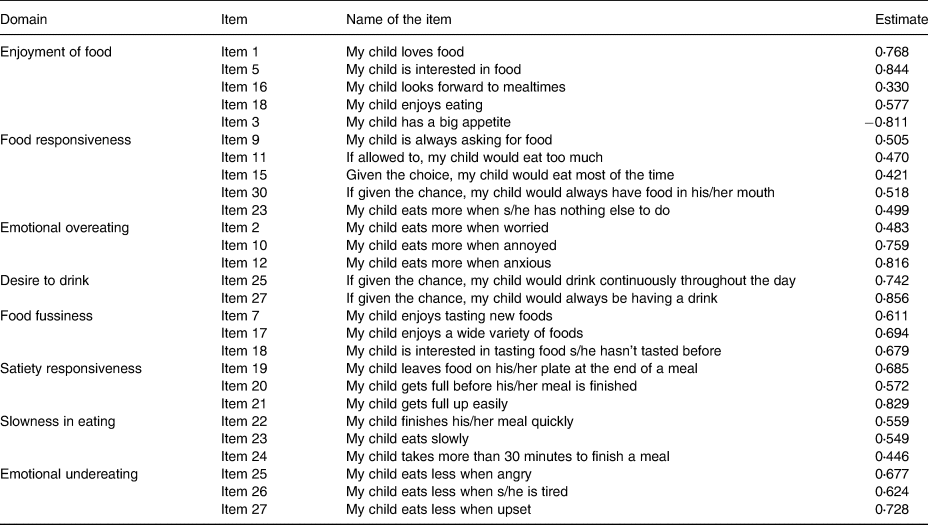
CEBQ, Children's Eating Behaviour Questionnaire.
Discriminant and convergent validity
The results of discriminant validity were assessed using factor–factor correlations shown in Table 4. CEBQ subscales of food approach were positively correlated with each other, while food avoidance behaviours were correlated among themselves. In addition, a negative correlation was observed between categories except desire to drink. Overall, children's eating behaviours coefficients represented small to large relation based on Cohen's guidelines(Reference Cohen31). There was a highly significant correlation with satiety responsiveness and slowness in eating (r = 0⋅53, P < 0⋅01) and with enjoyment of food and food responsiveness (r = 0⋅49, P < 0⋅01). This indicates that children who are more responsive to food cues also tend to enjoy their food. Furthermore, enjoyment of food was moderately negatively related to food fussiness (r = 0⋅41, P < 0⋅01) and slowness in eating (r = 0⋅31, P < 0⋅01). This indicates that children tend to eat more slowly and are fussier in their eating tend to enjoy food less. Our finding shows that food responsiveness was positively correlated with emotional overeating (r = 0⋅45, P < 0⋅01) (see Table 4).
Table 4. Correlations between the CEBQ scales, child's BMI in Addis Ababa, Ethiopia

CEBQ, Children's Eating Behaviour Questionnaire, BMI, Body Mass Index.
*P < 0⋅05, **P < 0⋅01.
In addition, the result of convergent validity of the eight subscales with child nutritional status showed a significant positive correlation with emotional overeating scale (r = 0⋅16, P < 0⋅01) and food fussiness (r = 0⋅11, P < 0⋅01), while it was negatively correlated with satiety responsiveness (r = −0⋅13, P < 0⋅01) and slowness in eating scale (r = −0⋅12, P < 0⋅01). Meanwhile, enjoyment of food, food responsiveness, desire to drink and emotional undereating scales were not significantly correlated with child's BMI (see Table 4).
Descriptive mean score and internal reliability of the scales
The internal reliability of the scales, measured with Cronbach's α, ranged from 0⋅50 to 0⋅79. All the scales scored higher than 0⋅70, except for food responsiveness and slowness in eating. Most of the subscales scored close to the midpoint (2⋅5). Emotional overeating (mean: 1⋅24, sd: 0⋅02) and food responsiveness (mean: 1⋅83, sd: 0⋅03) had the lowest scores, while satiety responsiveness (mean: 3⋅57, sd: 0⋅04) had the highest score (see Table 5).
Table 5. Children's Eating Behaviour Questionnaire descriptive statistics and internal reliability in Addis Ababa, Ethiopia

Discussion
The present study was conducted with the aim of validating CEBQ among preschool children in Ethiopia. It also has assessed eating behaviour pattern with child's BMI among preschoolers in Ethiopia. We found that the CEBQ evidenced a reasonable fit to the data based on the CFA results, indicating that an eight-factor structure was the best solution for our sample corresponding to the original study in the UK(Reference Wardle, Guthrie and Sanderson9). The Ethiopian version of CEBQ has also shown a correlation with child's BMI scores and a good internal reliability except for food responsiveness and slowness in eating scales.
The CFA reveals that the eight-factor structure is suitable for our sample, which was similar to other studies conducted in developing countries such as Indonesia(Reference Purwaningrum, Arcot and Hadi11) – the original eight-factor structure of the CEBQ showed adequate content validity and recommended that this too, can be used for all preschool children living in low- and middle-income countries. A study in Thailand(Reference Sirirassamee and Hunchangsith32) also supported the cross-cultural utility of the CEBQ as a tool in the assessment of children. Studies from more developed countries such as Iceland(Reference Njardvik, Klar and Thorsdottir33), the USA(Reference Domoff, Miller and Kaciroti10) and Australia(Reference Mallan, Liu and Mehta6) further support the use of the instrument as a measure of the original eight distinct eating style dimensions. Some studies conducted in non-European countries, however, have shown that the eight-factor CEBQ is not suitable. For instance, as noted earlier, a study done in China concluded that although the CEBQ was a valuable psychometric instrument, it may be affected by cultural differences and proposed a seven-factor solution, with factor ‘food responsiveness’ (FR) split into two(Reference Cao, Svensson and Marcus15). Furthermore, two cohort studies from Singapore also revealed a revised six-factor structure and a revised seven-factor structure of the CEBQ were more appropriate for examining appetitive traits in children aged 3–6 years(Reference Quah, Fries and Chan29,Reference Quah, Cheung and Pang30) . The reason for the observed difference might be due to the type of analysis used to determine the validity as most of the studies conducted in different parts of the world have used explanatory factor analysis/PCA(Reference Svensson, Lundborg and Cao13,Reference Cao, Svensson and Marcus15,Reference Santos, Ho-Urriola and González34) . Another study, however, has implied that CFA is considered to be a more accurate examination of the structure of the data and variable correlations than PCA(Reference Kim27). Furthermore, establishing the number of discrete constructs a scale measures are of fundamental importance given that combining possibly discrete subscales into one decreases the sensitivity of the CEBQ which has implications for its usefulness in detecting problematic eating behaviours and measuring treatment gains(Reference Njardvik, Klar and Thorsdottir33). The other reason might be related to the sample size. Any factor analysis needs an adequate sample size and some studies in non-European countries have relatively small samples, which might jeopardise the accuracy of the results of the factor structure.
This version of CEBQ differed from the original eight-factor model mainly on some item factor loadings. For instance, item 3 ‘My child has a big appetite’ was loaded on the enjoyment of food scale. Even though this item is typically considered a satiety responsive item, on the original tool, we found that it was best loaded on the enjoyment of food scale. The rationale for this was that besides having a relatively better loading coefficient, is that caregivers interpreted this item as child being easy to feed and, therefore, enjoying their food(Reference Quah, Cheung and Pang30). This issue is similar to other studies, where this item was merged with the enjoyment of food scale(Reference Quah, Fries and Chan29,Reference Quah, Cheung and Pang30) . In addition, item 23 ‘My child eats more when s/he has nothing else to do’ was loaded on food responsiveness when it originally belonged to the emotional overeating scale. This was in line with another study from the USA where this item was placed on the food responsiveness scale(Reference Domoff, Miller and Kaciroti10). Other studies have also commonly reported items from the emotional overeating subscale combined with the items from the food responsiveness subscale(Reference Svensson, Lundborg and Cao13,Reference Quah, Cheung and Pang30) . This might be due to the interpretation of the item since caregivers, considered eating when bored to be different from emotional eating behaviours(Reference Hayman, Lee and Miller35) and mostly relate this item to child's food responsive behaviour of overeating(Reference Sleddens, Kremers and Thijs12,Reference Quah, Cheung and Pang30) . It may also be related to caregiver's inability to assess if their children ate more when feeling certain emotions as evidenced by the low mean score reported in this study.
The other pertinent finding is our convergent validity test, revealing that the emotional overeating scale is the only food approach behaviour that has a significant positive relation to child's BMI score. This is in line with studies conducted in Portugal(Reference Viana, Sinde and Saxton36) and Chile(Reference Santos, Ho-Urriola and González34) where emotional overeaters tend to eat more during negative emotional states(Reference Wardle, Guthrie and Sanderson9) and are more prone to become overweight. However, some studies have found no association between emotional overeating and BMI score(Reference Svensson, Lundborg and Cao13,Reference Quah, Fries and Chan29) , suggesting that eating triggered by emotional stress may not be accurately perceived by parents in children at younger ages, and associations with weight might only emerge at later time points(Reference Quah, Fries and Chan29).
The other interesting finding is that satiety responsiveness and slowness in eating scale are significantly related to a lower child's BMI score. This is similar to findings from Singapore(Reference Quah, Fries and Chan29,Reference Quah, Cheung and Pang30) , Portugal(Reference Viana, Sinde and Saxton36) and Australian(Reference Mallan, Liu and Mehta6) studies. This shows that children that are satiety responsive and that tend to eat more slowly have a lower weight status. This indicates that eating behaviours contribute to poor nutritional status among children particularly in our study area. Indeed, a recent study conducted in Addis Ababa revealed a high prevalence of stunting (19⋅6 %) and wasting (3⋅2 %) among preschool children(Reference Berhane, Jirström and Abdelmenan23). Some studies, however, have found no association between child's BMI scores and any of the scales(Reference Svensson, Lundborg and Cao13,Reference Cao, Svensson and Marcus15) . Many developing countries such as Ethiopia are currently facing a double burden of malnutrition. Thus, it is essential to include examples of healthy eating behaviours in national nutritional programmes to improve the nutritional status of children.
The factor-to-factor correlation test showed that none of the correlations is high enough (r ≥ 0⋅8) to show any overlap of factors, thereby disclaiming the existence of construct redundancy and supporting the theoretical link between constructs in CEBQ(Reference Njardvik, Klar and Thorsdottir33). CEBQ subscales that belong to the two categories of food approach and food avoidance indicate a significant positive correlation with those in the same category and a negative correlation with those with a different category except the desire to drink. This is similar to findings from Portugal(Reference Viana, Sinde and Saxton36) and Sweden(Reference Svensson, Lundborg and Cao13). Our reliability test found that all the scales have a good reliability score, except for food responsiveness and slowness in eating scales. The reason for the low α might be because Cronbach α is quite sensitive to the number of items in the scale which have been seen in other similar studies(Reference Cao, Svensson and Marcus15,Reference Santos, Ho-Urriola and González34) . It is common to find scales with quite low Cronbach values when the items are less than 10(Reference Pallant37). Future studies should further check the applicability and sensitivity to the cultural difference of the above scales.
The present study has significant strengths, including (1) an adequate sample size with the use of probability sampling techniques and (2) the use of standardisation protocols for anthropometric measurements, which help obtain accurate and precise anthropometric measurements and reduces errors. However, there are limitations to the present study that should be considered. First, the study's cross-sectional nature hinders the inference of causal conclusions between children's eating behaviour and their BMI score as it was only assessed on one occasion. Second, social desirability bias cannot be ruled out since the measurements were based on the caregivers’ self-reporting rather than direct observation of children's eating behaviour. Additionally, caregivers may respond differently in an interview, v. self-administered anonymous questionnaire. Further replication of the study among low-income countries is essential to improve our concept of eating behaviours.
Conclusion
The present study validates the CEBQ among sub-Saharan African countries, specifically Ethiopia. The CEBQ evidenced a reasonable fit to the data based on the CFA results which support the eight-factor structure in a sample of caregivers reporting behaviours of preschool-aged children. The Ethiopian version of CEBQ scales has also demonstrated convergent validity as expected with children's BMI z-scores and a good internal reliability, except for food responsiveness and slowness in eating scales.
Acknowledgements
We acknowledge Addis Ababa City Administration Education Bureau, the preschools in each sub-city and the parents/caregivers of the children for their participation throughout this study.
This research received no specific grant from any funding agency, commercial or not-for-profit sector.
N. W. G., S. H. G., H. Y. H., E. H. and D. S. A. designed the study. N. W. collected and analysed the data and drafted the manuscript. All the authors contributed to analysing and assessing the findings. All the authors contributed substantially to drafting the manuscript. They also critically revised and approved the final manuscript.
The authors have no conflict of interest to declare.


 Open access