


Worldwide, the number of people with diabetes is rising. In 2014, the estimated prevalence among adults was 8·5 %, which is approximately double the prevalence of 4·7 % in 1980( Reference Rolic 1 ). Due to its prevalence and associated complications, diabetes is a well-recognised public health concern( 2 ). Overweight and obesity are the strongest risk factors for type 2 diabetes (T2D), though lifestyle and dietary modification also are recognised strategies that may delay or prevent development of the disease.
Controversy and uncertainty have been expressed within the scientific community as to what effect, if any, 100 % fruit juice may have on health including risk for diabetes( Reference Mozaffarian 3 ). Pure (100 %) fruit juices can be nutrient-dense foods providing K, Mg, folate, Ca, vitamins A and C, and soluble fibre as well as an array of bioactive substances including carotenoids and flavonoids( Reference Li, Andrews and Pehrsson 4 – Reference Rampersaud 6 ). Nutritional guidance encourages consumption of fruit as part of a balanced and healthy diet, although guidance often recommends limited consumption of fruit in the form of juice citing concerns over a lack of fibre and the potential for excessive energy intake( 7 ). Juices also tend to have moderately high-glycaemic index ratings( Reference Atkinson, Foster-Powell and Brand-Miller 8 ), indicating a relatively rapid and high post-prandial glucose response as compared with foods with a lower glycaemic index, and diets lower in these types of simple carbohydrates may be relevant for the prevention and management of some chronic diseases including T2D( Reference Augustin, Kendall and Jenkins 9 ). However, results from in vitro and animal studies suggest that polyphenols may favourably affect glucose–insulin homeostasis through a variety of mechanisms( Reference Hanhineva, Torronen and Bondia-Pons 10 ). The net effect of 100 % fruit juice on glucose metabolism and biomarkers of diabetes therefore reflects a complex interplay of numerous factors.
Results from human studies of associations between 100 % fruit juice consumption and risk of T2D or effects on diabetes biomarkers have been conflicting. A recent meta-analysis of thirteen prospective cohorts reported no association between consumption of fruit juice and incident T2D( Reference Imamura, O'Connor and Ye 11 ). When further adjusted for obesity, the meta-analysis showed a 7 % increased risk for incident T2D, though the presence of significant heterogeneity limits the quality of this evidence( Reference Imamura, O'Connor and Ye 11 ).
No meta-analysis of randomised controlled trials (RCT) with a specific focus on 100 % fruit juices has been identified. Wang et al. ( Reference Wang, Liu and Mi 12 ) reported finding no significant effect on glycaemic control and blood insulin in a meta-analysis of twelve RCT collectively described as 100 % fruit juice. The analysis included studies using juice products other than 100 % fruit juice( Reference Wang, Liu and Mi 12 ), namely beverages prepared from freeze-dried whole fruit which provided a substantial source of dietary fibre( Reference Basu, Fu and Wilkinson 13 , Reference Basu, Du and Leyva 14 ), beverages prepared from fruit juice sweetened using no-energy sweeteners( Reference Basu, Betts and Ortiz 15 , Reference Dohadwala, Holbrook and Hamburg 16 ), and a study in which both the test and control beverages were prepared from 100 % fruit juice( Reference Reshef, Hayari and Goren 17 ). The identified meta-analysis therefore was not exclusively based on RCT of 100 % fruit juice compared with a non-juice control. Several years have passed since completion of the meta-analysis and recent clinical trials examining the effects of 100 % fruit juice consumption on glucose–insulin homeostasis provide further insight into the role of juice on biomarkers of diabetes risk.
The purpose of the present study was to systematically review the literature to identify RCT in which effects of 100 % fruit juice on measures of glucose control and insulin sensitivity have been examined and, based on the totality of evidence, to re-evaluate in a meta-analysis the effects of 100 % fruit juice on these biomarkers for diabetes risk.
Methods
Literature search and study selection
The present systematic review and meta-analysis followed the Preferred Reporting Items for Systematic Reviews and Meta-Analyses (PRISMA) statement( Reference Moher, Aliberati and Tetzlaff 18 ). A comprehensive literature search was conducted to identify clinical studies examining the relationship between the consumption of 100 % fruit juice and measures of glucose–insulin homeostasis, with no exclusions based on age, ethnicity or health status of the study population. A pre-specified protocol is not available for this study. The search of PubMed was conducted with terms (juice[TIAB] OR juices[TIAB]) AND (‘controlled trial’ OR ‘clinical trial’ OR crossover OR cross-over OR random*) with no limits other than English-language papers. The search of EMBASE was conducted using similar terms. Terms for specific measures of glucose control or insulin sensitivity were not included in the search string to allow for identification of studies in which measures of interest were collected as secondary outcomes or in the course of routine patient monitoring. The initial search was conducted on 23 March 2015, and searches were updated on 14 April 2016. Supplemental literature searches included review of reference lists in relevant studies and pertinent review articles and correspondence with researchers in the field.
The search results were screened independently by two investigators (M. M. M., E. C. B.) for eligible studies and discrepancies were resolved by consensus. Clinical trials were eligible if the following criteria were met: (1) the trial was randomised and conducted in human subjects; (2) the trial was a controlled intervention providing 100 % fruit juice and a control beverage (e.g. sugar/carbohydrate or energy-matched beverage, water, or no beverage); (3) the fruit juice consumed was identified as 100 % fruit juice (including single-strength juice prepared from concentrate or a blend of 100 % fruit juices) or any juice specified by name such as, but not limited to, apple, blueberry, cherry, cranberry, grape, grapefruit, orange, pear, pomegranate or strawberry juice; (4) subjects consumed 100 % fruit juice for a minimum of 2 weeks; (5) outcome data for at least one measure of glucose control or insulin sensitivity were reported; and (6) reported outcomes included change from baseline values or baseline and endpoint values with error terms. Tomato juice was not included as a fruit juice in this analysis as it is typically marketed as a vegetable juice.
Data extraction
All eligible studies were reviewed and pertinent data were extracted, including: name of the first author, publication year, study design, geographic location of the intervention, demographic and health characteristics of the study population (e.g. age, sex, presence of obesity or a chronic disease, BMI), sample size, intervention duration, juice type, a description of the control product, and outcomes measured. Additional data extracted from the studies included sugar content of the 100 % fruit juice and control beverages, volume of juice consumed per d, baseline fasting blood glucose level, information on randomisation, double-blinding, and withdrawals and dropouts to develop quality scores of each study based on the Jadad criteria( Reference Jadad, Moore and Carroll 19 ). Information on funding was reviewed to determine if the research was completed with support from industry funding, including donation of study product. Data extraction was completed independently by one investigator and reviewed for accuracy by another (M. M. M. and E. C. B. or K. A. B.). The extracted information included that provided by study investigators in response to requests for missing data and study details( Reference Cerdá, Soto and Albaladejo 20 – Reference Tjelle, Holtung and Bohn 23 ). Fasting blood glucose, fasting blood insulin, the homeostatic model assessment of insulin resistance (HOMA-IR), glycosylated Hb (HbA1c) and other reported measures of glucose–insulin homeostasis (oral glucose tolerance test, insulinogenic and Matsuda indices) were captured as change from baseline or as baseline and post-intervention values. Fasting glucose values were converted to mmol/l assuming 1 mg/dl = 0·05551 mmol/l. Fasting insulin values were converted to pmol/l assuming 1 µU/ml = 6·0 pmol/l( Reference Marcovina, Bowsher and Miller 24 ).
Statistical analysis
A meta-analysis was conducted to quantify the effects of consumption of 100 % fruit juice on each measure of glucose control or insulin sensitivity reported in at least three studies. The meta-analysis evaluated the mean difference from baseline and end of treatment values between the 100 % juice treatment and control group of fasting blood glucose, fasting blood insulin, HOMA-IR and HbA1c. The I 2 statistic was used to assess statistical heterogeneity between studies.
For studies not reporting the change from baseline to the end of intervention in both the treatment and control groups, the mean difference was calculated as (Treatmentend − Treatmentbaseline) − (Controlend − Controlbaseline). The method described by Curtin et al. ( Reference Curtin, Altman and Elbourne 25 ) was used to estimate the mean difference and associated standard error from the combined parallel and cross-over studies. A pooled estimate of the variance of the mean difference was estimated for each study. For parallel studies, the estimate was derived using the reported estimates of the standard errors or the calculated standard errors as derived from the reported CI estimates. For cross-over studies when estimates of the standard deviation (or standard error) were only available for baseline and post-intervention measurements, the pooled variance was estimated using standard errors for the intervention and control groups and an imputed correlation coefficient of 0·5( Reference Follmann, Elliott and Suh 26 , Reference Higgins and Green 27 ) following the approach described by Higgins & Green( Reference Higgins and Green 27 ). The correlation coefficient (0·5) assumed in the derivation was similar to the average coefficient derived from a study in which variances were provided for baseline, treatment end, and change from baseline measures of fasting blood glucose and HOMA-IR; the correlation coefficient for fasting blood insulin derived from this study was 0·7( Reference Sohrab, Nasrollahzadeh and Zand 28 ). Hence, a sensitivity analysis assuming a correlation coefficient of 0·7 was conducted for fasting blood insulin.
A random-effects model was used to determine the mean and 95 % CI of differences in changes from baseline between 100 % juice and control groups. The approach described in DerSimonian & Laird( Reference DerSimonian and Laird 29 ) was used to conduct the random-effects model. Stratified analyses by study characteristics were planned a priori to investigate sources of heterogeneity and univariate meta-regressions were conducted for further investigation. For each of the biomarkers of diabetes, analyses were conducted for type of fruit juice (apple, berry, blend, citrus, grape, pomegranate), type of control beverage (beverage matched for carbohydrate or sugar and/or energy, beverage without carbohydrate or sugar and/or energy, no beverage), volume of intervention beverage (as reported in the original studies for the meta-regression analysis, and categorised as ≤250 ml/d, >250 ml/d in the stratified analysis), duration of intervention (as reported in the original studies for the meta-regression analysis, and categorised as 2–7 weeks, ≥8 weeks in the stratified analysis), baseline fasting blood glucose (<5·6 mmol/l, ≥5·6 mmol/l), location of study (North America, Europe, Asia), study design (parallel, cross-over), outcome (primary, secondary) and Jadad quality score (<4, ≥4). Industry funding (with or without) was also examined in the stratified analysis. Multivariate meta-regressions including all factors with statistically significant (P < 0·05) regression coefficients were planned for subsequent analyses.
Publication bias was assessed for outcomes with more than ten studies by visual examination of funnel plots of the standard error of the mean difference v. the mean difference and the Egger's regression asymmetry test( Reference Egger, Davey Smith and Schneider 30 ). Sensitivity analyses to explore the influence of a single study on each meta-analysis were conducted by computing the meta-analysis estimates, omitting one study at a time. Level of significance was defined as P < 0·05. All statistical analyses were completed with STATA, version 12.1 (StataCorp LLC).
Results
Literature search, study characteristics
A total of eighteen RCT of 100 % fruit juice were eligible for inclusion in the present review (Fig. 1). Characteristics of the eighteen RCT of 100 % fruit juice and measures of glucose control or insulin sensitivity included in the meta-analysis are presented in Table 1 ( 31 ). Two publications provided relevant outcomes from the same clinical trial and results from both publications were captured for the analysis( Reference Sohrab, Nasrollahzadeh and Zand 28 , Reference Sohrab, Angoorani and Tohidi 32 ). In two of the identified studies, results of two comparisons of potential interest were presented( Reference Hollis, Houchins and Blumberg 33 , Reference Ravn-Haren, Dragsted and Buch-Andersen 34 ), though in order to avoid double-counting of studies, one comparison from each was selected for inclusion in the meta-analysis( Reference Hollis, Houchins and Blumberg 33 ). In a parallel-design study of the effects of Concord grape juice, the energy-matched control beverage (v. a no-beverage control) was selected for the control group( Reference Hollis, Houchins and Blumberg 33 ). In a cross-over study providing clear or cloudy apple juice within two of the five study arms( Reference Ravn-Haren, Dragsted and Buch-Andersen 34 ), clear apple juice was selected for the test group as this type of juice is assumed to be more commonly consumed.
Fig. 1. Flow diagram of study selection process. HOMA-IR, homeostatic model assessment of insulin resistance; HbA1c, glycosylated Hb.
Table 1. Characteristics of eighteen randomised controlled trials of 100 % fruit juice included in analysis
M, male; F, female; FBG, fasting blood glucose; FBI, fasting blood insulin; HbA1c, glycosylated Hb; P, primary; COPD, chronic obstructive pulmonary disease; sugar-free bev, beverage without carbohydrate or sugar and/or energy; S, secondary; HOMA-IR, homeostatic model assessment of insulin resistance; HTN, hypertension; sugar bev, beverage matched for carbohydrate or sugar and/or energy; NAFLD, non-alcoholic fatty liver disease; MCI, mild cognitive impairment; T2D, type 2 diabetes.
* Duration = length of dietary intervention for each test or control period.
† When not reported, the amount of sugar provided by the test product was estimated using data from the United States Department of Agriculture National Nutrient Database for the specific type of fruit juice tested( 31 ).
‡ Industry funding includes financial support and/or test products.
§ Juice volume calculated assuming mean body weight of study participants.
Sixteen of the eighteen included trials reported data for fasting blood glucose( Reference Cerdá, Soto and Albaladejo 20 – Reference Tjelle, Holtung and Bohn 23 , Reference Sohrab, Nasrollahzadeh and Zand 28 , Reference Sohrab, Angoorani and Tohidi 32 , Reference Hollis, Houchins and Blumberg 33 , Reference Banini, Boyd and Allen 35 – Reference Tsang, Smail and Almoosawi 43 ), eleven reported fasting blood insulin( Reference González-Ortiz, Martínez-Abundis and Espinel-Bermúdez 21 , Reference Sohrab, Nasrollahzadeh and Zand 28 , Reference Ravn-Haren, Dragsted and Buch-Andersen 34 – Reference Dohadwala, Hamburg and Holbrook 37 , Reference Habauzit, Verny and Milenkovic 39 – Reference Tsang, Smail and Almoosawi 43 ), seven reported HOMA-IR( Reference Sohrab, Nasrollahzadeh and Zand 28 , Reference Codoñer-Franch, López-Jaén and De La Mano-Hernández 36 , Reference Dohadwala, Hamburg and Holbrook 37 , Reference Habauzit, Verny and Milenkovic 39 , Reference Silver, Dietrich and Niswender 42 – Reference Simpson, Mendis and Macdonald 44 ) and three reported HbA1c( Reference Sohrab, Nasrollahzadeh and Zand 28 , Reference Banini, Boyd and Allen 35 , Reference Sumner, Elliott-Eller and Weidner 45 ). Duration of supplementation ranged from 2 weeks to 6 months, with the majority of studies providing the intervention for a period of 8 weeks or more. The studies were predominantly conducted in Europe (n 8) or North America (n 7), with the remaining three studies conducted in Asia (n 3).
All but five studies included a test and control arm; four studies included three arms( Reference Tjelle, Holtung and Bohn 23 , Reference Hollis, Houchins and Blumberg 33 , Reference Morand, Dubray and Milenkovic 41 , Reference Silver, Dietrich and Niswender 42 ) and one study included five arms( Reference Ravn-Haren, Dragsted and Buch-Andersen 34 ). Although all studies were controlled, the type of control beverage provided varied across studies. Across the eighteen studies, twelve indicated some level of industry funding including financial support and/or test products.
Six studies had a Jadad score of ≥4( Reference Tjelle, Holtung and Bohn 23 , Reference Sohrab, Nasrollahzadeh and Zand 28 , Reference Sohrab, Angoorani and Tohidi 32 , Reference Hollis, Houchins and Blumberg 33 , Reference Dohadwala, Hamburg and Holbrook 37 , Reference Habauzit, Verny and Milenkovic 39 , Reference Sumner, Elliott-Eller and Weidner 45 ), while the remaining trials (twelve of eighteen) had a Jadad score of <4. As shown in Table 2, each study was identified by the investigators as a randomised study, though only five provided the methods of random sequence generation. Eleven of the studies were reported to be double-blind, and eight of these detailed a method regarded as appropriate within the Jadad criteria. The remaining eight studies were open label or single blind. Descriptions of study withdrawals, including both the number and reason, were provided in fourteen of the eighteen studies. No studies described inappropriate randomisation or double-blinding methods. High risk for attrition bias was identified in three studies and a cross-over study with an unspecified washout period between treatments presented unclear risk for bias.
Table 2. Jadad scores of study quality and major sources of potential bias by study
* Yes, 1; no, 0.
† Appropriate, 1; inappropriate, −1; not specified, 0.
Effect of 100 % fruit juice on fasting blood glucose
In the meta-analysis of fasting blood glucose data reported in sixteen RCT, consumption of 100 % fruit juice had no significant effect on fasting blood glucose compared with the control treatment (−0·13 (95 % CI −0·28, 0·01) mmol/l; P = 0·07) (Fig. 2); there was moderate to high heterogeneity among the studies (P < 0·01, I 2 = 70·6). Stratified analyses (Table 3) used to evaluate potential sources of heterogeneity resulted in mean difference estimates ranging from −0·70 to 0·20. Associations that were statistically significant in stratified analyses included an intervention of 2–7 weeks (−0·20 (95 % CI −0·38, −0·08) mmol/l; P = 0·03, I 2 = 57·0), and studies with a Jadad score of <4 (−0·23 (95 % CI −0·43, −0·03) mmol/l; P = 0·03, I 2 = 74·8); in both of these stratified analyses, fasting blood glucose was lowered by consumption of 100 % fruit juice compared with the control group. The only factor with a statistically significant regression coefficient in the univariate meta-regressions was study location; therefore no multivariate meta-regression analyses were conducted.
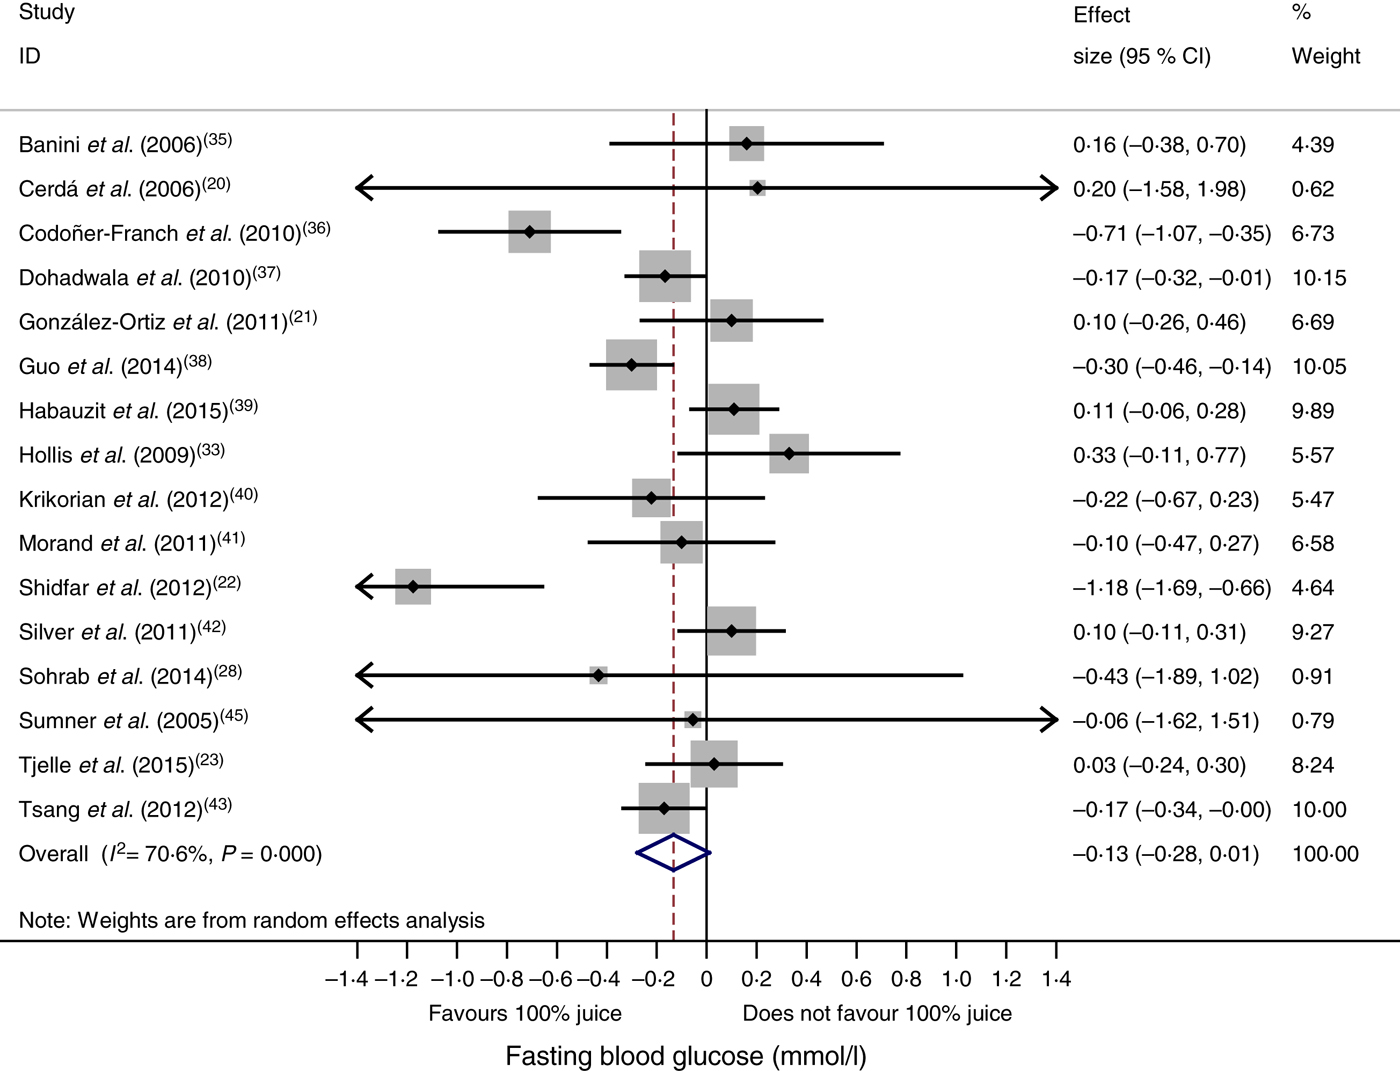
Fig. 2. Meta-analysis of the effects of 100 % fruit juice on fasting blood glucose. Square values represent the mean difference of fasting blood glucose values (mmol/l) based on a random-effects model; 95 % confidence intervals are represented by horizontal lines. Square size is proportional to the weight of each study. The diamond represents the pooled estimate of mean differences (P = 0·07).
Table 3. Stratified analyses of effects of 100 % fruit juice on fasting blood glucose (FBG)
RC, regression coefficient; sugar bev, beverage matched for carbohydrate or sugar and/or energy; sugar-free bev, beverage with non-energy-containing or no added sweetener.
Effect of 100 % fruit juice on fasting blood insulin
Compared with the control treatment, consumption of 100 % fruit juice had no significant effect on fasting blood insulin (−0·24 (95 % CI −3·54, 3·05) pmol/l; P = 0·89) with no heterogeneity (P = 0·52, I 2 = 0) in the eleven RCT included in the analysis (Fig. 3). Stratified analyses of the effects of 100 % fruit juice on fasting blood insulin resulted in mean difference estimates ranging from −8·50 to 11·6, none of which was statistically significant (Table 4).
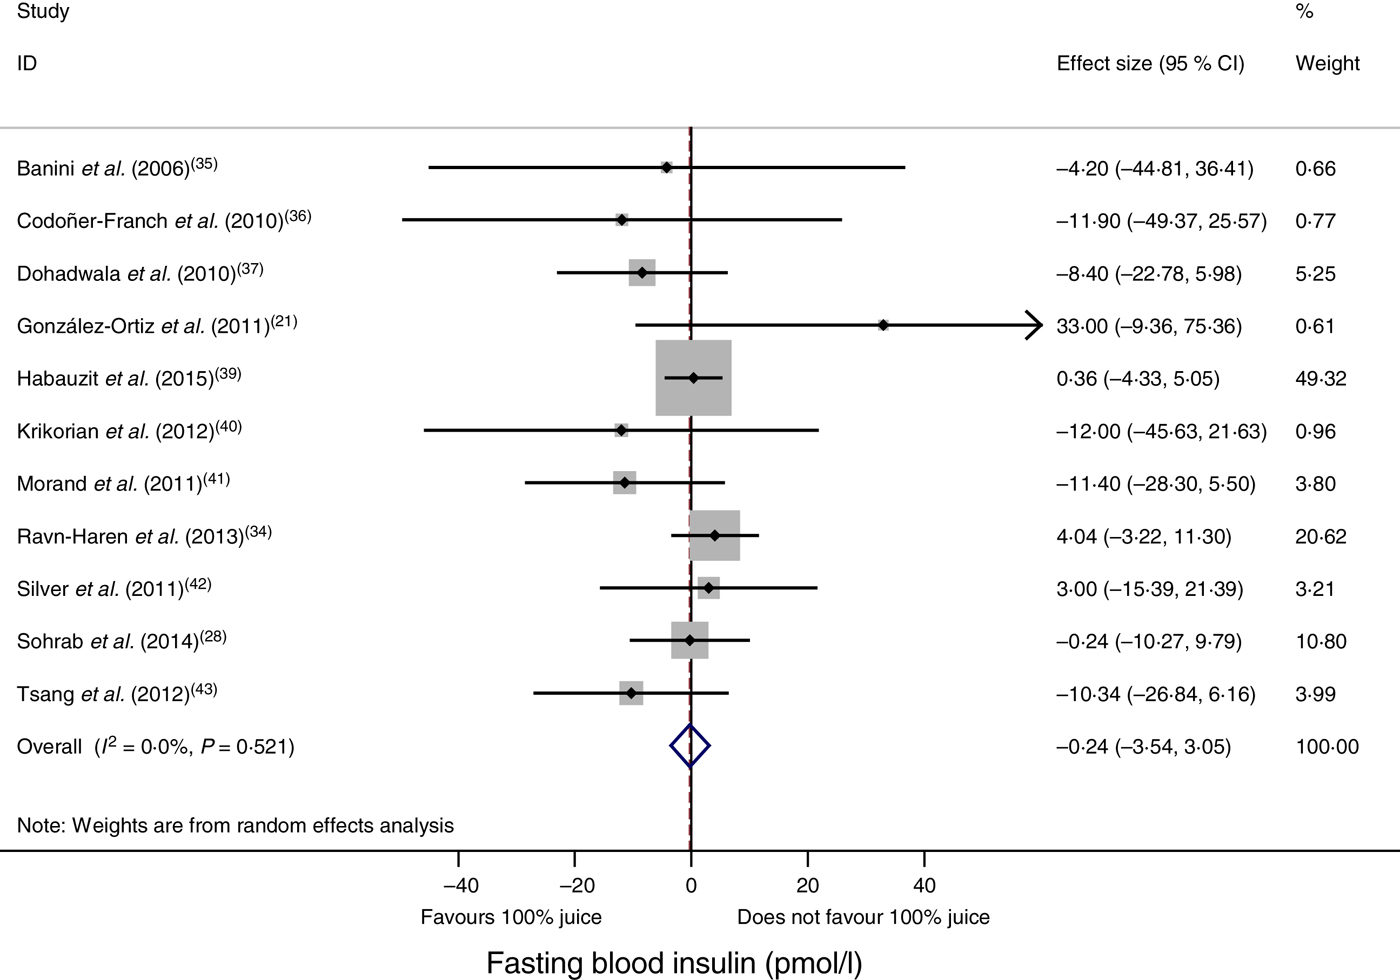
Fig. 3. Meta-analysis of the effects of 100 % fruit juice on fasting blood insulin. Square values represent the mean difference of fasting blood insulin values (pmol/l) based on a random-effects model; 95 % confidence intervals are represented by horizontal lines. Square size is proportional to the weight of each study. The diamond represents the pooled estimate of mean differences (P = 0·89).
Table 4. Stratified analyses of effects of 100 % fruit juice on fasting blood insulin
RC, regression coefficient; sugar bev, beverage matched for carbohydrate or sugar and/or energy; sugar-free bev, beverage with non-energy-containing or no added sweetener; FBG, fasting blood glucose.
Effect of 100 % fruit juice on insulin resistance
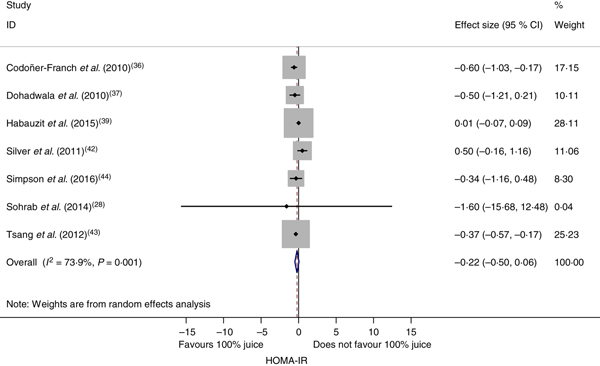
The effect of 100 % fruit juice on HOMA-IR was not significant (−0·22 (95 % CI −0·50, 0·06); P = 0·13) with moderate to high heterogeneity (P < 0·01, I 2 = 73·9) (Fig. 4). Stratified analyses resulted in mean difference estimates ranging from −1·60 to 0·50 (Table 5). In stratified analyses, HOMA-IR was significantly lower in the 100 % fruit juice groups compared with the control group in studies in which pomegranate juice was consumed (−0·37 (95 % CI −0·57, −0·18); P < 0·005, I 2 = 0) or intervention duration was 2–7 weeks (−0·41 (95 % CI −0·59, −0·23); P < 0·005, I 2 = 0). In the univariate meta-regressions, only volume of juice intervention showed a statistically significant inverse association with change in HOMA-IR (regression coefficient = −0·002; P = 0·01).
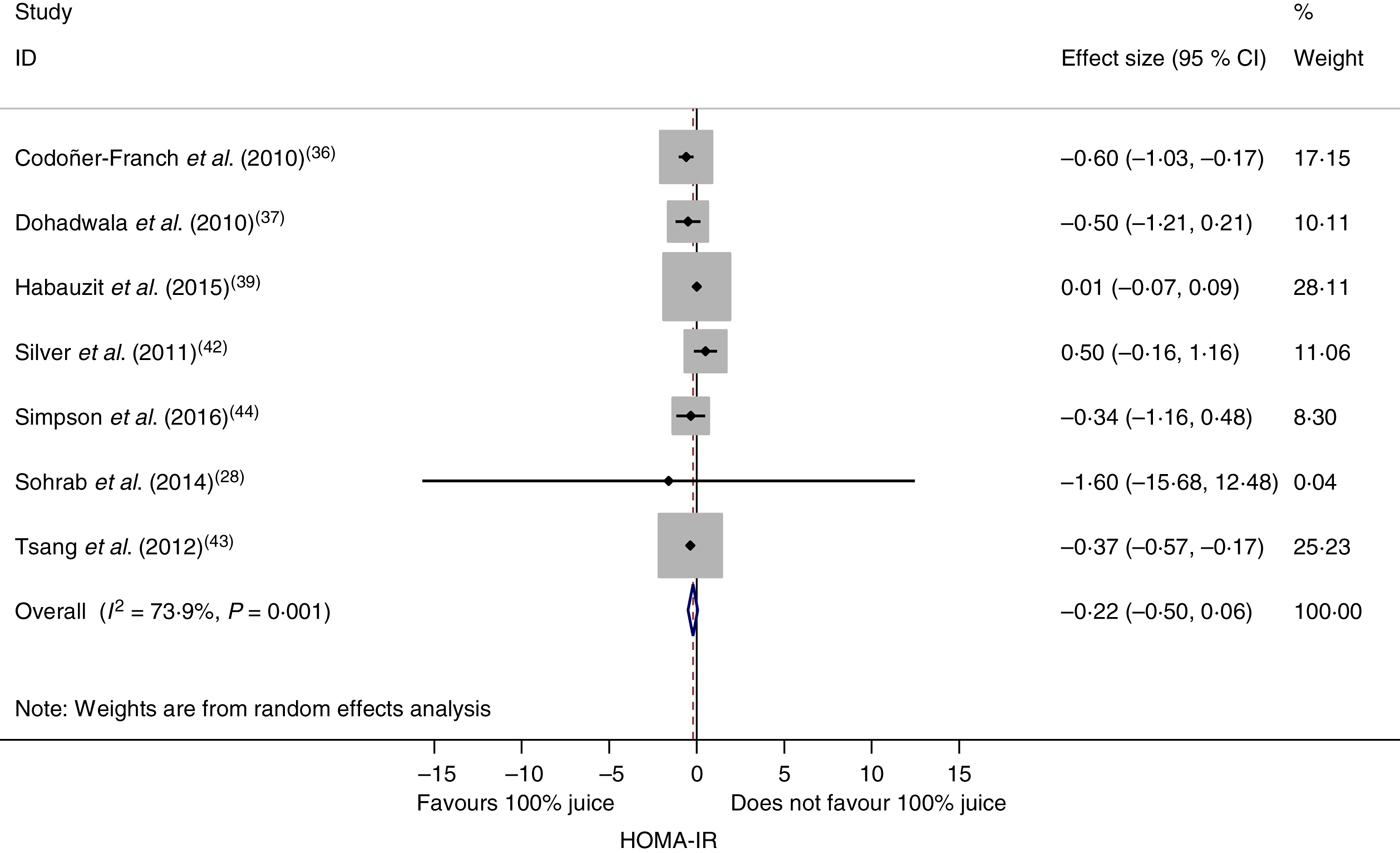
Fig. 4. Meta-analysis of the effects of 100 % fruit juice on the homeostatic model assessment of insulin resistance (HOMA-IR). Square values represent the mean difference of the HOMA-IR index based on a random-effects model; 95 % confidence intervals are represented by horizontal lines. Square size is proportional to the weight of each study. The diamond represents the pooled estimate of mean differences (P = 0·13).
Table 5. Stratified analyses of effects of 100 % fruit juice on the homeostatic model assessment of insulin resistance
RC, regression coefficient; sugar bev, beverage matched for carbohydrate or sugar and/or energy; sugar-free bev, beverage with non-energy-containing or no added sweetener; FBG, fasting blood glucose.
Effect of 100 % fruit juice on glycosylated Hb
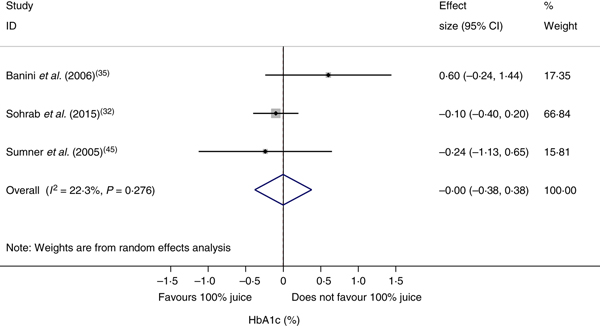
The effect of 100 % fruit juice on HbA1c was not significant (−0·001 (95 % CI −0·38, 0·38) %; P > 0·99) with low heterogeneity (P < 0·01, I 2 = 22·3) (Fig. 5). Stratified analyses resulted in mean difference estimates ranging from −0·11 to 0·60 (Table 6). No statistically significant associations were observed in the stratified analyses or univariate meta-regressions.

Fig. 5. Meta-analysis of the effects of 100 % fruit juice on glycosylated Hb (HbA1c; %). Square values represent the mean difference of HbA1c values based on a random-effects model; 95 % confidence intervals are represented by horizontal lines. Square size is proportional to the weight of each study. The diamond represents the pooled estimate of mean differences (P = 1·00).
Table 6. Stratified analyses of effects of 100 % fruit juice on glycosylated Hb (%)
RC, regression coefficient; sugar bev, beverage matched for carbohydrate or sugar and/or energy; sugar-free bev, beverage with non-energy-containing or no added sweetener; FBG, fasting blood glucose.
Publication bias
The potential for publication bias was investigated through visual inspection of funnel plots for analyses with a sufficient number of studies, namely fasting blood glucose and fasting blood insulin. Visual inspection of funnel plots for fasting blood glucose showed that all but three studies( Reference Shidfar, Heydari and Hajimiresmaiel 22 , Reference Codoñer-Franch, López-Jaén and De La Mano-Hernández 36 , Reference Guo, Zhong and Liu 38 ) fell inside the funnel. These three studies had relatively smaller mean difference estimates indicative of statistically significant beneficial effects of the intervention beverages. Sensitivity analyses in which each study was removed from the analysis individually or all three simultaneously resulted in a mean difference that was still negative and not significantly different from zero (data not shown), thus suggesting no publication bias. Results from the Egger's test supported this conclusion for both fasting blood glucose and insulin (Fig. 6; P = 0·80 and 0·38, respectively).
Fig. 6. Funnel plots with pseudo 95 % confidence limits for detection of publication bias among randomised controlled trials examining fasting blood glucose (a) and fasting blood insulin (b). For fasting blood glucose, P value for Egger's test = 0·80. For fasting blood insulin, P value for Egger's test = 0·38.
Sensitivity analysis
Sensitivity analyses that excluded individual RCT resulted in estimates similar to values derived from all studies, although some mean differences became statistically significant. In the case of fasting blood glucose, omission of either of three studies( Reference Hollis, Houchins and Blumberg 33 , Reference Habauzit, Verny and Milenkovic 39 , Reference Silver, Dietrich and Niswender 42 ) resulted in overall mean difference estimates that were statistically significant and indicative of a beneficial effect of 100 % fruit juice consumption (mean difference of −0·16; 95 % CI −0·31, −0·005). The effects of 100 % fruit juice on fasting blood insulin or HOMA-IR were not found to be sensitive to any particular study included in the meta-analysis. The sensitivity analysis conducted for fasting blood insulin assuming a correlation coefficient of 0·7 in the derivation of the pooled variance for cross-over studies showed no significant effect of 100 % fruit juice on fasting blood insulin (results not shown).
Discussion
The present systematic review and meta-analysis provides a comprehensive, quantitative assessment of the relationship between 100 % fruit juice and measures of glycaemic control. Results from this meta-analysis of eighteen RCT show no significant effect of 100 % fruit juice on fasting blood glucose, fasting blood insulin, insulin resistance as evaluated by HOMA-IR or HbA1c. Additionally, results of stratified analyses confirm the lack of consistent associations between 100 % fruit juice consumption and these markers for diabetes. The absence of any clear adverse or beneficial effect of 100 % fruit juice on markers of diabetes in the present meta-analysis of available RCT suggests a largely neutral role of 100 % fruit juice on glucose–insulin homeostasis.
The findings of the present meta-analysis are generally consistent with a 2014 meta-analysis by Wang et al.( Reference Wang, Liu and Mi 12 ). Overall, seven studies were included in both the previous and the present meta-analysis( Reference Cerdá, Soto and Albaladejo 20 , Reference González-Ortiz, Martínez-Abundis and Espinel-Bermúdez 21 , Reference Hollis, Houchins and Blumberg 33 , Reference Banini, Boyd and Allen 35 , Reference Dohadwala, Hamburg and Holbrook 37 , Reference Morand, Dubray and Milenkovic 41 , Reference Sumner, Elliott-Eller and Weidner 45 ). The eleven additional trials included in the present analysis reflect recent additions to the literature as well as studies not captured by Wang et al. ( Reference Wang, Liu and Mi 12 ). As in the present analysis, no significant effect on glycaemic control measured by fasting glucose, fasting insulin or HbA1c was reported in the meta-analysis of studies identified as 100 % fruit juice by Wang et al. ( Reference Wang, Liu and Mi 12 ). In contrast to the present analysis in which no effect of 100 % fruit juice on HOMA-IR was found, a significant increase in HOMA-IR was reported by Wang et al. ( Reference Wang, Liu and Mi 12 ) based on data from three trials, only one of which was considered eligible for the present meta-analysis( Reference Sumner, Elliott-Eller and Weidner 45 ). The other two HOMA-IR values in the meta-analysis by Wang et al. ( Reference Wang, Liu and Mi 12 ) include a value from a study not meeting our inclusion criteria( Reference Dohadwala, Holbrook and Hamburg 16 ), and a value attributed to the trial by Sumner et al. ( Reference Sumner, Elliott-Eller and Weidner 45 ) which was neither reported in that paper nor noted as sourced from the study authors. The value attributed to Sumner accounted for 78 % of the weighted mean HOMA-IR in the meta-analysis by Wang et al.( Reference Wang, Liu and Mi 12 ), and therefore largely explains the difference between the previous and present analyses. Findings from the present meta-analysis of RCT on markers for diabetes are also consistent with findings from a meta-analysis of prospective cohorts showing that consumption of 100 % fruit juice is not associated with increased risk of T2D( Reference Xi, Li and Liu 46 ) and findings from a more recent meta-analysis of cohorts in which diabetes was clinically verified( Reference Imamura, O'Connor and Ye 11 ).
Stratified analyses were conducted as part of the present meta-analysis to investigate specific conditions that may adversely or beneficially affect glucose–insulin homeostasis. The stratifications included parameters to differentiate among the juice intervention, study population and study characteristics. Consistent with the primary findings, results from the stratified analyses showed no significant effect of 100 % fruit juice on fasting blood insulin and HbA1c, though results of both analyses, and in particular HbA1c, were limited by the small number of studies. Stratified analyses of fasting blood glucose showed a significantly greater reduction from baseline with 100 % fruit juice compared with the control in trials with an intervention duration of 2–7 weeks and trials with a Jadad score <4. The significant effect observed in shorter studies could reflect higher compliance by study participants over a shorter study intervention. However, a cross-tabulation of the studies with fasting blood glucose data by these two factors reveals that all studies with a shorter duration of intervention (2–7 weeks) also had a Jadad score <4, which is an indicator of a lower methodological quality trial. As detailed in the review of Jadad scores by studies (Table 2), many of the RCT suggesting a beneficial effect of 100 % fruit juice on fasting blood glucose had one or more major sources of potential bias, and in particular high or unclear performance bias. Findings in the stratified analyses therefore provide some though limited support for a beneficial effect of fruit juice on fasting blood glucose. Stratified analyses of HOMA-IR also showed a significantly greater reduction from baseline with 100 % fruit juice compared with the control in trials with an intervention duration of 2–7 weeks, and additionally in trials with pomegranate juice. The significance of these findings also is limited, as each analysis was based on data from only two studies and did not notably reduce heterogeneity. The inverse association of volume of 100 % fruit juice with HOMA-IR identified in univariate meta-regressions also is an indicator of potentially beneficial effects of 100 % fruit juice, albeit very small as evidenced by the relatively small regression coefficient.
A variety of juices was provided as test beverages across the studies and the types and concentrations of some bioactives in fruit juice vary across fruit juice type. For example, pomegranate juice is a unique source of ellagitannins, including punicalagins( Reference Tzulker, Glazer and Bar-Ilan 47 ). Among citrus juices, grapefruit juice is a concentrated source of naringin while the primary flavonoid in orange juice is hesperidin( Reference Nogata, Sakamoto and Shiratsuchi 48 , Reference Bhagwat, Haytowitz and Holden 49 ). Cranberries are a source of polyphenols including procyanidins, anthocyanins, quercetin and myricitrin( Reference Vvedenskaya, Rosen and Guido 50 ), the primary anthocyanins in many grape juices are glucosides of cyanidin or delphinidin( Reference Bhagwat, Haytowitz and Holden 49 , Reference Xu, Simon and Welch 51 ), and apple juice is a source of quercetin( Reference Bhagwat, Haytowitz and Holden 49 , Reference Xu, Simon and Welch 51 ). The amount of fruit juice consumed during the dietary interventions was also highly variable, with juice intake of approximately two cups or more (480 to 595 ml) per d in nine of the interventions and one cup or less in six studies (<250 ml). The amount of sugars provided by the juices ranged from 22 to 97 g. The ‘100 % fruit juice’ category therefore represents a heterogeneous food group and differences in the type and composition of fruit juices may be important when considering the physiological effects of fruit juice, including effects on glycaemic control and insulin sensitivity. Stratified analyses, however, showed no clear differences across categorisations and heterogeneity was not notably reduced.
The RCT of 100 % fruit juices identified in the present review also used a variety of control products, including energy-containing beverages matched for sugar or carbohydrate content, sugar-free beverages containing non-energy-containing sweeteners or only water, and, in some studies, no beverage. Peluso & Palmery( Reference Peluso and Palmery 52 ) have noted that selection of an appropriate placebo in studies of the postprandial response to fruit juice is critical, with energy and sugar-matched beverages (including proportions of glucose and fructose) providing an appropriate control to assess the effects of bioactives in juice, and a water beverage providing an appropriate control to assess the effects of juice as a whole( Reference Peluso and Palmery 52 ). Stratified analyses of fasting blood glucose by these control group comparisons did not result in significant effects, suggesting that neither the non-sugar juice components nor the juice itself had an effect on fasting blood glucose in the clinical trials.
The effects of 100 % fruit juice on measures of glucose control or insulin sensitivity varied little across study population characteristics including baseline fasting blood glucose levels. Body weight status of study participants is another important characteristic as overweight and obesity are recognised risk factors for the development of T2D due to decreased sensitivity of non-adipose tissue to insulin( 2 ). In all but one of the studies with reported BMI data( Reference Ravn-Haren, Dragsted and Buch-Andersen 34 ), mean BMI exceeded 25 kg/m2, indicating that the study populations were generally overweight or obese individuals. The available reported data on body weight or BMI indicate no differences in change between the juice intervention and control groups. In addition to weight status, the study populations also represented a variety of health states including healthy, diabetic, hypertensive/pre-hypertensive, hypercholesterolaemic, and adults with various other conditions. While many of these conditions are common co-morbidities of overweight and obesity, it is difficult to delineate their independent role in the relationship between 100 % fruit juice consumption and diabetes risk.
Many methods are used to assess bias in RCT when conducting a meta-analysis, including the Jadad criteria( Reference Berger and Alperson 53 ). Based on the Jadad criteria, which reflect randomisation, double blinding, and recording of withdrawals and dropouts( Reference Jadad, Moore and Carroll 19 ), the majority of studies in this meta-analysis had an unclear risk of selection bias due to absence of a description of the random sequence generation. A relatively high proportion of studies were non-double-blind (seven of eighteen) which points to a high risk of performance bias. Regarding attrition bias, the majority of studies (fourteen of eighteen) provided information on participant disposition throughout the study and the data largely indicate low risk of bias, though attrition was relatively high (20–32 %) in three studies( Reference Ravn-Haren, Dragsted and Buch-Andersen 34 , Reference Dohadwala, Hamburg and Holbrook 37 , Reference Silver, Dietrich and Niswender 42 ) and the remaining studies have unknown or potentially high risk for this source of bias. Other potential sources of bias not captured in the Jadad criteria but noted upon review of the studies include unknown or potentially high bias due to an unspecified washout period between interventions( Reference Ravn-Haren, Dragsted and Buch-Andersen 34 ).
Despite concerns that 100 % fruit juice may have adverse effects on glycaemic control, primarily as a result of sugars in these beverages, results from this analysis of RCT do not support a conclusion that 100 % fruit juice adversely affects glucose–insulin homeostasis. The results largely indicate no effect on glycaemic control. Some stratified analyses suggest the possibility of a beneficial effect of 100 % fruit juice on fasting blood glucose and HOMA-IR, though the evidence is inconclusive based on limitations of the available data. A mechanism by which 100 % fruit juice may have a favourable effect on measures of glycaemic control is not clearly known, though some evidence, largely from in vitro and animal studies, indicates that polyphenols may favourably affect glucose–insulin homeostasis through a variety of mechanisms including inhibition of glucose absorption, stimulation of insulin secretion from the pancreas and change in glucose release from the liver, activation of insulin receptors and glucose uptake by cells, and modulation of cell signalling pathways and gene expression( Reference Hanhineva, Torronen and Bondia-Pons 10 ). Further research is needed to understand these effects.
A strength of the present meta-analysis is the large number of randomised, controlled clinical trials identified for inclusion in the quantitative analysis. The broad though focused search strategy identified studies in which glucose metabolism outcomes were primary outcomes as well as studies in which the measures were collected as secondary outcomes or routine monitoring during the clinical trials. The large number of identified studies allowed for stratified analyses by similar characteristics of the intervention, study population, and overall study design to further explore effects of 100 % fruit juice on diabetes biomarkers. However, sample sizes in many stratified analyses were relatively small, and many analyses may result in detection of spurious associations, therefore these findings must be interpreted with caution.
Although the total number of identified studies was relatively large, variability among some parameters of study interventions, populations, and overall study design are limitations of this analysis and must be considered when interpreting the findings. The included studies reflect a diverse range of juice interventions (both type of juice and amount consumed), intervention durations, variable dietary restrictions throughout the intervention period (and typically no restrictions on consumption of other types of 100 % fruit juice), study populations with a range of health conditions, and studies with potential for some bias. Variability in these factors and potentially other factors not considered in the analysis contribute to the observed heterogeneity among studies, thus making it difficult to conclusively interpret the findings.
Conclusion
In conclusion, the available RCT indicate that repeated intake of 100 % fruit juice does not have a significant effect on glycaemic control or measures of insulin resistance. These findings from RCT of markers for diabetes are consistent with findings from some observational studies suggesting that consumption of 100 % fruit juice is neutral regarding risk of T2D. Results from stratified analyses and univariate meta-regressions also largely showed no significant associations between 100 % fruit juice and these measures of glucose control. High-quality studies of glucose–insulin homeostasis measures monitored in well-defined and controlled populations are needed to further clarify the effects of 100 % fruit juice on diabetes risk as evaluated by these biomarkers. Such research focused on commonly consumed juices served in moderate daily portions reflective of prudent dietary guidance would provide important information to further our understanding of the role of 100 % fruit juice on glycaemic control.
Acknowledgements
The authors thank Xiaoyu Bi for her assistance in completing some statistical analyses and organising data output.
This work was supported by the Juice Products Association.
All authors were employees of Exponent, Inc. at the time of work on this analysis. The Juice Products Association is a client of Exponent, Inc.
M. M. M., E. C. B. and L. M. B. designed the study. M. M. M. and E. C. B. completed the literature searches and M. M. M., E. C. B. and K. A. B. completed the data extraction. L. M. B. oversaw all statistical analyses. M. M. M., E. C. B., K. A. B. and L. M. B. contributed to interpretation of the findings. M. M. M. drafted the manuscript. All authors read, critically reviewed, edited and approved the final manuscript. The Juice Products Association developed the research question though had no role in the study design, data collection and analysis, interpretation of the data, or preparation of the manuscript.
The study sponsor reviewed an early draft of the manuscript and provided minor editorial suggestions for consideration by the authors who retained the authority to accept or reject them.


 Open access