


1. Introduction
Fluid–fluid displacement in porous media is a complex phenomenon with significant practical importance. The behaviour of fluid–fluid displacement in porous media impacts various natural and industrial processes such as geological carbon sequestration (MacMinn, Szulczewski & Juanes Reference MacMinn, Szulczewski and Juanes2010; Szulczewski et al. Reference Szulczewski, MacMinn, Herzog and Juanes2012), water infiltration into soil (Glass, Parlange & Steenhuis Reference Glass, Parlange and Steenhuis1989; Cueto-Felgueroso & Juanes Reference Cueto-Felgueroso and Juanes2008), enhanced oil recovery (Orr & Taber Reference Orr and Taber1984; Lake Reference Lake1989), and polymer electrolyte membrane electrolyzers (Lee et al. Reference Lee, Zhao, Abouatallah, Wang and Bazylak2019; Zhao et al. Reference Zhao, Lee, Lee, Fahy, LaManna, Baltic, Jacobson, Hussey and Bazylak2021). Decades of research have illustrated that the displacement process is governed by the competition between capillary and viscous forces as characterized by the capillary number  $Ca$, and the viscosity contrast between the invading and defending fluid as characterized by the viscosity ratio $\mathcal {M}$ (Lenormand, Touboul & Zarcone Reference Lenormand, Touboul and Zarcone1988). In addition, the invading fluid's relative affinity to the solid surface in the presence of the defending fluid (i.e. wettability) as characterized by the contact angle $\theta$ also exerts fundamental control over the flow behaviour (Stokes et al. Reference Stokes, Weitz, Gollub, Dougherty, Robbins, Chaikin and Lindsay1986; Cieplak & Robbins Reference Cieplak and Robbins1988; Zhao, MacMinn & Juanes Reference Zhao, MacMinn and Juanes2016). For instance, when the displacing fluid is more wetting to the porous media than the displaced fluid (i.e. imbibition), the fluid–fluid displacement pattern is generally more compact than the opposite case (i.e. drainage) (Holtzman & Segre Reference Holtzman and Segre2015; Zhao et al. Reference Zhao, MacMinn and Juanes2016; Primkulov et al. Reference Primkulov, Talman, Khaleghi, Shokri, Chalaturnyk, Zhao, MacMinn and Juanes2018; Lan et al. Reference Lan, Hu, Yang, Wu and Chen2020; Yang et al. Reference Yang, Saadat, Azizov, Dudek, Øye and Tsai2022). Today, we have a fairly good understanding of how the interplay between $Ca$,
$Ca$,  $\mathcal {M}$ and $\theta$ impacts fluid–fluid displacement in porous media with spatially uniform wettability (Primkulov et al. Reference Primkulov, Pahlavan, Fu, Zhao, MacMinn and Juanes2021).
In contrast, our knowledge of fluid–fluid displacement in porous media with spatially heterogeneous wettability (i.e. mixed-wet) is much less complete, despite its common occurrence in natural systems. Mixed-wettability in natural porous systems could originate from the spatial variation in mineral composition and surface roughness. Although reservoirs and aquifers consist primarily of water-wet minerals such as quartz and calcite, they also include other constituent minerals with different wettability states (Ustohal, Stauffer & Dracos Reference Ustohal, Stauffer and Dracos1998; Abdallah et al. Reference Abdallah1986). Moreover, water-wet minerals are known to become oil-wet after exposure to polar hydrocarbon components (e.g. asphaltenes) and some micro-organisms (Tweheyo, Holt & Torsæter Reference Tweheyo, Holt and Torsæter1999; O'Carroll et al. Reference O'Carroll, Abriola, Polityka, Bradford and Demond2005; Bultreys, Van Hoorebeke & Cnudde Reference Bultreys, Van Hoorebeke and Cnudde2016). Indeed, high-resolution in situ contact angle measurements of oil-bearing reservoir rocks have shown mixed-wettability with a wide range of contact angles (Andrew, Bijeljic & Blunt Reference Andrew, Bijeljic and Blunt2014; AlRatrout, Blunt & Bijeljic Reference AlRatrout, Blunt and Bijeljic2018; Blunt et al. Reference Blunt, Lin, Akai and Bijeljic2019). In the context of geological carbon sequestration, recent experiments have demonstrated that cyclic injection of supercritical  $\text {CO}_2$ and brine altered the wettability of a Bentheimer sandstone core, making it less water-wet (Herring et al. Reference Herring, Sun, Armstrong and Saadatfar2023).
The behaviour of fluid–fluid displacement in mixed-wet porous media is markedly different from uniform-wet porous media. The significant influence of mixed-wettability on multiphase flow in porous media first emerged in the oil industry, where mixed-wet cores often displayed higher oil displacement efficiency than water-wet cores after waterflooding experiments (Salathiel Reference Salathiel1973; Kovscek, Wong & Radke Reference Kovscek, Wong and Radke1993). This behaviour is attributed to the existence of interfaces with very low mean curvature and negative Gaussian curvature (i.e. coexisting curvatures with opposite signs in orthogonal directions; (Lin et al. Reference Lin, Bijeljic, Berg, Pini, Blunt and Krevor2019)). Low mean curvature leads to low capillary pressures, while negative Gaussian curvature leads to good connectivity within fluids of the same phase, such that water and oil can flow simultaneously (AlRatrout et al. Reference AlRatrout, Blunt and Bijeljic2018; Lin et al. Reference Lin, Bijeljic, Berg, Pini, Blunt and Krevor2019; Scanziani et al. Reference Scanziani, Lin, Alhosani, Blunt and Bijeljic2020). In the context of  $\text {CO}_2$ storage, it has been observed that $\text {CO}_2$-brine displacement in mixed-wet rocks results in less $\text {CO}_2$ trapping compared to the same process in water-wet rocks (Al-Menhali et al. Reference Al-Menhali, Menke, Blunt and Krevor2016; Al-Menhali & Krevor Reference Al-Menhali and Krevor2016; Chang et al. Reference Chang, Kneafsey, Wan, Tokunaga and Nakagawa2020).
Characterizing the wetting state of porous media with heterogeneous wettability is the first step to understanding fluid–fluid displacement in mixed-wet porous media (Armstrong et al. Reference Armstrong, Sun, Mostaghimi, Berg, Rücker, Luckham, Georgiadis and McClure2021). While the wettability of uniform-wet porous media can be described by its contact angle  $\theta$, describing the wettability of even the simplest mixed-wet porous media consisting of solids exhibiting just two contact angles requires knowledge of (i) the value of each contact angle, (ii) the fraction of the porous media covered by solids of each contact angle (i.e. wettability fraction), and (iii) the spatial distribution of the wettability heterogeneity as characterized by the correlation length of clusters with different contact angles, as well as their sizes (Guo et al. Reference Guo, Dalton, Fan, McClure, Zeng, Crandall and Chen2020).
Due to the various complexities involved in fully characterizing the wetting state of natural mixed-wet porous media, systematic and mechanistic investigation of the impact of mixed-wettability on fluid–fluid displacement in porous media can be aided greatly by the use of simple analogue systems with well-controlled geometry and wettability states (Murison et al. Reference Murison, Semin, Baret, Herminghaus, Schröter and Brinkmann2014; Hiller et al. Reference Hiller, Ardevol-Murison, Muggeridge, Schröter and Brinkmann2019; Geistlinger et al. Reference Geistlinger, Zulfiqar, Schlueter and Amro2021; Irannezhad et al. Reference Irannezhad, Primkulov, Juanes and Zhao2023). Geistlinger et al. (Reference Geistlinger, Zulfiqar, Schlueter and Amro2021) performed waterflooding experiments in an air-filled mixed-wet micromodel, which was fabricated by mixing water-wet ( $\theta =0^{\circ }$) and oil-wet ( $\theta =100^{\circ }$) glass beads in a cylindrical container. They observed a decrease in residual trapping as the fraction of water-wet beads increased from 30 % to 70 %. Murison et al. (Reference Murison, Semin, Baret, Herminghaus, Schröter and Brinkmann2014) conducted waterflooding experiments in oil-filled bead columns where half of the beads’ area was water-wet ( $\theta =20^{\circ }$) while the other half was oil-wet ( $\theta =130^{\circ }$). They observed smoothing of the fluid–fluid displacement front as the correlation length of different wettability clusters decreased. More recently, Irannezhad et al. (Reference Irannezhad, Primkulov, Juanes and Zhao2023) studied the radial displacement of oil by water in mixed-wet microfluidic flow cells patterned with cylindrical posts. The bulk of the flow cell was oil-wet ( $\theta =120^{\circ }$), and mixed-wettability was introduced by placing discrete water-wet clusters that were either weakly water-wet ( $\theta =60^{\circ }$) or strongly water-wet ( $\theta =30^{\circ }$). The experiments revealed surprising displacement patterns that arise as a result of mixed-wettability – the invading water preferentially fills strongly water-wet clusters but encircles weakly water-wet clusters instead. This counter-intuitive finding was attributed to the fluid–fluid interface configuration at mixed-wet pores, which resembles S-shaped saddles with mean curvatures close to zero.
While well-designed analogue experiments have contributed to our mechanistic understanding of fluid–fluid displacement in mixed-wet porous media, they remain prohibitively expensive to sweep a wide range of the relevant parameter spaces. Pore-scale modelling is a useful alternative in this endeavour, since it has become increasingly more predictive in recent years (Zhao et al. Reference Zhao, MacMinn and Juanes2016). Bakhshian & Hosseini (Reference Bakhshian and Hosseini2019) investigated the effect of wettability heterogeneity on the flow of supercritical  $\text {CO}_2$ and brine in a 1.2 mm $^3$ digital rock sample using lattice Boltzmann simulations. Specifically, they increased the fraction of $\text {CO}_2$-wet portions of the simulation domain from 10 % to 50 % and observed more residual trapping of $\text {CO}_2$. However, lattice Boltzmann simulations remain computationally challenging and expensive (Zhao et al. Reference Zhao2019). In contrast, pore-network models are attractive due to their intuitive nature and relatively low computational cost (Blunt Reference Blunt2001), and they have been applied in a recent study to extend the classic Lenormand's diagram to include the impact of wettability (Primkulov et al. Reference Primkulov, Pahlavan, Fu, Zhao, MacMinn and Juanes2021).
Here, we employ a dynamic pore network model to investigate the impact of mixed-wettability on fluid–fluid displacement in simple model porous media consisting of water-wet and oil-wet regions with distinct contact angles. For each contact angle pair, we systematically vary the wettability fraction and study the displacement pattern over a wide range of  $Ca$. We find that the displacement pattern is controlled by the interplay between $Ca$, wettability fraction and intrinsic wettability of the water-wet regions, leading to complex behaviours. Furthermore, mixed-wettability induces fluctuations in the injection pressure, whose magnitude has a large viscous component, even at vanishingly small $Ca$. Finally, we demonstrate that scaling analyses based on a simple weighted average description of the overall wettability of the model mixed-wet porous media can effectively predict the finger width of the displacement pattern.
2. Method
We design a microfluidic porous medium by placing  $\sim$16 000 cylindrical posts on an irregular triangular lattice. The lattice is generated inside a 5 inch diameter circle using the pdemesh tool in MATLAB. We assign the radius of each post to be 47 % of the distance between its centre and the nearest neighbouring post's centre. In our system, the radius of the posts follow a Gaussian-like distribution that ranges from 110 to 850 $\mathrm {\mu }$m, with median value 340 $\mathrm {\mu }$m. The pore throat sizes follow a lognormal-like distribution that ranges from 50 to 700 $\mathrm {\mu }$m, with median value 200 $\mathrm {\mu }$m (Appendix A). We make the posts’ height $h=200$ $\mathrm {\mu }$m to match the median pore throat size.
We implement mixed-wettability by placing water-wet clusters in a simulation domain that is otherwise oil-wet. Specifically, we randomly assign  $N$ posts as the seeds for generating the water-wet clusters. At each seed post, we draw a circle with a radius of five median posts, and make all posts and surfaces within the circle water-wet. Overlapping circles merge and form a single cluster (figure 1a). Increasing $N$ increases the wettability fraction $f_{w}$, which is defined as the number of water-wet posts out of the total number of posts. In this model, oil-wet and water-wet regions are separated by sharp boundaries connecting the adjacent pore centres (figure 1a, top inset). The top and bottom surfaces of the mixed-wet pores also have spatially heterogeneous wettability (figure 1a, bottom inset).

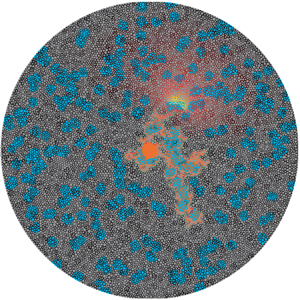
Figure 1. (a) We develop a dynamic pore network model to simulate fluid–fluid displacement through analogue porous media with spatially heterogeneous wettability (i.e. mixed-wet). The flow geometry is radial and quasi-two-dimensional, consisting of  $\sim$16 000 cylindrical posts. We achieve mixed-wettability by placing base water-wet clusters (blue regions) that span five posts in a domain that is otherwise oil-wet (grey regions). The base water-wet clusters merge and form larger clusters (top inset). The water-wet and oil-wet regions are separated by sharp boundaries (bottom inset). (b) The fluid–fluid interface at a mixed-wet pore throat resembles an S-shaped saddle in three dimensions (Irannezhad et al. Reference Irannezhad, Primkulov, Juanes and Zhao2023). Our model calculates explicitly the critical pressures of pore-scale instabilities and advances the fluid–fluid interface when a burst, touch or overlap event occurs. (c) Our pore network model captures the nuanced and complex behaviour of multiphase flow in mixed-wet porous media (Irannezhad et al. Reference Irannezhad, Primkulov, Juanes and Zhao2023). The invading water (yellow) preferentially fills the water-wet clusters with contact angle $\theta =30^{\circ }$ (left-hand plots), but encircles the water-wet clusters with $\theta =60^{\circ }$ (right-hand plots). The oil-wet clusters have $\theta =120^{\circ }$ in both cases. Experiments and simulations are conducted at $Ca=1 \times 10^{-4}$ (Irannezhad et al. Reference Irannezhad, Primkulov, Juanes and Zhao2023).
We apply a dynamic pore-network model to simulate fluid–fluid displacement in mixed-wet microfluidic cells. The model was first introduced in Irannezhad et al. (Reference Irannezhad, Primkulov, Juanes and Zhao2023), but we describe its details for the first time here. Our mixed-wet model is based on the model of fluid–fluid displacement in uniform-wet porous media developed by Primkulov et al. (Reference Primkulov, Pahlavan, Fu, Zhao, MacMinn and Juanes2019). The model establishes an analogy between multiphase flow in porous media and electrical current in a circuit with fixed resistors and moving capacitors. This analogy enables the model to capture the effects of capillary pressure (at pore throats where fluid–fluid interfaces exist) and viscous pressure drop (at all pore throats) simultaneously throughout the network. Adding wettability effects to the model requires an understanding of invasion mechanisms at the pore scale, where fluid–fluid interfaces advance as invading fluid pressure increases. This advancement leads eventually to the invasion of the adjacent pore through one of the three possible types of invasion events (Cieplak & Robbins Reference Cieplak and Robbins1988, Reference Cieplak and Robbins1990), as follows. (i) Burst is equivalent to a Haines jump (Haines Reference Haines1930), and occurs when there is no stable configuration for a fluid–fluid interface connecting two posts. Thus the interface suddenly invades the adjacent pore and splits into two interfaces. (ii) Touch occurs when the fluid–fluid interface connecting two posts touches a third post's body. Similar to the burst event, the fluid–fluid interface splits into two interfaces. (iii) Overlap occurs when two neighbouring fluid–fluid interfaces meet on a common post. In this case, the two interfaces merge and form a single, wider interface spanning the neighbouring posts. The configuration of any given fluid–fluid interface can be described by its in-plane and out-of-plane curvatures.
In a quasi-two-dimensional, uniform-wet microfluidic cell, the interface's out-of-plane radius of curvature  $r_{out}$ is constant and equal to $h/(2\cos \theta )$, while its in-plane radius of curvature $r_{in}$ decreases as the interface advances through the pore throat. Therefore, capillary pressure at the interface gradually increases as the interface advances, until the interface undergoes an invasion event (i.e. burst, touch or overlap). The capillary pressure associated with pore invasion is termed the critical capillary pressure, and is given by $p_c^{crit}={\sigma /r_{out}}+\min (\sigma /{r_{in}^{burst}},\sigma /{r_{in}^{touch}}, \sigma /{r_{in}^{overlap}})$, where $\sigma$ is the interfacial tension between the two fluids, and ${r_{in}^{burst}}$, ${r_{in}^{touch}}$, ${r_{in}^{overlap}}$ are the in-plane radii of curvature corresponding to burst, touch and overlap events, respectively. These in-plane radii of curvature for pore invasion mechanisms in a uniform-wet microfluidic cell have been derived in Primkulov et al. (Reference Primkulov, Talman, Khaleghi, Shokri, Chalaturnyk, Zhao, MacMinn and Juanes2018).
The fluid–fluid interface configuration at a mixed-wet pore throat is more complex. In particular, the interface has been observed to be saddle-shaped (Lin et al. Reference Lin, Bijeljic, Berg, Pini, Blunt and Krevor2019). Additionally, in situ measurements of fluid–fluid interfaces in carbonate rocks have revealed that their mean curvatures are noticeably lower in mixed-wet rocks compared to similar water-wet rocks (Armstrong & Wildenschild Reference Armstrong and Wildenschild2012; Lin et al. Reference Lin, Bijeljic, Berg, Pini, Blunt and Krevor2019). Recent experiments in mixed-wet microfluidics provided high-resolution visualization of the fluid–fluid interface between two posts of contrasting wettabilities, which resembles an S-shaped saddle in three dimensions, with mean curvatures close to zero (Irannezhad et al. Reference Irannezhad, Primkulov, Juanes and Zhao2023).
The in-plane view of a typical S-shaped fluid–fluid interface at a mixed-wet pore throat is shown in figure 1(b). Post 1 is an oil-wet post with contact angle  $\theta _{o}$, radius $R_1$, and centre coordinate A $(0, 0)$, while post 2 is a water-wet post with contact angle $\theta _{w}$, radius $R_2$, and centre coordinate B $(X_2, 0)$. We approximate the S-shaped interface as two circular arcs ( $\overset {\huge \frown }{CE}$ and $\overset {\huge \frown }{EH}$) that connect smoothly at the wettability boundary. The centres of $\overset {\huge \frown }{CE}$ and $\overset {\huge \frown }{EH}$ are located at I $(X_{p1},Y_{p1})$ and G $(X_{p2},Y_{p2})$, while their radii are given by $r_{p1}$ and $r_{p2}$, respectively. We denote the distance between points A and I as $d_1$, which is given by the cosine law in the triangle AIC as
 \begin{equation} d_1 =\sqrt {R_{1}^2+r_{p1}^2 - 2R_{1}r_{p1} \cos ({\rm \pi}-\theta_{o})}. \end{equation}
Similarly, the distance  $d_2$ between points B and H is given by
 \begin{equation} d_2=\sqrt {R_{2}^2+r_{p2}^2 - 2R_{2}r_{p2} \cos \theta_{w}}. \end{equation}
As the fluid–fluid interface advances through the pore throat, point I and point G each trace a circle described by
 $$\begin{gather} X_{p1}^2+Y_{p1}^2 = d_1^2, \end{gather}$$
 $$\begin{gather}(X_{p2}-X_2)^2+Y_{p2}^2 = d_2^2. \end{gather}$$
Since  $\overset {\huge \frown }{CE}$ and $\overset {\huge \frown }{EH}$ join smoothly at point E, we construct the right triangle IGD and find the distance $d_3$ between points I and G:
 \begin{equation} d_3=r_{p1}+r_{p2}=\sqrt {(X_{p2}-X_{p1})^2+(Y_{p1}-Y_{p2})^2}. \end{equation}
Furthermore, the right triangles IGD and EGF are similar triangles, which leads to
 \begin{equation} \frac{r_{p2}}{r_{p1}+r_{p2}} = \frac{X_{p2}-X_{wb}}{X_{p2}-X_{p1}}, \end{equation}
where  $X_{wb}$ is the $x$-coordinate of the wettability boundary.
Finally, we note that the mean curvature of the fluid–fluid interface in the oil-wet region must equal that in the water-wet region at equilibrium, since capillary pressure is constant along the entire interface. Therefore,
 \begin{equation} \frac{1}{r_{p1}}+\frac{2\cos\theta_{o}}{h}=-\frac{1}{r_{p2}} + \frac{2 \cos \theta_{w}}{h}. \end{equation}
The shape of the fluid–fluid interface at the mixed-wet pore throat is described fully by  $X_{p1}$, $Y_{p1}$, $X_{p2}$, $Y_{p2}$, $r_{p1}$ and $r_{p2}$. For a given $r_{p1}$, we first solve for $r_{p2}$ in (2.6). We then solve for $d_1$ and $d_2$ in (2.1)–(2.2), followed by solving for $X_{p1}$, $Y_{p1}$, $X_{p2}$ and $Y_{p2}$ in (2.3)–(2.5).
We follow the algorithm below to find the critical capillary pressures associated with burst, touch and overlap invasion events. Starting with a large  $r_{p1}$, we solve (2.1)–(2.6). If no valid solution is found, then we decrease $r_{p1}$ and repeat the process until a valid fluid–fluid interface is found. We then depict the interface and check if touch or overlap will occur. Touch occurs when the depicted interface intersects a neighbouring third post, while overlap occurs when the depicted interface intersects an adjacent interface (Cieplak & Robbins Reference Cieplak and Robbins1988, Reference Cieplak and Robbins1990). We decrease $r_{p1}$ successively until no valid solution can be found, which corresponds to the point when burst occurs. Similar to the homogeneous-wet case, the critical capillary pressure for pore invasion is given by
 \begin{equation} p_c^{crit}={\frac{2\sigma\cos\theta_{o}}{h}}+\min (\sigma/{r_{p1}^{burst}},\sigma/{r_{p1}^{touch}}, \sigma/{r_{p1}^{overlap}}). \end{equation}
Our model captures the effects of viscous pressure drop across the system by solving the equations of Poiseuille's law and mass conservation for the network of pore throats. We impose a constant flow boundary condition at the inlet pore throats, and a constant pressure boundary condition at the outlet pores along the perimeter. We assign the viscosities of the defending fluid and the invading fluid to be  $\mu _{def}=50$ mPa s and $\mu _{\rm {inv}}=0.99$ mPa s, respectively, and the interfacial tension between the fluids to be $\sigma =13$ mN m $^{-1}$. These fluid–fluid properties correspond to the microfluidic experiments of Irannezhad et al. (Reference Irannezhad, Primkulov, Juanes and Zhao2023), which enables direct comparison between the model predictions and the experiments. Specifically, the model captures the salient behaviours of the mixed-wet microfluidic experiment – the invading fluid preferentially fills the water-wet clusters with contact angle $\theta =30^{\circ }$, but encircles the weakly water-wet clusters with contact angle $\theta =60^{\circ }$ instead (figure 1c). The oil-wet regions of the flow cell have contact angle $\theta =120^{\circ }$ in both cases.
3. Results
3.1. Phase diagram
We apply the dynamic pore-network model to investigate fluid–fluid displacement in simple mixed-wet microfluidics. Specifically, each simulation domain consists of water-wet regions with contact angle  $\theta _{w}$ and oil-wet regions with contact angle $\theta _{o}$. We consider three different contact angle pairs: $\theta _{w}\unicode{x2013}\theta _{o}=30^{\circ }\unicode{x2013}120^{\circ }$, $60^{\circ }$– $120^{\circ }$ and $60^{\circ }$– $150^{\circ }$. Our systematic investigation includes varying the wettability fraction ( $f_{w}=2\,\%$, $26\,\%$, $50\,\%$, $76\,\%$, $98\,\%$) and capillary number ( $Ca=5 \times 10^{-4}$, $1 \times 10^{-4}$, $5 \times 10^{-5}$, $1 \times 10^{-5}$, $5 \times 10^{-6}$) over a wide range of values. Here, the macroscopic $Ca=\mu _{o}v/\sigma$ measures the relative importance between viscous and capillary forces. The characteristic velocity is defined as $v=Q/({h}2{\rm \pi} {r_{in}})$, where $r_{in}$ is the distance between the cell's centre and its closest post. Additionally, for each $f_w$, we design three mixed-wet cells with different base water-wet cluster placements to verify the reproducibility of the results. Figure 2 shows the phase diagrams of the fluid–fluid displacement patterns in mixed-wet domains consisting of the three contact angle pairs, at different $Ca$ and $f_w$. Qualitatively, the displacements display the canonical viscous fingering pattern at high $Ca$ for all mixed-wettability conditions. As $Ca$ decreases, the displacement patterns become more compact with increasing $f_w$, though this effect is much more noticeable in mixed-wet domains with contact angle pair $30^{\circ }$– $120^{\circ }$ compared to domains with contact angle pairs $60^{\circ }$– $120^{\circ }$ and $60^{\circ }$– $150^{\circ }$.

Figure 2. Phase diagrams of the invading fluid morphology at breakthrough for different wettability fractions (left to right  $2\,\%$, $26\,\%$, $50\,\%$, $76\,\%$, $98\,\%$) and capillary numbers (top to bottom $Ca=5 \times 10^{-4}$, $1 \times 10^{-4}$, $5 \times 10^{-5}$, $1 \times 10^{-5}$, $5 \times 10^{-6}$). Phase diagrams corresponding to mixed-wet porous media with contact angle pairs (a) $30^{\circ }$– $120^{\circ }$, (b) $60^{\circ }$– $120^{\circ }$, and (c) $60^{\circ }$– $150^{\circ }$.
3.2. Quantitative measures
To quantify the morphological properties of the displacement patterns, we calculate the dimensionless finger width ( $w_f$) and the fractal dimension ( $D_f$). Here, $D_f$ is calculated via the box-counting method (Kenkel & Walker Reference Kenkel and Walker1996; Schroeder Reference Schroeder2009), while $w_f$ is defined as the average finger width normalized by the average pore size (Cieplak & Robbins Reference Cieplak and Robbins1988, Reference Cieplak and Robbins1990; Holtzman Reference Holtzman2016; Primkulov et al. Reference Primkulov, Pahlavan, Fu, Zhao, MacMinn and Juanes2019).
Increasing  $Ca$ leads to smaller $w_f$ in all mixed-wet domains due to viscous effects. Increasing $f_w$ yields only moderately higher $w_f$ in mixed-wet domains with contact angle pairs $60^{\circ }$– $120^{\circ }$ and $60^{\circ }$– $150^{\circ }$, though the positive correlation between $w_f$ and $f_w$ is significantly more prominent in mixed-wet domains with contact angle pair $30^{\circ }$– $120^{\circ }$ (figure 3a). Variations in $w_f$ can be explained by the pore-scale invasion mechanism. The dominant pore invasion mechanism in oil-wet porous media is burst, while pores in water-wet porous media experience more overlap (Primkulov et al. Reference Primkulov, Talman, Khaleghi, Shokri, Chalaturnyk, Zhao, MacMinn and Juanes2018, Reference Primkulov, Pahlavan, Fu, Zhao, MacMinn and Juanes2019). During overlap events, the invasion of one pore destabilizes the fluid–fluid interface at the neighbouring pore, creating a smoother displacement front (Cieplak & Robbins Reference Cieplak and Robbins1988, Reference Cieplak and Robbins1990; Holtzman & Segre Reference Holtzman and Segre2015). Therefore, $w_f$ increases with increasing $f_w$. Furthermore, the probability of overlap events occurring increases as the invading fluid becomes more wetting to the porous media (Holtzman & Segre Reference Holtzman and Segre2015; Primkulov et al. Reference Primkulov, Talman, Khaleghi, Shokri, Chalaturnyk, Zhao, MacMinn and Juanes2018, Reference Primkulov, Pahlavan, Fu, Zhao, MacMinn and Juanes2019). Indeed, tracking the invasion event type reveals that increase in overlap events with increasing $f_w$ is much more significant in mixed-wet domains with contact angle pair $30^{\circ }$– $120^{\circ }$, compared to the mixed-wet domains with contact angle pairs $60^{\circ }$– $120^{\circ }$ and $60^{\circ }$– $150^{\circ }$ (figures 3c–e).

Figure 3. Quantitative measures of the displacement patterns. (a) Normalized finger width for three capillary numbers ( $Ca=5\times 10^{-6}$, $5\times 10^{-5}$, $5\times 10^{-4}$), and (b) fractal dimension for the lowest capillary number in mixed-wet domains, with contact angle pairs $30^{\circ }$– $120^{\circ }$ (blue circles), $60^{\circ }$– $120^{\circ }$ (black diamonds) and $60^{\circ }$– $150^{\circ }$ (orange squares). Distributions of burst, touch and overlap events as functions of $f_w$ in mixed-wet domains with contact angle pairs (c) $30^{\circ }$– $120^{\circ }$, (d) $60^{\circ }$– $120^{\circ }$ and (e) $60^{\circ }$– $150^{\circ }$, for displacements at the lowest capillary number.
We measure the fractal dimension of the displacement patterns at the lowest capillary number ( $Ca=5 \times 10^{-6}$), which characterizes the extent to which the displacement patterns fill space in two dimensions (figure 3b). As expected, $D_f$ increases with increasing $f_w$ in mixed-wet domains with contact angle pair $30^{\circ }$– $120^{\circ }$ due to the rise in overlap-driven smoothing of the displacement front. However, this is not the case in mixed-wet domains with contact angle pairs $60^{\circ }$– $120^{\circ }$ and $60^{\circ }$– $150^{\circ }$, where $D_f$ is a non-monotonic function of $f_w$, and $D_f$ reaches a maximum at $f_w=50\,\%$. This surprising behaviour can be rationalized by the following arguments. At low $f_w$, the broadening of the displacement pattern is controlled by the size and distribution of the water-wet clusters – increasing the size and number of water-wet clusters increases $D_f$. At high $f_w$, however, the broadening of the displacement pattern is controlled by the intrinsic wettability of the water-wet clusters – more strongly water-wet clusters will yield higher $D_f$ due to a higher probability of overlap events. We note that such contrasting behaviours have been observed in waterflooding experiments in mixed-wet oil-bearing porous media. For instance, Singhal, Mukherjee & Somerton (Reference Singhal, Mukherjee and Somerton1976) found that oil recovery efficiency increases monotonically as the fraction of the water-wet surface area of the porous medium increases. In contrast, Skauge & Ottesen (Reference Skauge and Ottesen2002) and Høiland, Spildo & Skauge (Reference Høiland, Spildo and Skauge2007) found that oil recovery efficiency shows a non-monotonic trend according to wettability, with highly mixed-wet cores showing higher oil recovery efficiency than mostly water-wet and oil-wet cores.
3.3. Pressure signatures
We track the injection pressure evolution to gain further insight into the macroscopic impact of mixed-wettability on fluid–fluid displacement in porous media. Injection pressure is a valuable piece of information in various subsurface applications, including geological carbon sequestration (Bachu Reference Bachu2008) and hydraulic fracturing (Warner et al. Reference Warner, Jackson, Darrah, Osborn, Down, Zhao, White and Vengosh2012), and it can help to inform the wettability state of the porous medium (Sygouni, Tsakiroglou & Payatakes Reference Sygouni, Tsakiroglou and Payatakes2006). The injection pressure consists of the capillary pressure across the interface between the invading and defending fluids, and the combined viscous pressure loss in the two fluids.
At high  $Ca$, viscous pressure loss dominates, and the injection pressure decreases monotonically as the more viscous defending fluid is pushed out by the less viscous invading fluid. This decreasing trend in injection pressure is observed in all cases, regardless of the wettability state of the domain (figure 4a). Interestingly, the signature of wettability is evident even at the highest capillary number ( $Ca=5\times 10^{-4}$) – the injection pressure is consistently higher in a purely oil-wet domain compared to a purely water-wet domain. These results agree with the injection pressure measurements in uniform-wet microfluidic experiments (Zhao et al. Reference Zhao, MacMinn and Juanes2016). The injection pressures observed in mixed-wet domains fall between those in purely oil-wet and water-wet domains (figure 4a).

Figure 4. Evolution of injection pressure as a function of  $f_w$ at (a) a high capillary number ( $Ca=5\times 10^{-4}$) and (b) a low capillary number ( $Ca=5\times 10^{-6}$), for different wettability fractions. The water-wet region has contact angle $\theta _{w}=30^{\circ }$, while the oil-wet region has contact angle $\theta _{o}=120^{\circ }$. (c) Snapshot of the pressure map as the invading water fills a water-wet cluster at $Ca=5\times 10^{-6}$ for $f_w=20\,\%$. The preferential filling of the water-wet cluster causes the local redistribution of the defending oil, leading to non-negligible viscous pressure loss even at very low $Ca$.
$Ca$.
At low  $Ca$, capillary pressure dominates and the injection pressure is controlled by the wettability of the domain. Indeed, the injection pressure fluctuates around a mean positive value in a purely oil-wet domain (i.e. drainage), but around a mean negative value in a purely water-wet domain (i.e. imbibition). Closer inspection shows that the injection pressure fluctuations are larger in a purely oil-wet domain than in a purely water-wet domain (figures 4b,c). This difference in fluctuations is attributed to the prevalence of burst invasion events in drainage, whose critical capillary pressures are larger than those of touch and overlap invasion events, which are more prevalent in imbibition (Måløy et al. Reference Måløy, Furuberg, Feder and Jøssang1992; Moebius & Or Reference Moebius and Or2012; Primkulov et al. Reference Primkulov, Pahlavan, Fu, Zhao, MacMinn and Juanes2019).
Intuitively, at vanishingly small  $Ca$, one would expect the injection pressure to fluctuate between the drainage capillary pressure and the imbibition capillary pressure in a mixed-wet domain, as the invading water transits oil-wet and water-wet clusters. Surprisingly, this is not what we see in mixed-wet domains with small $f_w$ – instead, we observe that the injection pressure fluctuates between the drainage capillary pressure and some pressure that is much higher than the imbibition capillary pressure (figure 4b). This deviation can be explained by the fact that once the invading water encounters a water-wet cluster, all of the injected volume will preferentially enter that region of the micromodel. Since the water-wet clusters are small at low $f_w$, the preferential filling within this localized region will cause the defending fluid to redistribute along the invasion front, leading to non-negligible viscous pressure loss even at very low $Ca$. Indeed, as the invading water enters a water-wet cluster ( $\theta _{w}=30^{\circ }$, $f_w=20\,\%$), the difference between the measured injection pressure and the imbibition capillary pressure equals the viscous pressure in the defending oil (figure 4c). Therefore, mixed-wettability could decrease the effective permeability of porous media at low $Ca$. As the invading water exits the water-wet cluster, the injection pressure increases to the drainage capillary pressure. Consequently, the period of the fluctuations indicates the size of the water-wet cluster. At high $f_w$, the invading water has access to many connected water-wet pores at any given time, and the injection pressure closely tracks the imbibition capillary pressure (figure 4b).
3.4. Wettability index description of mixed-wet systems
Despite the complexities involved in fully characterizing the wettability of mixed-wet systems (e.g. contact angles, wettability fraction), it is sometimes helpful to approximate the wettability state of a porous medium by a single parameter. One of the simplest representations of this idea is the wettability index (WI), which in its general form is given by (Armstrong et al. Reference Armstrong, Sun, Mostaghimi, Berg, Rücker, Luckham, Georgiadis and McClure2021)
 \begin{equation} \text{WI}=\sum_{i=1}^{n} \frac{\sigma_{i1}-\sigma_{i2}}{\sigma_{12}}\,f_i, \end{equation}
where  $f_i$ is the area fraction of surface $i$,
$i$,  $\sigma _{12}$ is the interfacial tension between fluid 1 and fluid 2, and $\sigma _{i1},\sigma _{i2}$ are the interfacial tensions between surface $i$ and the two fluids. Young's equation relates the interfacial tensions to the contact angle. For our mixed-wet system with two distinct contact angles and oil-water as the fluid–fluid pair, incorporating Young's equation gives
 \begin{equation} \text{WI}= f_{w} \cos \theta_{w} +(1-f_{w}) \cos \theta_{o}. \end{equation}
Therefore, WI is a weighted average description of the overall wettability of the porous media. Here, we examine the effectiveness of WI in predicting the fluid–fluid displacement pattern as characterized by the finger width  $w_f$ at low capillary number ( $Ca=5\times 10^{-6}$). We find that WI successfully collapses $w_f$ extracted from simulations conducted in more than 50 different mixed-wet porous media. Additionally, this master curve matches the one obtained from simulations of fluid–fluid displacement in uniform-wet porous media, which both show that finger width increases with increasing WI (figure 5a).

Figure 5. Wettability index description of mixed-wet systems. (a) We extract the average finger width  $w_f$ from fluid–fluid displacement simulations in more than 50 mixed-wet porous media of different contact angle pairs ( $\theta _{w}\unicode{x2013}\theta _{o}=30^{\circ }\unicode{x2013}120^{\circ }$, $60^{\circ }$– $120^{\circ }$, $60^{\circ }$– $150^{\circ }$) and wettability fractions. Plotting $w_f$ versus the wettability index (WI) collapses the dataset onto a single curve, which matches the results obtained from simulations performed in uniform-wet porous media with different wettabilities. In all simulations, $Ca=5\times 10^{-6}$. (b) Invasion front configuration at two adjacent pores. (c) Here, $Ca^{\star }$ and $N_{coop}^{\star }$ explain the variations in $w_f$ in 15 different mixed-wet domains ( $\theta _{w}\unicode{x2013}\theta _{o}=30^{\circ }\unicode{x2013}120^{\circ }$, $60^{\circ }$– $120^{\circ }$, $60^{\circ }$– $150^{\circ }$; $f_{w}=2\,\%, 26\,\%, 50\,\%, 76\,\%, 98\,\%$) over a wide range of capillary numbers.
We take the weighted average description of fluid–fluid displacement in mixed-wet porous media one step further via scaling analysis and derive two dimensionless parameters that capture the behaviour of  $w_f$ across all $Ca$. We first compare the relative importance of the characteristic viscous pressure $\delta p_v$ and capillary pressure $\delta p_c$ at the pore scale (Toussaint et al. Reference Toussaint, Løvoll, Méheust, Måløy and Schmittbuhl2005; Holtzman & Juanes Reference Holtzman and Juanes2010; Holtzman Reference Holtzman2016; Primkulov et al. Reference Primkulov, Pahlavan, Fu, Zhao, MacMinn and Juanes2019). The characteristic viscous pressure is given by the pressure drop in the viscous defending fluid over a characteristic length $l$:
$l$:
 \begin{equation} \delta p_v=32\mu_{def}\,{v}\,\frac{(a+h)^2}{a^2 h^2}\,l, \end{equation}
where  $v$ is the characteristic injection velocity, and $a$ and $l$ are the median pore length and pore throat size, respectively. The characteristic capillary pressure is assumed to be the capillary pressure corresponding to a burst event at a characteristic pore throat:
 $$\begin{gather} \delta{p_c} = \sigma\kappa, \end{gather}$$
 $$\begin{gather}\kappa=\frac{2\cos \theta}{h} + \frac{2}{{a}\bigl(\hat{l} \cos \theta + \sqrt{\hat{l}^2 (\cos \theta)^2 + 1 + 2\hat{l} }\bigr)}, \end{gather}$$
where  $\kappa$ is the critical interface curvature required for burst to occur, and $\hat {l}={d}/{a}$ is the ratio between the median post diameter and the median pore throat size (figure 5b). (A detailed derivation of (3.4b) is included in Appendix B.) The ratio between $\delta p_v$ and $\delta p_c$ yields a modified capillary number $Ca^{\star }$, which takes into account the wettability of the system (Holtzman & Segre Reference Holtzman and Segre2015; Holtzman Reference Holtzman2016; Primkulov et al. Reference Primkulov, Pahlavan, Fu, Zhao, MacMinn and Juanes2019). In our mixed-wet system, water-wet and oil-wet regions have the same characteristic viscous pressure drop, but noticeably different capillary pressure. We take the weighted average of the characteristic capillary pressures in the water-wet and oil-wet regions, and arrive at
 \begin{equation} Ca^{{\star}} = \frac{32(a+h)^2 l}{a^2 h^2 (\,f_{w} \kappa_{w} +(1-f_{w}) \kappa_{o})}\,Ca, \end{equation}
where  $\kappa _{w}$ and $\kappa _{o}$ are the critical interface curvatures (3.4b) for water-wet and oil-wet regions, respectively.
On its own,  $Ca^{\star }$ is not able to capture the displacement pattern across different wettabilities, since it does not account for the different types of invasion events (i.e. burst, touch, overlap). It is well-known that overlap events promote cooperative pore filling, which leads to more compact displacement (i.e. wider fingers; Cieplak & Robbins Reference Cieplak and Robbins1988, Reference Cieplak and Robbins1990; Zhao et al. Reference Zhao, MacMinn and Juanes2016; Primkulov et al. Reference Primkulov, Talman, Khaleghi, Shokri, Chalaturnyk, Zhao, MacMinn and Juanes2018). To capture the effect of cooperative pore filling, we calculate the dimensionless cooperative number ( $N_{coop}$) for our system. Specifically, $N_{coop}$ evaluates the relative likelihood of overlap and burst events by comparing the critical capillary pressures associated with the two invasion event types (Holtzman & Segre Reference Holtzman and Segre2015). For a characteristic pore, $N_{coop}$ is given by
 $$\begin{gather} N_{coop}= \frac{\phi}{2}+ \theta + \arccos\left({\frac{r_{p}^2 + d_1^2 - \dfrac{d^2}{4}}{2 d_1 r_{p}}}\right) + \arccos\left({\frac{ a + d }{2 d_1}}\right)- {\rm \pi}, \end{gather}$$
 $$\begin{gather}r_{p}= \frac{\hat{l} \cos \theta + \sqrt{\hat{l}^2 (\cos \theta)^2 +1 + 2\hat{l} }}{\dfrac{2}{ a}}, \end{gather}$$
where  $\phi$ is the median angle between two neighbouring interfaces. (A detailed derivation of $N_{coop}$ is included in Appendix C.) Positive $N_{coop}$ indicates that burst events are more likely to occur than overlap, while negative $N_{coop}$ suggests the opposite. Finally, we take the weighted average of the cooperative numbers for the water-wet region ( $N_{coop,w}$) and the oil-wet region ( $N_{coop,o}$) to arrive at a modified cooperative number for the mixed-wet system:
 \begin{equation} N_{coop}^{{\star}}= f_{w}N_{coop,w}+(1-f_{w})N_{coop,o}. \end{equation}
Here,  $Ca^{\star }$ and $N_{coop}^{\star }$ explain the variations in $w_f$ in different mixed-wet domains over a wide range of capillary numbers (figure 5c, figure 9). In our system, the critical modified capillary number is $Ca^{\star }_c\sim {d/D}\approx {6\times 10^{-3}}$, where $D$ is the diameter of the domain. For $Ca^{\star }>Ca^{\star }_c$, viscous pressure dominates, and the displacement pattern consists of long, thin fingers (small $w_f$) that are typical in viscous fingering. For $Ca^{\star }< Ca^{\star }_c$, the displacement pattern is dependent upon the amount of cooperative smoothing in the system such that wide fingers (large $w_f$) start to emerge for $N_{coop}^{\star }<0$.
4. Conclusions
We have investigated fluid–fluid displacement in simple mixed-wet porous media consisting of distinct water-wet and oil-wet regions using a dynamic pore network model. We generate phase diagrams of the displacement patterns for three different water-wet/oil-wet contact angle pairs over a wide range of  $Ca$ (figure 2). The impact of mixed-wettability is most prominent at low $Ca$, whose effect on the displacement pattern is controlled by the complex interplay between wettability fraction and the intrinsic contact angle of the water-wet regions (figure 3). Our simulations also provide insights into the pressure signature of fluid–fluid displacement in mixed-wet porous media, which displays fluctuations that cannot be explained by capillary pressure alone, even at vanishingly small $Ca$ (figure 4). We find that the injection pressure fluctuations are modulated by the viscous pressure of the defending fluid due to preferential filling of isolated water-wet regions, and the durations of the fluctuations are determined by the sizes of the water-wet regions. One surprising consequence of this complex interplay is that at low $Ca$, mixed-wettability could result simultaneously in reduced effective permeability, but more effective sweep of the defending fluid. Finally, we derive scaling arguments based on a weighted average description of the overall wettability of the mixed-wet porous medium, which effectively capture the variations in displacement pattern morphology as characterized by the finger width (figure 5). Our study presents a systematic understanding of the relationship between contact angle, wettability fraction and capillary number in governing fluid–fluid displacement in simple mixed-wet porous media, and it serves as a platform upon which more complex mixed-wet porous media can be investigated. For instance, the impact of spatial distribution of wettability clusters, including mixed-wettability at the scale of a single pore, as well as the interaction between pore size disorder and wettability heterogeneity, remain as interesting areas for further study.
Funding
This research was supported by the Natural Sciences and Engineering Research Council of Canada (NSERC) Discovery Grants (RGPIN-2019-07162).
Declaration of interests
The authors report no conflict of interest.
Appendix A. Model geometry
In our system, the diameters of the posts follow a Gaussian-like distribution that ranges from 220 to 1700  $\mathrm {\mu }$m (figure 6a). Additionally, the pore throat size follows a lognormal-like distribution that ranges from 50 to 700 $\mathrm {\mu }$m (figure 6b).

Figure 6. Characteristics of the micromodel domain: (a) post diameter; (b) pore throat size.
Appendix B. Critical interface curvature for burst
Our aim here is to determine the critical interface curvature for a burst to occur in a typical pore throat configuration in the model. In this configuration, the fluid–fluid interface connects two posts with diameters  $d$ (i.e. the median post diameter in the system), where the closest distance between these posts is equal to $a$ (i.e. the median pore throat size in the system). The wettability of the posts is the same, and their contact angles are equal to $\theta$. After translation and rotation of the coordinate system, the centre of post A is positioned at $(0,0)$, and the centre of post B is located at ( ${a+d}, 0$). Figure 7 shows the fluid–fluid interface arc $\overset {\huge \frown }{CD}$ with the centre P $(x_p,y_p)$ in the pore throat. We denote the distance between points A and P as $d_1$, which is given by the cosine law at the triangle APC as
 \begin{equation} d_1 =\sqrt {\left(\frac{d}{2}\right)^2+r_p^2 - 2 \left(\frac{d}{2}\right) r_p \cos \theta}. \end{equation}
We denote the distance between points B and P as  $d_2$, which is equal to $d_1$.

Figure 7. Fluid–fluid interface configuration at a median-size pore throat.
As defined in Primkulov et al. (Reference Primkulov, Talman, Khaleghi, Shokri, Chalaturnyk, Zhao, MacMinn and Juanes2018), a burst event occurs when the centre of the fluid–fluid interface has the configuration
 $$\begin{gather} X_p^2=d_1^2, \end{gather}$$
 $$\begin{gather}(X_p-X_2)^2=d_2^2, \end{gather}$$
where  $X_2$ is the $x$ coordinate of the centre of post B, and it is equal to $a+d$. Solving (B1)–(B3), we find the radius of curvature of the fluid–fluid interface corresponding to a burst event as
 \begin{equation} r_p=\frac{\hat{l} \cos {\theta} + \sqrt{\hat{l}^2 (\cos \theta)^2 + 1 + 2\hat{l} }}{\dfrac{2}{a}}, \end{equation}
where  $\hat {l}=d/a$. The mean curvature of the interface at a burst event is defined as $\kappa =(1/r_p+1/r_{out})$, where $r_{out}=h/(2\cos \theta )$ is the out-of-plane curvature of the interface. Consequently, the critical interface curvature for a burst to occur is equal to
 \begin{equation} \kappa=\frac{2\cos \theta}{h} + \frac{2}{{a}\bigl(\hat{l} \cos \theta + \sqrt{\hat{l}^2 (\cos \theta)^2 + 1 + 2\hat{l} }\bigr)}. \end{equation}
Appendix C. Derivation of the dimensionless cooperative number
To determine whether a burst event precedes an overlap event in a pore throat, we define the dimensionless cooperative number  $N_{coop}$. Figure 8 shows two adjacent pore throats consisting of three posts with similar diameter $d$, pore throat size $a$, and contact angle $\theta$, which is the most representative for our system. The angle between two neighbouring interfaces $\angle$ABC is denoted $\phi$. We denote the angle between the line connecting points D and B, and the line connecting A and B, as $\eta _1$. Similarly, we denote the angle between the line connecting points G and B, and the line connecting B and C, as $\eta _2$.

Figure 8. Fluid–fluid interface configurations at two neighbouring pore throats.

Figure 9. Here,  $Ca^{\star }$ and $N_{coop}^{\star }$ explain the variations in $w_f$ in 15 different mixed-wet domains ( $\theta _{w}\unicode{x2013}\theta _{o}=30^{\circ }\unicode{x2013}120^{\circ }$, $60^{\circ }$– $120^{\circ }$, $60^{\circ }$– $150^{\circ }$; $f_{w}=2\,\%, 26\,\%, 50\,\%, 76\,\%, 98\,\%$) over a wide range of capillary numbers.
Increasing the pressure of the invading fluid advances the two adjacent interfaces within the pore throat until they meet (i.e. an overlap event occurs). These two interfaces must satisfy the geometric condition  $\eta _1+\eta _2=\phi$ (Holtzman & Segre Reference Holtzman and Segre2015). To determine whether a burst event is preceded by an overlap event, we must calculate $\eta _1$ and $\eta _2$, corresponding to a burst event, and then calculate $\lambda$:
 \begin{equation} \lambda= \phi-(\eta_1+ \eta_2). \end{equation}
Here,  $\lambda >0$ indicates that $\eta _1+\eta _2<\phi$, thus a burst occurs before the interfaces can overlap. In contrast, $\lambda <0$ suggests that $\eta _1+\eta _2>\phi$, which means that an overlap event will take place and the interfaces merge and form a new fluid–fluid interface. Given that the pore throats in the system are similar, and consequently so are the burst radii of the interfaces, we can rewrite the equation with $\eta _1=\eta _2=\eta$ and define the cooperative number $N_{coop}$ as
 \begin{equation} N_{coop}=\frac{\lambda}{2}= \frac{\phi}{2}-\eta. \end{equation}
 In figure 8, we connect points P and B to form a line with length  $d_1$. We then define the right triangle BPF with acute angle $\alpha$ given by
 \begin{equation} \alpha =\arccos \left(\frac{{a+d}}{2 d_1}\right). \end{equation}
Applying the cosine law in the triangle BPD gives
 \begin{equation} \frac{d}{2}=\sqrt {r_p^2+d_1^2-2 d_1 r_p \cos {\beta}}, \end{equation}
where  $\beta ={\rm \pi} -\eta -\alpha -\theta$. We rearrange (C4) as
 \begin{equation} \eta = {\rm \pi}- \arccos \left(\frac{r_p^2+d_1^2-\dfrac{d^2}{4}}{2 d_1 r_p}\right)- \arccos \frac{a+d}{2 d_1}- \theta. \end{equation}
Substituting (C5) into (C2) gives
 \begin{equation} N_{coop}= \frac{\phi}{2}+ \theta + \arccos\left({\frac{r_{p}^2 + d_1^2 - \dfrac{d^2}{4}}{2 d_1 r_{p}}}\right) + \arccos\left({\frac{ a + d }{2 d_1}}\right)- {\rm \pi}. \end{equation}


 Open access