


1. Introduction
A thermal formally refers to an isolated mass of buoyant fluid that is instantaneously released from rest (Morton, Taylor & Turner Reference Morton, Taylor and Turner1956), or, equivalently, the special case of a buoyant vortex ring whose circulation is entirely generated by buoyancy (Turner Reference Turner1973). Turbulent thermals may take the form of microbursts or downbursts (Lundgren, Yao & Mansour Reference Lundgren, Yao and Mansour1992). When they are particle laden they are of common occurrence in open-water sediment disposal (Bush, Thurber & Blanchette Reference Bush, Thurber and Blanchette2003; Zhao et al. Reference Zhao, Law, Adams and Er2014).
In other phenomena, thermals are not inert and are observed to actively generate buoyancy, e.g. in the early stages of cumulus cloud formation by the release of latent heat as water vapour condenses (Narasimha et al. Reference Narasimha, Diwan, Duvvuri, Sreenivas and Bhat2011). Nuclear reactions play a similar role within radiogenic thermals produced by radioactive nuclear explosions (Domingos & Cardoso Reference Domingos and Cardoso2015), in convection-driven flows in the Earth's mantle (Griffiths Reference Griffiths1991) and even in supernova explosions (Aspden et al. Reference Aspden, Bell, Dong and Woosley2011). In underwater bubble-laden thermals the source of buoyancy generation lies in the convective growth of the gas bubbles as the thermal cloud ascends through the gas-supersaturated liquid (Mott & Woods Reference Mott and Woods2010; Rodríguez-Rodríguez, Casado-Chacón & Fuster Reference Rodríguez-Rodríguez, Casado-Chacón and Fuster2014).
Turbulent bubble-laden thermals in supersaturated carbonated water appear in the beer tapping prank (Rodríguez-Rodríguez et al. Reference Rodríguez-Rodríguez, Casado-Chacón and Fuster2014), and, at larger scales, in the historic gas-driven eruptions of Lake Monoun in 1984 and Lake Nyos in 1986 (Zhang & Kling Reference Zhang and Kling2006; Mott & Woods Reference Mott and Woods2010). The mechanisms triggering the formation of the bubble cloud or thermals can be quite diverse, including pressure wave- or laser-induced cavitation (Rodríguez-Rodríguez et al. Reference Rodríguez-Rodríguez, Casado-Chacón and Fuster2014), chemical reactions (Turner Reference Turner1963) and nucleation on particle-laden currents (Mott & Woods Reference Mott and Woods2010). Rodríguez-Rodríguez et al. (Reference Rodríguez-Rodríguez, Casado-Chacón and Fuster2014) gave a detailed account of the bubble cloud formation within the first 200 ms, during which a clear transition from a diffusion-driven stage to a buoyancy-driven stage occurs. However, the motion and growth dynamics of thermals beyond that point remains little explored.
In this work we investigate experimentally laser-induced CO $_2$ bubble-laden thermals as they ascend through surfactant-containing carbonated water at different degrees of supersaturation. The thermal growth dynamics and motion expectedly differ from those reported by Turner (Reference Turner1963) where the (unknown) gas production rate was sustained and limited by a chemical reaction.
In our case, by additionally measuring the gas generation rate directly, we aim to provide valuable insight into the dynamics of rising bubble-laden thermals. To the best of our knowledge, there exist no studies where the rate of gas volume generation is accurately quantified. Although Turner (Reference Turner1963) measured the volume of liquid overflow in the container where the thermal developed, his experimental results understandably lacked the level of precision that can be achieved by measuring with a high time resolution the pressure build-up in the tank, as we do here. This information will prove to be essential to disentangle the hydrodynamics of the thermal from mass transfer effects.
In § 2 we detail the experimental set-up and the methods used to measure the time evolution of the thermal features. Section 3 analyses the growth rate and rise speed of the thermals, in addition to that of the bubbles found therein. Furthermore, we present a phenomenological model to explain qualitatively the experimental observations. In § 4 we put some of the main findings into perspective. Finally, in § 5 we present the conclusions and some open questions.
2. Experimental method
The experiments were performed in a 2000 ml borosilicate glass bottle (136 mm base diameter, Labbox) filled with  ${\sim }1800$ ml of distilled water and 700 mg of surfactant (sodium dodecyl sulphate, SDS) to a height of ${\sim} 150$ mm. The water was carbonated in the bottle directly at a saturation pressure ${P_{sat}} = 2$, 3 or 4 bar. This was done by injecting CO $_2$ gas from a tank through the lid valve and placing the bottle atop a magnetic stirrer for efficient mixing. Once saturated, the stir bar inside the bottle was carefully raised and kept pressed against a dry portion of the glass bottle by means of a magnet.
Keeping the lid valve closed, the bottle is then integrated with the rest of the set-up, as sketched in figure 1. The bottle is connected to an inclined manometer, whose arm discharges into a digital differential pressure sensor (Sensirion, SDP600-500Pa), with the remaining end exposed to the ambient. The gauge pressure  $p\geq 0$ in the ‘gas reservoir’, namely the enclosure of gas trapped between both free liquid surfaces when the exhaust valve is closed, is very well approximated by the hydrostatic pressure. Such a quantity is readily offered by the manometer, whereas the digital pressure sensor offers a measurement of $\mathrm {d} p/\mathrm {d} t$ instead. The simultaneous use of the inclined manometer and the digital pressure sensor allows us to combine the high absolute accuracy of the former with the high temporal resolution (200 Hz) of the latter.

Figure 1. Sketch of the experimental set-up. A laser pulse generates a bubble cloud that ascends and grows in the form of a (vortical) thermal. The manometer and pressure sensor ultimately provide a measurement of the total gas bubble  $V_b$ contained in the thermal.
The experiment begins by gradually opening the lid valve with the exhaust valve open. The pressure in the bottle and reservoir falls to the ambient value,  $P_0 = 1$ bar; the water immediately becomes oversaturated with CO $_2$. The degree of CO $_2$-oversaturation is effectively quantified by approximating the system as a binary CO $_2$–water solution in contact with a dry CO $_2$ gas reservoir at all times. In doing so, we neglect the presence of dissolved air in the solution and the fact that the gas reservoir is likely saturated with water vapour. This approximation is justified given that the vapour pressure is two orders of magnitude smaller than ${P_{sat}}$ or $P_0$; a similar disparity in magnitude applies between the concentrations of dissolved air and CO $_2$. In such a case, Henry's law sets $C_0 = k_H {P_{sat}}$ as the initial CO $_2$ concentration in the liquid and $C_{sat} = k_H P_0$ as the new saturation (equilibrium) CO $_2$ concentration upon depressurization, where $k_H(T)$ denotes the Henry coefficient for CO $_2$ gas in water. The degree of supersaturation can be then conveniently described by the parameter (Enríquez et al. Reference Enríquez, Hummelink, Bruggert, Lohse, Prosperetti, van der Meer and Sun2013) $\zeta \equiv C_0/C_{sat}-1 \equiv {P_{sat}}/P_0-1>0$.
Upon depressurization, the exhaust valve is subsequently closed and the gauge pressure builds up, consequence of the continuous diffusion-driven (background) degassing. A few seconds after, the cavitation event is triggered (at time  $t = 0$) by focusing a single low-energy Nd:YAG laser pulse (Quantel CFR400) on the liquid with a spherical lens. The focal point lies $\sim$5 mm above the centre of the bottle base. The laser pulse energy (between 40–70 mJ) was measured by splitting the beam through a 1 : 10 beam splitter (Thorlabs Gmbh) and driving the lesser portion into a laser pulse energy meter (Coherent EnergyMax). Thereby, a bubble-laden vortex or thermal forms and ascends until breaking at the free surface located $\sim$14 cm above the focal point. The whole process, which lasts less than 3 s, is captured at 500 f.p.s. (shutter speed 1/4000, resolution 0.08 mm pixel $^{-1}$) with a high-speed camera (Redlake X3+). Owing to the constant curvature of the thin-walled cylindrical bottle, the images are distorted radially by a constant factor of $1/n$, where $n = 1.33$ is the refractive index of water. At the same time, in addition to the sensor measurements, a second camera (iPhone XR) records the manometer. Both pressure measurements are acquired for about 25 s, after which the exhaust valve is then abruptly opened and the column of water recedes back to the starting position. Overall 19 thermals at three different degrees of liquid oversaturation were analysed: five (thermals i-v) at ${P_{sat}} = 2$ bar ( $\zeta = 1$) and ambient temperature $T \approx 30\,^{\circ }$C, six (vi-xi) at 3 bar ( $\zeta = 2$) and 27 $^{\circ }$C and eight (xii-iv) at 4 bar ( $\zeta = 3$) and 28 $^{\circ }$C . Experimental videos of thermals i, ii, v, vi, ix, xi, xii, xiv, xviii and xix can be found in the supplementary movies available at https://doi.org/10.1017/jfm.2021.655. The maximum laser power we could employ is limited by the saturation of the pressure measurement.
The evolution of a typical thermal at  $\zeta = 1$ and $\zeta = 2$ is portrayed by a sequence of snapshots equispaced in time in figures 2( $a$) and 2( $b$), respectively. The bounding boxes delimit the dimensions of the thermal core, namely the height $h$ and half-width $b$. The centroid ( $x_c$, $z_c$) of the projected area of the thermal core sets the vertical centroid axis $x_c$, in addition to the vertical trajectory of the thermal $z_c(t)$, where $z_c(0) = 0$, and the thermal vertical velocity $w = \mathrm {d} z_c/\mathrm {d} t$. The thermal core is defined by the largest connected region (where the projected area of the bubbles connect or overlap) of the binarised image. The total volume engulfed by the thermal, $V_t$, was estimated as the sum of the volumes of revolution of the thermal core (assuming axisymmetry about $x_c$) and of all other remaining bubbly regions (which correspond to either smaller connected bubble clusters or isolated bubbles).
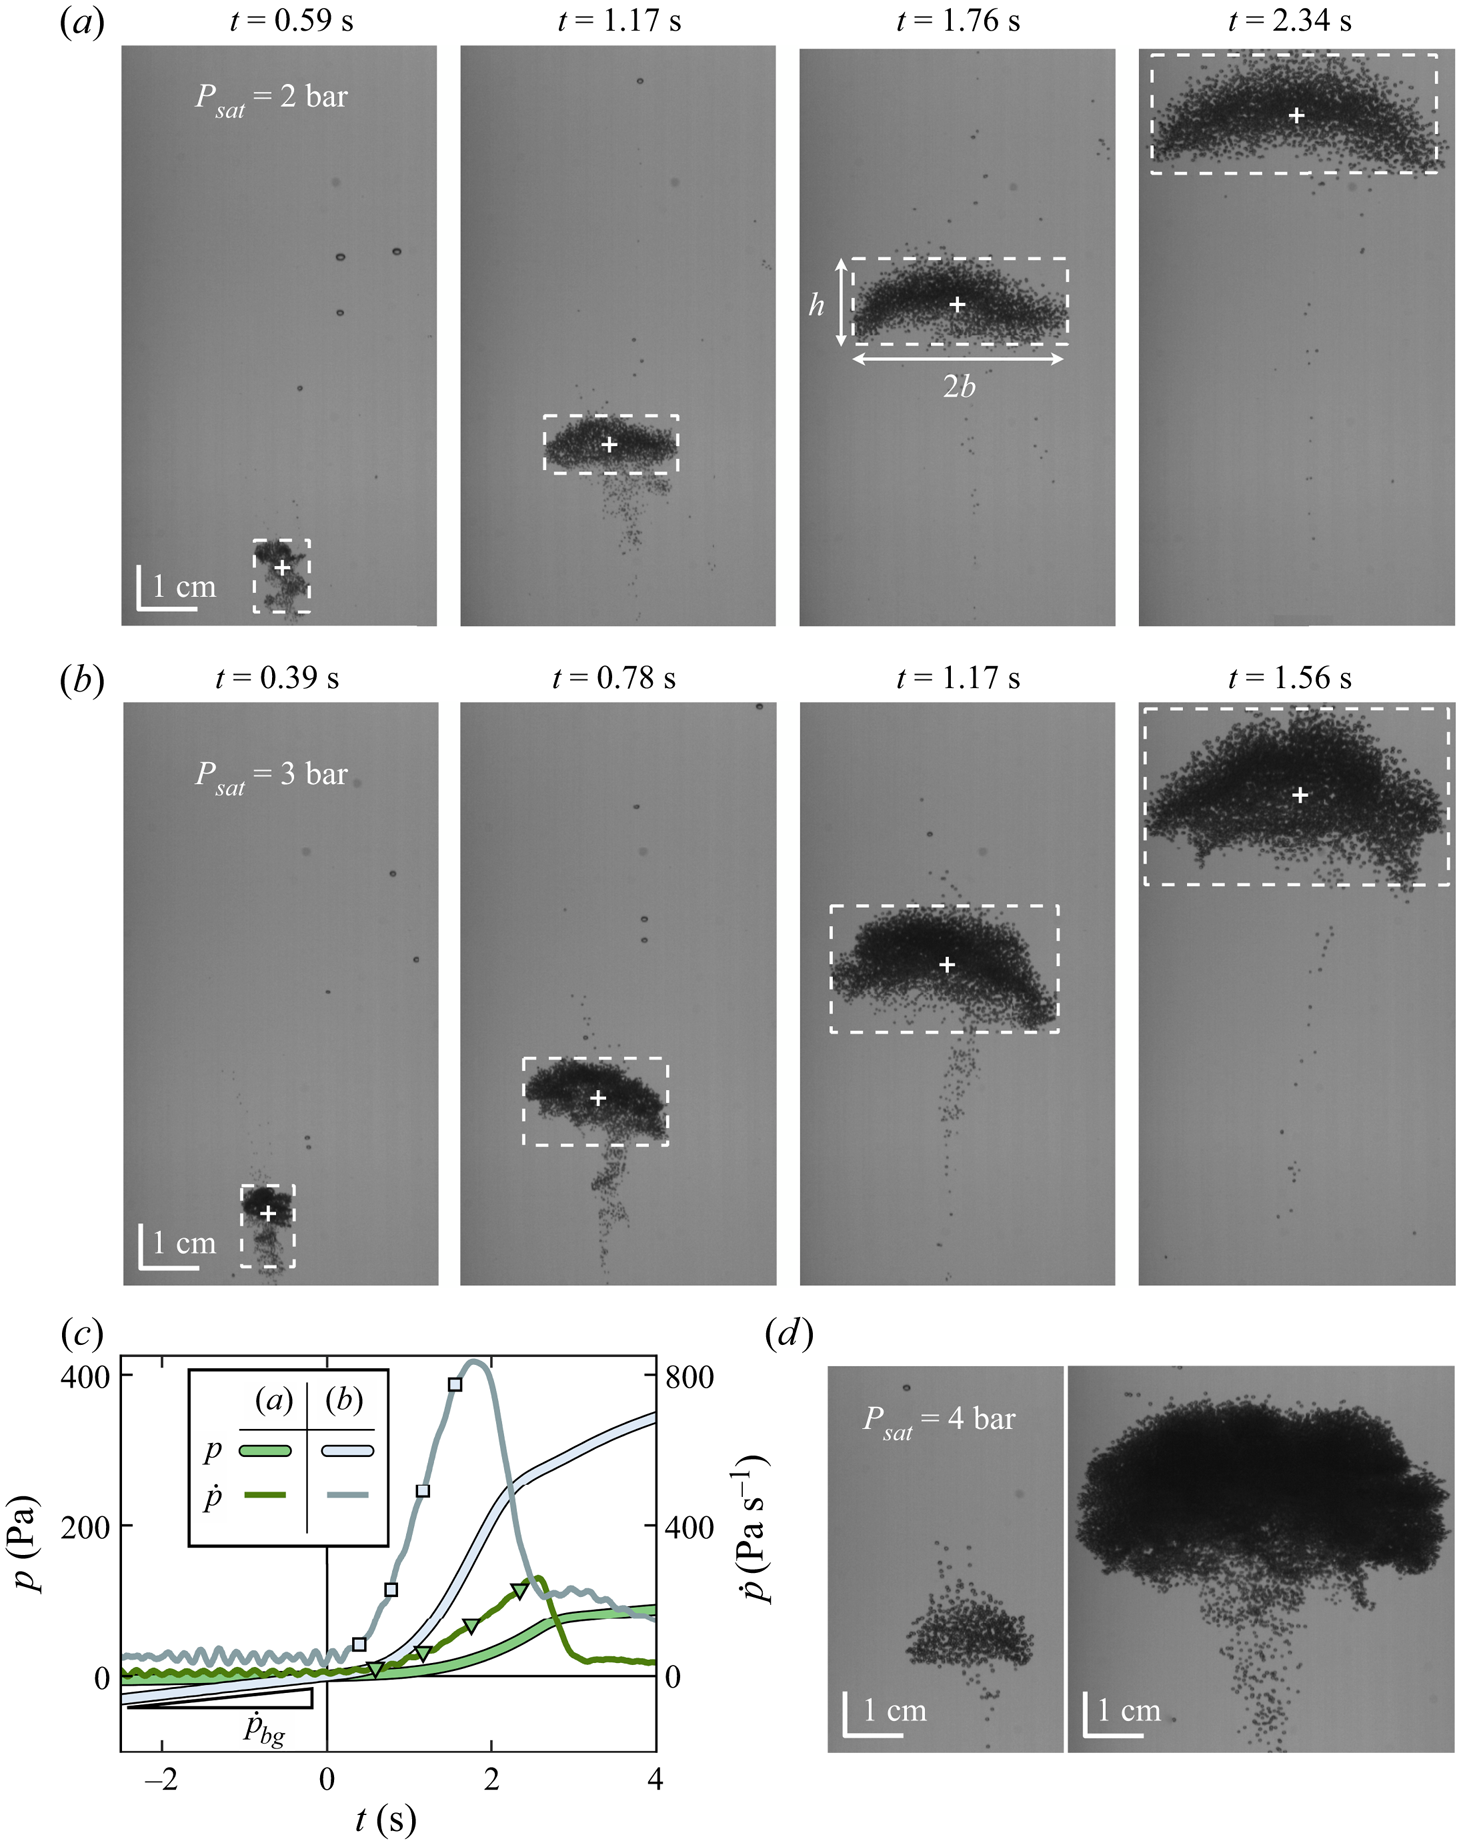
Figure 2. ( $a$) Snapshots of a turbulent bubble-laden thermal ascending in carbonated water at ${P_{sat}} = 2$ bar (pulse energy 69.9 mJ, thermal v). The laser-induced cavitation event occurs at $t = 0$. In the last snapshot, the top of the thermal is very close to the free surface. The dashed bounding box delimits the dimensions of the thermal core (height $h$ and width $2b$); marker ‘+’ locates its centroid. ( $b$) Equivalent snapshots for a different thermal when ${P_{sat}} = 3$ bar (pulse energy 55.1 mJ, thermal vi). ( $c$) Gauge pressure $p$ (manometer) and its time derivative (digital pressure sensor) corresponding to the thermals in ( $a$) and ( $b$). The markers highlight the pressure corresponding to the times at which the snapshots are taken. The mean rate of diffusive degassing can be estimated from the slope of $p(t<0)$. ( $d$) Snapshots of two different thermals taken at $t = 1$ s; both thermals are generated at ${P_{sat}} = 4$ bar, and both panels share the same vertical axis. Left: pulse energy 47.1 mJ (thermal xiv). Right: pulse energy 58.3 mJ (thermal xix). As seen by the scale bars of the snapshots, the horizontal curvature of the cylindrical bottle magnifies the image horizontally by a factor of 1.33 (refractive index of water).
Laser-induced cavitation largely remains a stochastic process, yet increasing the laser intensity and/or liquid supersaturation generally increases the population of cavitation bubbles, resulting in a larger thermal. The influence of the laser intensity is corroborated by the difference in size between the two thermals at  $\zeta = 3$ in figure 2( $d$); the influence of supersaturation, by comparison of the thermals in ( $a$) and ( $b$) – despite the latter being generated at a lower intensity.
The population of bubbles constituting a thermal can be assumed to remain constant throughout the thermal lifetime. This is justified by the inclusion of the aqueous surfactant solution, which prevents bubble coalescence through the Marangoni effect (Takagi & Matsumoto Reference Takagi and Matsumoto2011). Marangoni stresses (tangential to the interface) generated by flow-induced non-uniformities of surfactant distribution hinder the drainage of the liquid film separating two adjacent bubbles (Dai & Leal Reference Dai and Leal2008; Soligo, Roccon & Soldati Reference Soligo, Roccon and Soldati2019). Coalescence is highly detrimental towards the formation of the bubble-laden vortex. In fact, when no surfactant was added, the bubble cloud was seen to ascend as a swarm of fewer well-separated large bubbles rather than a buoyant spheroid vortex densely packed with smaller bubbles. Furthermore, surfactant lowers the surface tension of the bubbles, thus promoting cavitation (Borkent et al. Reference Borkent, Gekle, Prosperetti and Lohse2009) and allowing for lower laser intensities.
The remaining quantity of interest is  $V_b$, the total gas volume inside the constituent bubbles of the rising thermals, from which the rate of gas generation (hence buoyancy) can be obtained. Assuming water to be incompressible and its CO $_2$-concentration expansion coefficient to be negligible (Vreme et al. Reference Vreme, Pouligny, Nadal and Liger-Belair2015), $V_b$ must therefore be equal to the reservoir volume displaced as the free surface in the bottle rises above its equilibrium height. The volume $V_b(t)$ can then be readily estimated from the pressure measurements $p(t)$. It follows that (see Appendix A for derivation)
 \begin{equation} \frac{V_b}{V_0} \approx (1+\beta)\frac{p-\dot p_{bg} t}{P_0}, \end{equation}
where  $\dot p_{bg}$ is the background rise rate of $p$ due to diffusive degassing, $V_0 = 524$ cm $^{3}$ the reservoir equilibrium volume and $\beta \simeq 0.5$ a compressibility constant of the reservoir. Figure 2( $c$) plots $p(t)$ associated with the thermals in figures 2( $a$) and 2( $b$) for reference.
3. Thermal growth and motion
3.1. Growth and spread of the thermal volume
After a transient formation stage of the order of 0.1 s, the thermal's dimensions grow in time in an approximately linear fashion. This is reflected in the evolution of the apparent total volume, which expands, within experimental error, as  $V_t \propto t^{3}$ (see figure 3). Consistently, the maximum thermal width $2b$ and height $h$ both grow linearly in time (see figure 4). The thermal aspect ratio was observed to remain reasonably constant in time for all thermals, with an average value of $h/2b = 0.55$ for all experiments.

Figure 3. Time of evolution of the total thermal volume for all the thermals. The data markers are coded by the corresponding supersaturation level (or  ${P_{sat}}$): $\zeta = 1$ (green triangles), $\zeta = 2$ (blue squares) and $\zeta = 3$ (orange circles). In addition, the colour intensity of the markers is coded with the energy of the laser pulse. The black solid line represents the $V_t \propto t^{3}$ scaling law.

Figure 4. Time of evolution of the ( $a$) thermal width and ( $b$) thermal height for all 19 experiments. The markers are colour-coded in the same way as described in figure 3. The black solid lines represent the $b \propto t$ and $h \propto t$ scaling laws, respectively.
The maximum-width locii plotted on figure 5( $b$) reveals that our bubble-laden thermals spread in an approximately linear fashion with height. The mean slope of half-spread, $\alpha = b/z_c$, commonly known as the entrainment coefficient, was found to be 0.18 for all 19 thermals, and it is within the range of 0.1–0.3 reported by previous studies on thermals of different nature (Scorer Reference Scorer1957; Woodward Reference Woodward1959; Richards Reference Richards1961; Turner Reference Turner1963; Bush et al. Reference Bush, Thurber and Blanchette2003; Zhao et al. Reference Zhao, Law, Lai and Adams2013). Our results also show that the spreading angle (hence, entrainment coefficient) remains largely independent of the degree of gas supersaturation for thermals of similar size. The outlying orange curve corresponds to the largest thermal (xix). This suggests that $\alpha$ can very well increase with the number of bubbles populating the thermal bubble number or, correspondingly, increasing laser pulse energy and/or $\zeta$ in our experimental set-up. Nonetheless, besides the existence of this outlier, we have not found any significant trend in the dependence of the entrainment coefficient with these parameters.
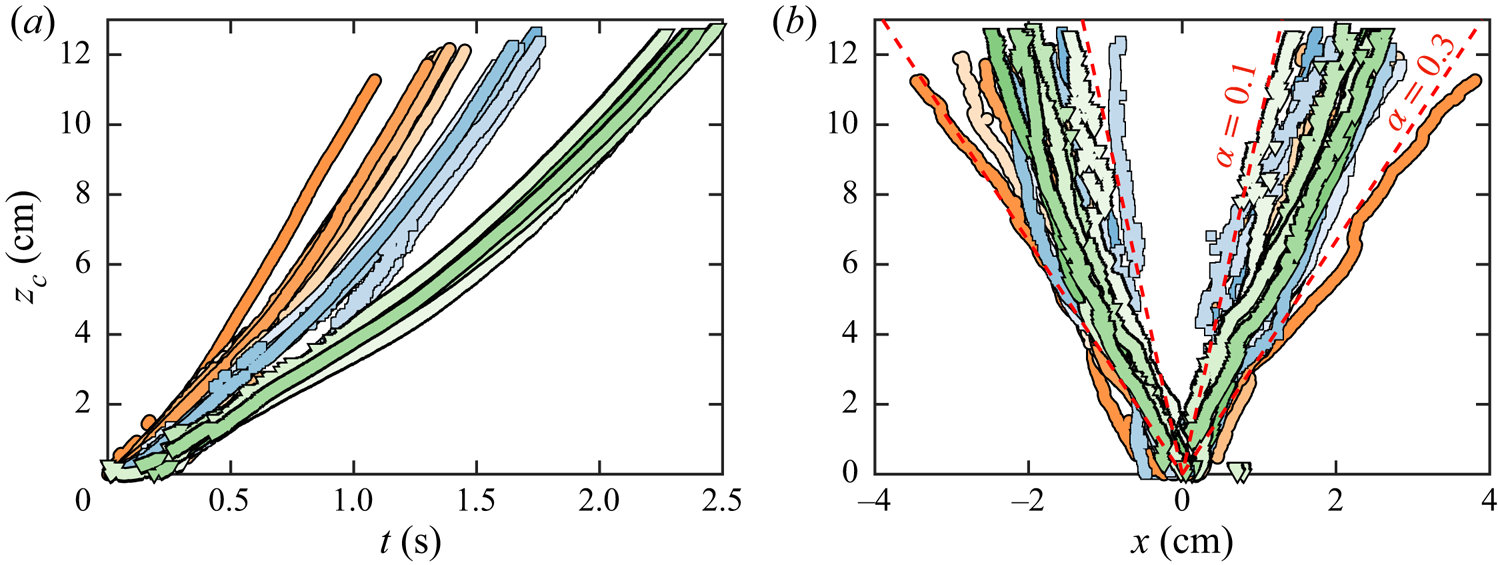
Figure 5. ( $a$) Vertical trajectory of the thermal centroid. ( $b$) Thermal profiles, i.e. the horizontal positions delimiting the maximum width of the thermal ( ${\rm \Delta} x = 2b$), plotted as a function of the centroid altitude $z_c$. The dashed red lines outline the spread corresponding to entrainment coefficients $\alpha =0.1$ and $\alpha =0.3$. Both plots show all 19 experiments; the markers are colour-coded in the same way as described in figure 3.
Finally, it should be pointed out that the scatter in the data between different experiments, most noticeable in the thermal height, width and spread, is mainly a consequence of the lack of precise control on the initial bubble distribution (an intrinsic feature of the laser-pulse technique used to generate the thermals).
3.2. Bubble sizes and velocities
The bubbles in the thermal grow from micrometric sizes at their inception (Rodríguez-Rodríguez et al. Reference Rodríguez-Rodríguez, Casado-Chacón and Fuster2014) up to 1 mm in diameter a few seconds later. The latter could be estimated by directly tracking an extensive number of individual bubbles sufficiently separated from the thermal core. These bubbles are hereon referred to as free bubbles (subscript fb). Typical vertical trajectories of such bubbles are exemplified in figure 6( $a$) for one particular experiment. Figure 6( $b$) reveals that free bubbles above the thermal core generally have smaller absolute velocities than those below it. The vortical flow field induced by the thermal slightly slows down and sometimes engulfs bubbles directly above it, whereas bubbles in its wake are notably accelerated upwards towards its core. It is seen that most of these bubbles do not quite follow Stokes’ terminal velocity for an isolated rising (massless) bubble,
 \begin{equation} U{_{fb}} = \frac{2}{9\nu}g R_{fb}^2,\end{equation}
where  $\nu$ is the kinematic viscosity of water. Inertial forces thus play a role, in agreement with the fact that the upper-bound Reynolds number of an individual bubble is not precisely small, ${Re}{_{fb}} \equiv 2 R{_{fb}}U{_{fb}}/\nu \sim 100$. The effect of the Reynolds number on the bubble drag and, hence, on the terminal velocity can be quantified by making use of the standard drag curve of a solid sphere. The buoyancy and drag balance reads as
 \begin{equation} \frac{4}{3}{\rm \pi} \rho_l R_{fb}^{3} = \frac{1}{2} C^{fb}_d {\rm \pi}R_{fb}^{2} \rho_l U_{fb} , \quad \mbox{where } C^{fb}_d({Re}{_{fb}}) = \frac{24}{{Re}{_{fb}}} [ 1 + 0.15 {Re}_{fb}^{0.687}].\end{equation}
Here, the empirical relationship of the drag coefficient  $C^{fb}_d({Re}{_{fb}})$ has been taken from Clift et al. (Reference Clift, Grace, Weber and Weber1978), and $\rho _l$ denotes the density of water. Note that in the limit ${Re}{_{fb}} \rightarrow 0$, $C^{fb}_d = 24/{Re}{_{fb}}$ and solution (3.1) is recovered. As seen in figure 6( $b$), the velocity of bubbles located above the thermal core appear to be very well described by (3.2), which coincides with the terminal velocity of a bubble rising in isolation. However, this is not true for those bubbles in the wake of the thermal, which consistently display velocities larger than the terminal one for an isolated bubble. This shows the strong effect that the thermal's wake has on the surrounding bubbles.

Figure 6. ( $a$) Vertical trajectories of ‘free’ bubbles sufficiently separated from the thermal core (thermal x). The dashed black curve outlines the vertical trajectory of the thermal centroid (third-degree polynomial fit, extrapolated for $z_c>12$ cm). Data points are size-coded by the bubble radius $R_{fb}$ and are colour-coded based on the instantaneous vertical distance from the bubble to the centroid height: $z_{fb}- z_c$; see colourbar in ( $b$). ( $b$) Absolute bubble speed as a function of $R^{2}_{fb}$ for the bubbles shown in ( $a$). The solid line plots the terminal velocity in (3.2), i.e. for a massless solid sphere following the standard drag curve; the dashed line plots Stokes’ terminal velocity (3.1). The grey shaded area delimits the experimental space for all the free bubbles analysed from all 19 thermals.
3.3. Gas volume growth rate
The total gas or bubble volume in the thermals also grows as  $V_b \propto t^{3}$, as seen in figure 7( $a$). This scaling law is in fact consistent with that observed for isolated gas bubbles rising in carbonated liquids after they have grown large enough to forget their initial size (Shafer & Zare Reference Shafer and Zare1991; Liger-Belair Reference Liger-Belair2005; Zenit & Rodríguez-Rodríguez Reference Zenit and Rodríguez-Rodríguez2018). In these conditions the growth rate of the free bubble radius can be regarded as a constant independent of the bubble size and follows (Zenit & Rodríguez-Rodríguez Reference Zenit and Rodríguez-Rodríguez2018)
 \begin{equation} \dot{R}_{fb} \sim \left(\frac{D^{2} g}{\nu}\right)^{1/3}H\zeta,\end{equation}
where  $D$ is the CO $_2$ gas diffusivity in water and $H$ the dimensionless Henry solubility or Ostwald coefficient (Sander Reference Sander2015) of CO $_2$ gas in water. Note that the Laplace pressure in the bubbles ( $<$1 kPa) has been neglected. All temperature-dependent properties ( $D$,
$D$,  $H$ and $\nu$) remain reasonably constant across all of our experiments. In such a case, the mean growth rate can be simplified to the form of
 \begin{equation} \langle\dot R_{fb}\rangle = K\zeta, \end{equation}
where  $K$ is the bubble growth constant. The growth constant was measured for every single free bubble detected. Namely, by means of a linear fit of $R_{fb}$ vs $t$ over the detection lifespan of the bubble. A mean value of $K = 0.161$ mm s $^{-1}$ was then obtained by linear regression of the growth constants of the entire free bubble population, as seen in figure 7( $c$). Inertial and water evaporation effects are effectively absorbed by the empirical coefficient $K$, thus extending the applicability of (3.4) beyond the framework of small Reynolds numbers (Zenit & Rodríguez-Rodríguez Reference Zenit and Rodríguez-Rodríguez2018) and non-volatile solvents. We must point out that every single CO $_2$ gas bubble is in reality saturated with water vapour at the equilibrium vapour pressure. The vapour content in the bubble is, a priori, not negligible, given that in our experimental conditions ( $T \approx 30\,^{\circ }$C, $P_0 = 1$ bar) water vapour can account for as much as 4.2 % of the bubble volume. However, the reason why the evaporation flux is fully contained in $K$ lies in the acknowledgement that CO $_2$-oversaturation ( $\zeta$) persists as the sole driving force behind bubble growth: evaporation simply amplifies the volume growth rate by a constant factor in order to maintain the relative humidity in the bubble at 100 % at all times.

Figure 7. ( $a$) Time evolution of the gas volume in the thermals as computed from the pressure measurements. ( $b$) Gas volume growth rate of the thermals as a function of their instantaneous gas volume. The black solid line represents the law $\dot V_b \propto V_b^{2/3}$. ( $c$) Histograms of $\dot R_{fb}$, the optically measured radius growth rate of a number of free bubbles detected outside the thermal cores; $n_{fb}$ denotes the bubble number frequency of all experiments sharing the same supersaturation, $\zeta = {P_{sat}}/P_0-1$. The horizontal black solid lines denote the mean growth rate pertaining to all experiments at a given supersaturation, dashed lines mark the mean growth rate of a particular experiment. The red line is a theoretical fit of the form $\langle \dot R_{fb}\rangle = K \zeta$, where $K =0.161$ mm s $^{-1}$ is a constant that depends on the liquid and gas properties. ( $d$) Mass transfer coefficient of the thermal gas volume, $C_b = \langle \dot V_b/V_b^{2/3} \rangle$, as a function of supersaturation. Each marker corresponds to a particular thermal. Each dashed line plots the theoretical coefficient expected for a cloud composed of $N$ bubbles, as given by (3.7). ( $e$) Plot of $C_b$ as a function of the mass transfer coefficient of the total thermal volume, $C_t = \langle \dot V_t/V_t^{2/3}\rangle$. The slope of the linear regression fit yields the average gas volume fraction of the thermals, namely $\phi \simeq 3\,\%$. All thermals have been considered, except thermal xix due to saturation of its digital pressure measurement which rendered it unusable. The markers are colour-coded in the same way as described in figure 3.
The fact that the volume of the bubbles inside the thermal grows in a similar fashion as for isolated bubbles is somewhat surprising at first sight. One could expect the bubbles inside the thermal to compete for the available CO $_2$, resulting in gas depletion and slower growth rates, as is the case for quasi-static bubble clouds (Vega-Martínez, Rodríguez-Rodríguez & van der Meer Reference Vega-Martínez, Rodríguez-Rodríguez and van der Meer2020). However, the mixing induced by the vortical motion of the thermal seems to replenish the dissolved CO $_2$ gas content within. As a result, the bubbles grow independently of their neighbours. This idea is supported by the fact that the Péclet number expected for our bubbles is large. Assuming a typical bubble diameter $d \approx 1$ mm and a bubble slip velocity of the order of that of the thermal, $U \approx 5$ cm s $^{-1}$ (see figure 8 $a$), we estimate ${{Pe}} = Ud / D \approx 25\ 000$. In other words, the mass transfer boundary layer where diffusion takes place (of order ${{Pe}}^{-1/3}d$) is much thinner than the typical distance between bubbles. This observation is consistent with previous studies on rising bubble swarms, where collective effects on mass transfer have been reported to remain small up to gas volume fractions as large as 30 % (Colombet et al. Reference Colombet, Legendre, Risso, Cockx and Guiraud2015).
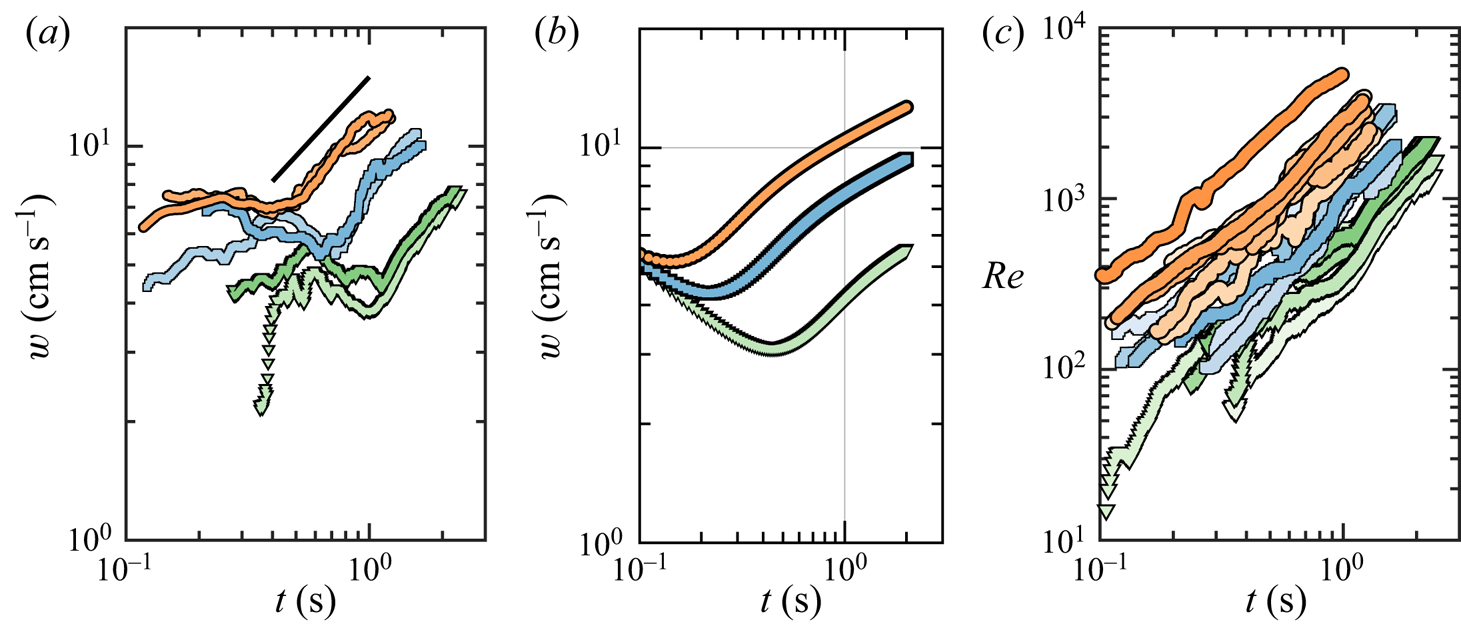
Figure 8. ( $a$) Time evolution of the rise speed of the thermals, $w$, for a selection of experiments at $\zeta = 1$ (thermals iii, v), $\zeta = 2$ (ix, xi) and $\zeta = 3$ (xvii, xviii). The slope of the black solid line is 2/3. ( $b$) Numerical prediction of the model given in (3.8)–(3.9) for $\zeta = 1$ (green curve), $\zeta = 2$ (blue) and $\zeta =3$ (orange). ( $c$) Time evolution of the Reynolds number based on the thermal volume, ${Re} = V_t^{1/3} w / \nu$, for all 19 experiments. The markers in ( $a$) and ( $c$) are colour-coded in the same way as described in figure 3.
The observation that bubbles in the thermal grow nearly as if they were isolated allows us to connect their growth rate with that of the thermal. In other words, such an observation leads us to the assumption that the bubbles inside the thermal grow in the same manner as the free bubbles in its periphery, which also inherently implies that the terminal slip velocity in both cases is quite comparable. In point of fact, assuming that the thermal is composed of  $N$ identical bubbles,
 \begin{equation} V_b = \frac{4{\rm \pi} }{3} N R_{fb}^{3}, \end{equation}
we predict that the growth rate of the total gas volume should scale as
 \begin{equation} \frac{\mathrm{d}V_b}{\mathrm{d}t} = 4{\rm \pi} N \dot R_{fb} R_{fb}^{2} = C_b V_b^{2/3}, \end{equation}
where the mass transfer coefficient  $C_b$ can be used to infer the approximate number of bubbles that make up the thermal. Upon taking $\dot R_{fb} = \langle \dot R_{fb}\rangle = K\zeta$, we obtain
 \begin{equation} C_b = (36{\rm \pi} N)^{1/3} K \zeta. \end{equation}
The experimental data in figure 7( $b$) suggests the scaling $V_b \propto V_b^{2/3}$, which is in full support of (3.6). The coefficient was computed for every thermal (within its fully developed region) as $C_b= \langle \dot V_b/V_b^{2/3} \rangle$. It is plotted as a function of $\zeta$ in figure 7( $d$), alongside the theoretical expression (3.7) for different values of $N$. The latter reveals our thermals to consist of the order of $N = 100$ to 2000 bubbles.
The total volume occupied by the thermal was found to scale in the same way:  $\dot V_t = C_t V_t^{2/3}$, where $C_t$ is the mass transfer coefficient of the total thermal volume. Assuming that the gas volume fraction of the thermal, $\phi = V_b/V_t$, remains constant over time, the average volume fraction obeys $\phi ^{1/3} = C_b/C_t$. As shown in 7( $e$), all experiments adhere to a remarkably uniform value of $\phi \simeq 3$ %. The assumption that the bubbles in the thermal grow independently from each other is supported by the small value of $\phi$. It is substantially lower than the bubble area fraction one would optically infer from a two-dimensional snapshot of the thermal (cf. figure 2). This indicates that the thermal is not uniformly packed with bubbles, which is consistent with the vortical nature of thermals. Indeed, since the structure of a thermal is that of a buoyant vortex ring, we expect bubbles to cluster around the vortex core, thus leaving the region near the centre relatively depleted of bubbles.
3.4. Thermal rise speed
Despite the similarities between the volume growth rates of individual rising bubbles and the thermals, their velocities evolve in a substantially different way. The time evolution of the thermals’ rise velocity  $w$ can be rationalized within the framework of the single-phase model put forward by Bush et al. (Reference Bush, Thurber and Blanchette2003) for particle-laden settling thermals. In what follows we particularize this model for bubble-laden thermals assuming massless bubbles, and extend it to incorporate the effect of a time-varying buoyancy. Under these conditions, the mean density of the thermal reads as $\tilde \rho = (1-V_b/V_t)\rho _l$, where $\rho _l$ denotes the water density. Mass conservation yields
 \begin{equation} \frac{\mathrm{d}V_t}{\mathrm{d}t} = 4{\rm \pi} \alpha \eta b^{2} w + \frac{\mathrm{d}V_b}{\mathrm{d}t}, \end{equation}
where  $\eta = h/2b$ is the aspect ratio of the thermal, modelled as an oblate spheroid, and $\alpha$ the entrainment coefficient. Equation (3.8) states that the total volume transported by the thermal changes for two reasons: entrainment of bulk liquid at a rate given by the entrainment assumption (Morton et al. Reference Morton, Taylor and Turner1956), and generation of gas bubble volume.
The total momentum of the liquid entrained by the thermal can be expressed as  $(\tilde \rho + \rho _l \kappa )w V_t$, where $\kappa$ is the virtual mass coefficient. The momentum changes at a rate resulting from the competition between buoyancy and drag,
 \begin{equation} \frac{\mathrm{d}}{\mathrm{d}t}[w((1+\kappa) V_t - V_b)] = g V_b - C_d {\rm \pi}b^{2} w^{2},\end{equation}
with  $C_d$ the drag coefficient. Provided that $V_b(t)$ is known, the system of (3.8)–(3.9) can be integrated to obtain the thermal rise velocity, $w$, and the total volume, $V_t$, as functions of time. The instantaneous bubble gas volume is readily extracted from the experimental data. From (3.6) we get the following approximation: $V_b \approx V_{b0} + (C_b t / 3)^{3}$, with $V_{b0} = 1$ mm $^{3}$ and $C_b = 0.74 \zeta$ cm s $^{-1}$ as the average mass transfer coefficient. Similarly, we take $\eta = h/2b = 0.55$ and $\alpha = b/z_c = 0.18$ from the mean experimental values, whereas for $\kappa = 0$ and $C_d = 0.02$, we have adopted the values suggested in the literature for similar thermals (Bush et al. Reference Bush, Thurber and Blanchette2003).
The time evolution of the experimental  $w$ is shown in figure 8( $a$) for a selection of thermals, whereas the velocity computed from the numerical solution to the system (3.8)–(3.9) with the initial conditions $V_t(0) = V_b(0)$ (zero entrained liquid initially) and $w(0)=0$ is shown in figure 8( $b$) for oversaturations $\zeta = 1, 2$ and 3. The existence of two stages becomes apparent in both experiments and computations. In the first stage the thermals ascend at a speed that, within our experimental resolution, seems roughly constant, in agreement with the observations of Rodríguez-Rodríguez et al. (Reference Rodríguez-Rodríguez, Casado-Chacón and Fuster2014). The model suggests that this slowly varying velocity may actually be decreasing, as will be explained below. In a second stage the thermal accelerates at a rate that seems compatible with $w \sim t^{2/3}$. However, we must point out that, in our experiments, it is not possible to observe the thermals for enough time to make any quantitative assessment of the existence of any power law in the time dependence of the velocity.
Nonetheless, the behaviour of the thermal velocity in the two stages can be better understood using a simplified version of the system (3.8)–(3.9). Firstly, we use the fact that the gas volume fraction is small,  $\phi = V_b / V_t \ll 1$. Secondly, we neglect the drag term in the momentum conservation equation. This is justified noting that $g V_{bc} / C_d {\rm \pi}b_c^{2} w_c^{2} \approx 60$, after taking the following characteristic values: $w_c = 5$ cm s $^{-1}$ (figure 8 $a$),
$a$),  $V_{bc} = 0.1$ cm $^{3}$ (figure 7 $a$),
$a$),  $b_c = 1$ cm (figure 4 $a$) and $C_d = 0.02$. In fact, it would take values of $C_d$ almost of order unity to make drag important in the problem. The resulting set of equations then reads as
 \begin{equation} \frac{\mathrm{d}V_t}{\mathrm{d}t} \approx 4{\rm \pi} \alpha \eta b^{2} w, \quad \frac{\mathrm{d}(w V_t)}{\mathrm{d}t} \approx g V_b. \end{equation}
In the first stage the gas volume is nearly the initial one,  $V_b \approx V_{b0}$. After a transient, (3.10a,b) admits a solution in which $w \sim t^{-1/2}$ and $b \sim t^{1/2}$ (and, thus, $V_t \sim t^{3/2}$). In fact, since during this stage the buoyancy remains effectively constant, we recover the classical scalings of Morton et al. (Reference Morton, Taylor and Turner1956). In this regime the total momentum of the thermal grows linearly in time but this increment cannot compensate the growth of the thermal's mass via entrainment, which results in a decreasing velocity. This trend persists until a crossover time when the gas volume exsolved into the bubbles is comparable to the initial gas volume present in the thermal, as revealed by the model. The times at which these two volumes coincide, $t \approx 3V_{b0}^{1/3}/C_b \approx$ 0.14 s, 0.20 s and 0.41 s for $\zeta = 1, 2$ and 3, respectively, are in good agreement with the times at which the numerically computed velocities reach their minimum.
In practice this means that the first regime may not be observed as such, given that the initial transient during which the velocity and volume evolve from the initial conditions to the solution just described might take longer than the crossover time gas volume generation takes to surpass the initial gas volume. Naturally, the crossover time will be shorter the larger  $\zeta$ is. For this reason, in our experiments, this first stage is more pronounced in the thermals with $\zeta = 1$. We must remark here that we are assuming that Morton's entrainment model applies at all times, even though when the thermal is small it is reasonable to expect that it is less efficient at entraining liquid from the bulk – which may explain why the velocity observed during the first stage in the experiments is more constant than that predicted by our model. Nonetheless the conclusions drawn from the model are not expected to be affected by this fact.
A second stage takes place after the crossover time, where  $V_b \approx (C_b t / 3)^{3} \gg V_{b0}$. Using this expression, a solution to (3.10a,b) can be found where $w \sim t^{1/4}$, $b \sim t^{5/4}$ and $V_t \sim t^{15/4}$. In this regime the fast generation of buoyancy overcomes the slowing effect of entrainment, which results in a net acceleration. In our experiments the velocity seems to grow as $t^{2/3}$, i.e. faster than the theoretical scaling of $t^{1/4}$. We attribute this effect to the fact that we are not able to observe the thermal's evolution for sufficiently long times to accurately determine the existence of a given power law. Moreover, this asymptotic trend may never be observed, as we expect the buoyant velocity of the bubbles beyond a critical bubble size to exceed that of the thermal. After this happens, bubbles would rise as if they were isolated. An analogous effect was observed by Bush et al. (Reference Bush, Thurber and Blanchette2003) for particle-laden thermals.
4. Discussion
Despite the quantitative differences between the experiments and the model's predictions, the model is able to reproduce qualitatively the most salient features of the thermal's dynamics, namely the existence of the two observed regimes. Moreover, we highlight that the magnitude of the thermal velocities is reasonably well captured, despite the many underlying simplifications of the single-phase model and the fact that the model has no free parameters to fit. For this reason, we do not expect the model to reproduce quantitatively the initial formation stage of the thermal. Even under the assumption that the entrainment hypothesis of Morton et al. (Reference Morton, Taylor and Turner1956) can be applied there, the effective values of  $\phi$, $C_d$ and $\alpha$ and the scaling of the buoyancy generation rate are all expected to be quite different than those which better describe the later stages.
An intriguing point that deserves special mention is the fact the bubble gas volume grows as the cubic power of time. Although this is consistent with the equation describing the growth of individual rising bubbles in a CO $_2$-supersaturated solution ((3.3)), the derivation of this expression requires the bubble rise velocity to scale approximately as the radius squared (Zenit & Rodríguez-Rodríguez Reference Zenit and Rodríguez-Rodríguez2018). Namely, as (3.1), a result which arises from the balance between buoyancy and Stokes’ viscous drag.
However, that is not the case for the collective rise velocity of the thermal. Such a scaling would translate into  $w \sim V_b^{2/3} \sim t^{2}$, which implies an acceleration much faster than that observed in our thermals. A potential explanation for this paradox could be that the mixing induced by the vortical motion or the thermal makes bubbles exchange mass with the bulk liquid in a much more efficient way than if they were isolated. In fact, the Reynolds numbers characterizing the ascending motion of the thermal, ${Re} = V_t^{1/3} w / \nu$, are large enough to expect an efficient mixing inside (see figure 8 $c$).
$c$).
To conclude, we point out that the model predicts that the total volume  $V_t$ grows faster than the gas one $V_b$ at long times. However, this effect is hard to observe in experiments for two reasons. First, the difference in these volume growth rates falls below our experimental error. Second, the measured $V_t$ could be underestimating the liquid volume contained in the thermal, as we can only visualize the transported bubbles, not the thermal's liquid content outside the bubbly region.
5. Conclusions
We study experimentally the time evolution of the volume and velocity of bubble-laden thermals rising in CO $_2$-supersaturated water. The thermals are generated by laser-induced cavitation, which inherently implies a lack of precise control on the initial bubble distribution. Despite the resulting experimental variability between the different thermals, the gas and entrained volumes of all thermals consistently grow as a cubic power of time. This growth rate coincides with that of the sum of the volumes of the constituent bubbles, as if they were ascending without interacting with each other in the same liquid. Contrarily, the rise velocity of an individual bubble depends greatly on its location within the thermal, and the collective rise velocity of the thermal core behaves in a somewhat more complex way than that of an isolated bubble. For the latter, we observe two distinct regimes: an initial stage where the velocity is roughly constant, within our experimental error, and a subsequent stage where it clearly accelerates.
A phenomenological model, built by extending that of Bush et al. (Reference Bush, Thurber and Blanchette2003) to incorporate buoyancy generation, explains the existence of these two stages and predicts semi-quantitatively some features of the experiments. Namely, the magnitude of the velocities and the time at which the transition between the two stages occur.
To conclude, we must highlight here a question that we leave unanswered: why do bubbles in the thermal grow linearly in time, as isolated rising bubbles do, considering that the thermal rise velocity follows a slower scaling than that of isolated bubbles? We can only hypothesize that the slip velocity of the bubbles inside the thermal is such that it resembles, at least qualitatively, the one they would have if rising freely on their own. However, validation of this hypothesis would require tracking their relative motion inside the thermal, a commendable task beyond the means of this work.
Supplementary movies
Supplementary movies are available at https://doi.org/10.1017/jfm.2021.655.
Funding
We acknowledge the support of the Spanish Ministry of Economy and Competitiveness through grants DPI2017-88201-C3-3-R and DPI2018-102829-REDT, partly funded through European Funds. This work was supported by the Netherlands Center for Multiscale Catalytic Energy Conversion (MCEC), an NWO Gravitation programme funded by the Ministry of Education, Culture and Science of the government of the Netherlands.
Declaration of interests
The authors report no conflict of interest.
Appendix A. Gas bubble volume estimation
The gas reservoir (see figure 1) consists primarily of CO $_2$ gas, yet it is likely saturated with water vapour and probably contains a small amount of ambient air. We can treat the reservoir content as an ideal mixture of CO $_2$ gas (subscript $c$) and ‘wet air’ (water vapour and parasitic air mixture, subscript $w$). We assume that the evaporation flux is negligible during the short time scale of the experiment. In other words, the pressure rise $p(t)$ in the reservoir results purely from CO $_2$ diffusive degassing and bubble formation in the thermal. The wet air content in the reservoir can thus be regarded as constant, and the gaseous content in the reservoir obeys
 \begin{equation} [p(t)+P_0]V(t) = [m_c(t) R_c + m_w R_w]T, \end{equation}
where  $P_0 = 1$ bar is the ambient pressure, $T$ the absolute temperature, $V$ the reservoir volume, $m_c$ and $m_w$ the masses of CO $_2$ and wet air, respectively; $R_c$ and $R_w$ are the specific gas constants.
The gauge pressure in the reservoir is assumed to be equal to the hydrostatic pressure read off from the manometer inclined at 45 $^{\circ }$, i.e. $p(t) = \rho _m g L_m(t)/\sqrt {2}$, given that the dynamic and capillary pressures are quite negligible. As annotated in figure 1, $L_m$ refers to the length of the water column of density $\rho _m = 1000$ kg m $^{-3}$ relative to the initial length at the time of the laser pulse at $t= 0$. Hence, the initial condition $p(0) = 0$ assumes that the reservoir pressure is effectively $P_0$ at $t = 0$.
Volume conservation implies that  $V(t) = V_0 - V_b(t) + V_m(t)$, where $V_0 \approx 524$ cm $^{3}$ is the equilibrium volume, $V_b$ the gas bubble volume and $V_m = {\rm \pi}D_m^{2} L_m/4$, where $D_m = 4.8$ mm is the inner diameter of the manometer arm. From hydrostatics, $V_m/V_0 = \beta p/P_0$, where $\beta = {\rm \pi}D_m^{2} P_0/(2\sqrt 2 V_0 \rho _m g) \simeq 0.5$ quantifies the gas compressibility effects in the reservoir.
Combining all the expressions above, (A1) can be rewritten to relate any general change in  $m_c$ to $p$ and $V_b$ as
 \begin{equation} [m_c(t)R_c + m_w R_w]T = P_0[V_0(1 + \beta p(t)/P_0 ) - V_b(t) ]. \end{equation}
The pressure rise sustained by the diffusive background degassing rate was directly measured from  $\dot p(t<0)$ during the few seconds prior to thermal inception; typically $\dot p_{bg} \sim 10$ Pa s $^{-1}$. The background mass transfer rate $\dot m_{c, {bg}}$ and subsequently $V_b$ can be estimated assuming that $\dot p_{bg}$ remains constant in time up to the point where the thermal reaches the free surface. To do so, we first compute the time derivative of (A2) with $V_b = \dot V_b = 0$. Noting that $p/P_0 \ll 1$, we obtain
 \begin{equation} \dot m_{c, {bg}} = (1 + \beta)\frac{V_0}{R_cT} \dot p_{bg}. \end{equation}
Integration then yields  $m_c = m_c(0) + \dot m_{c, {bg}} t$, where the initial gas content is in accordance with the initial condition $P_0V_0/T = m_c(0) R_c+ m_w R_w$. Substitution into (A2) subject to the fact that $V_b/V_0 \ll 1$ finally results in
 \begin{equation} \frac{V_b}{V_0} = (1+\beta)\frac{p-\dot p_{bg} t}{P_0}. \end{equation}
The expression for the gas bubble volume  $V_b$ is thus independent of the initial gas and vapour composition of the reservoir.


 Open access