


Introduction
The current surface conditions of Mars are extremely harsh for any known life forms. Environmental factors such as low surface temperature, low atmospheric pressure, DNA damaging UV radiation and the presence of oxidizing compounds make Mars an inhospitable planet (Biemann et al., Reference Biemann, Oro, Toulmin, Orgel, Nier, Anderson, Simmonds, Flory, Diaz and Rushneck1977; Jakosky, Reference Jakosky1998; Cockell et al., Reference Cockell, Catling, Davis, Snook, Kepner, Lee and McKay2000). If life exists on the surface of Mars, it would have to challenge the environmental extremes of Mars and would have unique adaptation mechanisms. Therefore, the most feasible possibility of finding active known life forms on Mars would be ‘near or deep subsurface’, where the temperature and pressure will be higher compared with the surface and the environment will be protected from the damaging cosmic radiation. The discovery of extremophiles and the knowledge of Earth's subsurface biospheres have also bolstered the idea of searching for life in the subsurface of other planetary bodies such as Mars (Cavicchioli, Reference Cavicchioli2002).
The detection of methane in the Martian atmosphere (Formisano et al., Reference Formisano, Atreya, Encrenaz, Ignatiev and Giuranna2004; Krasnopolsky et al., Reference Krasnopolsky, Maillard and Owen2004; Mumma et al., Reference Mumma, Novak, DiSanti, Bonev and Dello Russo2004, Reference Mumma, Villanueva, Novak, Hewagama, Bonev, DiSanti, Mandell and Smith2009; Webster et al., Reference Webster, Mahaffy, Atreya, Flesch, Mischna, Meslin, Farley, Conrad, Christensen and Pavlov2015) has further reinforced the search for extinct or extant life on Mars. The reason is that most terrestrial methane is produced by biological sources either directly or indirectly (Atreya et al., Reference Atreya, Mahaffy and Wong2007). Methanogens are one of the various sources of methane on Earth. Some strains of methanogens have shown survivability and growth in simulated Martian physical and chemical conditions (Kral et al., Reference Kral, Bekkum and McKay2004, Reference Kral and Altheide2013, Reference Kral, Birch, Lavender and Virden2014, Reference Kral, Goodhart, Harpool, Hearnsberger, McCracken and McSpadden2015; McAllister and Kral, Reference McAllister and Kral2006; Sinha and Kral, Reference Sinha and Kral2015). For these reasons, methanogens, which are chemolithoautotrophic anaerobic archaea, have been considered ideal candidates for life on Mars (Boston et al., Reference Boston, Ivanov and McKay1992; Chapelle et al., Reference Chapelle, O'Neill, Bradley, Methé, Ciufo, Knobel and Lovley2002; Kral et al. Reference Kral, Bekkum and McKay2004, Reference Kral, Goodhart, Harpool, Hearnsberger, McCracken and McSpadden2015; Moran et al., Reference Moran, Miller, Kral and Scott2005; Chastain and Kral, Reference Chastain and Kral2012). The sources of methane on Mars are still unknown. Mars’ atmospheric methane could be the results of biotic, abiotic or a combination of both processes. Methanogens could be one of the several potential sources of Martian methane.
Stable carbon isotope fractionation is one of the several potential techniques to differentiate between biogenic and abiogenic sources of methane (Allen et al., Reference Allen, Sherwood Lollar, Runnegar, Oehler, Lyons, Manning and Summers2006). Stable carbon isotope fractionation data for terrestrial atmospheric methane have been used in order to understand the environments, pathways and origins or substrates of methanogenesis (Rothschild and DesMarais, Reference Rothschild and DesMarais1989; Schidlowski, Reference Schidlowski1992; Londry et al., Reference Londry, Dawson, Grover, Summons and Bradley2008). Sinha and Kral have recently studied the carbon isotope fractionation following methanogenesis on various Mars regolith analogues and found enriched values of 12C on the clay called montmorillonite compared with the carbon isotopic data obtained on other Mars analogues such as JSC Mars-1, Artificial Mars Simulant and Mojave Mars Simulant (Sinha and Kral, Reference Sinha and Kral2015).
Analogous to Earth's subsurface environments, hydrothermal systems might have existed and may also be present on Mars. On Earth, several hyperthermophilic and barophilic archaea have been isolated and characterized from the deep sea floor and hydrothermal sites (Canganella et al., Reference Canganella, Gonzalez, Yanagibayashi, Kato and Horikoshi1997; Horikoshi, Reference Horikoshi1998; Takai et al., Reference Takai, Inoue and Horikoshi2002; Shimizu et al., Reference Shimizu, Upadhye, Ishijima and Naganuma2011). Some of the most abundant species near hydrothermal vents are hyperthermophilic methanogens (Takai et al., Reference Takai, Gamo, Tsunogai, Nakayama, Hirayama, Nealson and Horikoshi2004). Life near a hydrothermal vent experiences a wide range of temperature and pressure. It has been found that a methanogen of genus Methanopyrus can grow up to a temperature of 110°C (Takai et al., Reference Takai, Nakamura, Toki, Tsunogai, Miyazaki, Miyazaki, Hirayama, Nakagawa, Nunoura and Horikoshi2008) and Methanococcus jannaschii demonstrated methanogenesis up to a pressure of 750 atm (Miller et al., Reference Miller, Shah, Nelson, Ludlow and Clark1988). Methanogenesis has also been found in organisms thriving in 3.5-million-year-old subseafloor basalt on Earth and was detected by using δ13C data (Lever et al., Reference Lever, Rouxel, Alt, Shimizu, Ono, Coggon, Shanks, Lapham, Elvert and Prieto-Mollar2013). Several surface features, geochemical and isotopic evidence in a Martian meteorite point to the activity of hydrothermal systems on Mars (Brakenridge et al., Reference Brakenridge, Newsom and Baker1985; Romanek et al., Reference Romanek, Grady, Wright, Mittlefehldt, Socki, Pillinger and Gibson1994; Shock, Reference Shock1997; Watson et al., Reference Watson, Hutcheon, Epstein and Stolper1994). Therefore, similar subsurface biota might exist in the Mars’ subsurface.
There are a few studies done on the effect of temperature and pressure on various strains of methanogens. However, the effects of a wide range of temperature and high pressure on methanogens in the context of Mars’ subsurface have not been studied before. The goal of this study is to examine the growth and survivability of a Mars’ model organism, Methanothermobacter wolfeii in a wide range of temperatures (45–65°C) and pressures (1–1200 atm). M. wolfeii, a hydrogenotrophic methanogenic archaeon used in this study, utilizes CO2 for its carbon source, H2 for its energy source and produces methane as a metabolic byproduct. We have also measured the stable carbon isotope fractionation of methane, δ13C(CH4), in order to understand the effect of optimal and non-optimal temperature and pressure on the carbon isotopic data. The images of cells were also acquired and were analysed to investigate morphological changes following exposure to various pressures and temperatures.
Materials and methods
Preparation of a stock culture of M. wolfeii
M. wolfeii (OCM36) was obtained from the Oregon Collection of Methanogens, Portland State University, Portland, OR, USA and was grown in MM medium consisting of potassium phosphate, ammonium chloride, calcium chloride, resazurin as an oxygen indicator and many trace minerals (Xun et al., Reference Xun, Boone and Mah1988) in a bicarbonate buffer. MM medium was prepared in an anaerobic chamber (Coy Laboratory Products Inc., Grass Lake Charter Township, MI, USA), which was filled with 90% carbon dioxide and 10% hydrogen. The growth medium was then transferred into anaerobic culture tubes inside the anaerobic chamber as described previously (Boone et al., Reference Boone, Johnson and Liu1989). The tubes were then sealed with butyl rubber stoppers, removed from the chamber, crimped with aluminium caps and autoclaved for sterilization.
A sterile sodium sulphide solution (2.5% wt/vol; 0.15 ml per 10 ml media) was then added to each tube about an hour prior to inoculation of the methanogen (Boone et al. Reference Boone, Johnson and Liu1989) in order to eliminate any residual molecular oxygen from the tubes containing the media. After inoculating the methanogen, the tubes were pressurized with 2 atm of H2 gas and incubated at the organism's optimal growth temperature, 55°C. The stock culture of M. wolfeii was maintained by transferring into fresh MM medium every 15 days.
The growth and survivability of this methanogen were determined by measuring the methane concentration in an aliquot of the headspace gas using a gas chromatograph (Shimadzu 2014, Lenexa, KS, USA), which was equipped with a flame ionization detector.
Temperature–pressure experiments
The schematic diagram of the temperature–pressure chamber is shown in Fig. 1. A quartz cuvette (Spectracell, Oreland, PA, USA) was filled with 1 ml of fresh liquid culture of M. wolfeii and was capped with a Teflon cap (E. I. DuPont de Nemours, Paris, France) inside the anaerobic chamber. The cuvette filled with sample was then put into a high hydrostatic pressure–temperature chamber (ISS, Champaign, IL, USA), which was filled with water and was connected to a piston. The pressure inside the chamber was developed with the help of a piston by pressurizing liquid water, and the pressure was measured with a pressure gauge attached to the piston (Kumar and Libchaber, Reference Kumar and Libchaber2013). The temperature of the chamber was maintained using a circulating water bath (Neslab, USA) and was measured in real time using a thermocouple (National Instruments, USA) attached to the chamber. Before loading the sample, the temperature of the chamber was equilibrated to the desired temperature and the pressure was applied after the sample cuvette was put into the high-temperature–pressure chamber. The system equilibrated to the desired pressure and temperature in <2 min after loading the sample. In this work, we preformed experiments at three different temperatures − 45°C, 55°C and 65°C and four different pressures – 1, 400, 800 and 1200 atm; resulting in a total of 12 sets of experiments. For a given temperature and pressure, the sample was kept in the temperature–pressure chamber for 15 h. After this time, the pressure of the chamber was released and the sample-filled cuvette was removed from the chamber.

Fig. 1. Experimental setup for the temperature–pressure experiment.
The cells from the cuvette were then transferred to fresh medium. Five hundred microlitres of cells from the cuvette were mixed with 500 µl of sterilized MM medium in a vial to make a total of 1 ml of culture. From this, 300 µl cells were inoculated into three different anaerobic tubes containing 10 ml of sterilized MM medium to make triplicate samples. The tubes were then pressurized with 2 atm H2 gas and incubated at the conventional growth temperature, 55°C. The growth and survivability were determined by measuring methane concentration in the headspace gas of each sample at regular intervals with the help of a gas chromatograph (Shimadzu 2014).
Determination of stable carbon isotope fractionation
Using the procedure described by Sinha and Kral (Reference Sinha and Kral2015), the carbon isotope fractionation of methane in the headspace gas of all samples was measured periodically by a Piccaro Cavity Ringdown Spectrometer G-2201-I isotopic CO2/CH4 in the University of Arkansas Isotope laboratory. The carbon isotope fractionation, δ13C, was calculated using the following equation:
 $${\rm \delta} ^{13}{\rm C}_{{\rm sample}} = \left\{ {\displaystyle{{{ \left({13_{\rm c} \over 12_{\rm c}}\right)}_{\rm sample}} \over {{ \left({ 13_{\rm c} \over 12_{\rm c} }\right) }_{{\rm reference}}}} - 1} \right\} \times 1000.$$
The reference isotopic standard for δ13C is Pee Dee Belemonite (O'Leary, Reference O'Leary1981).
Imaging of cells
Phase-contrast images of the cells were obtained before and after exposure to various temperatures and pressures using a SPOT Imaging camera and 40× objective mounted on a Nikon Optiphot microscope.
Results
M. wolfeii was exposed to temperatures of 45°C, 55°C and 65°C and pressures of 1, 400, 800 and 1200 atm in a high hydrostatic pressure–temperature chamber for 15 h. Interestingly, M. wolfeii survived at all temperatures and pressures studied here. This methanogenic archaeon demonstrated methanogenesis by producing methane after the cells were returned to their conventional growth conditions. All measurements of methane concentration were taken post exposure to different temperatures and pressures.
In Fig. 2, we show methane concentration, [CH4], as a function of time for the cells exposed to the temperatures − 45°C, 55°C and 65°C. Data in these figures represent the average methane concentration produced by methanogens exposed to the pressures – 1, 400, 800 and 1200 atm. For all temperatures and pressures, samples were in triplicates. For each temperature, M. wolfeii demonstrated highest methane concentration following the exposure to 800 atm of pressure and the lowest methane concentration following 1 atm. Highest methane concentration varied for different temperatures and reaches the maximum on different days. For example, at 800 atm and 45°C and 55°C, methane concentration reached its maximum on the third day, while for 65°C, the methane concentration reached its maximum on the fourth day.

Fig. 2. Methane concentration as a function of time following methanogenesis for Methanothermobacter wolfeii exposed to the temperatures − 45°C, 55°C and 65°C. The different coloured lines in these figures represent the average methane concentration produced by methanogens exposed to the pressures – 1, 400, 800 and 1200 atm.
Moreover, we found that at 55°C, the optimal growth temperature of M. wolfeii, the lag phase was little more than 24 h, whereas at 45°C and 65°C (non-optimal growth temperatures), the durations of lag phase were <24 h. This suggests that after the release of high-pressure stress, M. wolfeii adapted quickly to the optimal pressure condition at the non-optimal growth temperatures as compared with the optimal growth temperature. One plausible reason for different duration of lag phase observed could be due to the kinetic of reversibility of cells after they are brought back to favourable pressure after being exposed to high pressure. A recent study on Escherichia coli (Nepal and Kumar, Reference Nepal and Kumar2018) suggests that the rate at which these cells revert back to normal pressure phenotype after being exposed to high pressure depends on the magnitude and the duration of applied pressure. It is likely that the rate of reversibility to normal pressure phenotype is non-monotonic with pressure.
In Fig. 3, we show methane concentration, [CH4], as a function of time for the cells exposed to the pressures – 1, 400, 800 and 1200 atm. Data in these figures represent methane produced by methanogens exposed to the temperatures − 45°C, 55°C and 65°C. For all temperatures and pressures, samples were in triplicates. For each pressure, M. wolfeii exhibited the highest methane concentration after exposure to 65°C. For the lowest pressure, 1 atm, the methane concentration reached its maximum on the third day following a temperature of 65°C. However, for the highest pressure, 1200 atm, the methane concentration reached its maximum on the fourth day for all of the temperatures tested. The decay observed after 4–5 days arises due to saturation of growth of the cells due to limited amount of nutrients. Since the measurement of methane in the sample requires us to take out a constant small volume of the headspace gas, it results in decay of methane concentration after saturation since no further methane is being produced by the cells. If the growth is faster after being exposed to a given pressure, the saturation will reach faster and hence the decay will be observed earlier, which can be seen in Figs. 2 and 3.

Fig. 3. Methane concentration as a function of time following methanogenesis for Methanothermobacter wolfeii exposed to the pressures – 1, 400, 800 and 1200 atm. The different coloured lines in these figures represent the average methane concentration produced by methanogens exposed to the temperatures − 45°C, 55°C and 65°C.
We next studied the effect of temperature and pressure on the stable carbon isotope fractionation of methane produced by M. wolfeii. In Table 1, we have listed the carbon isotope fractionation data obtained on the second and sixth day following the pressure–temperature exposures. For 1 atm and 55°C (conventional growth conditions of M. wolfeii), δ13C(CH4) on the second and sixth day are −74.36‰ and −73.35‰, which are comparable with the published data for standard growth conditions (Sinha and Kral, Reference Sinha and Kral2015). Here we found slightly depleted values of δ13C(CH4) in the conventional conditions compared with the δ13C(CH4) data obtained at non-optimal temperatures and elevated pressures.
Table 1. Carbon isotope fractionation of methane, δ13C(CH4), produced by Methanothermobacter wolfeii obtained on day 2 and day 6 following different temperature–pressure exposures
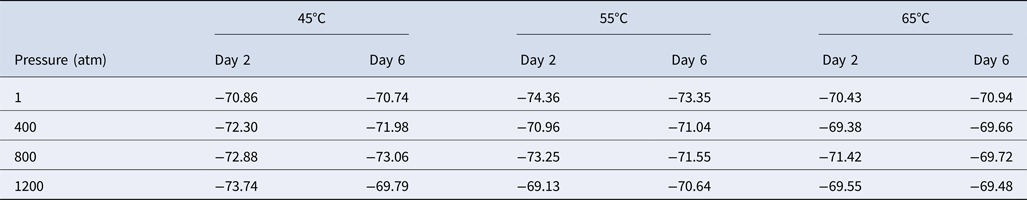
Values shown are in per mil.
In order to compare any morphological changes in the cells exposed to optimal and non-optimal pressures and temperature, we obtained phase-contrast images of the cells before and after exposure to different temperatures and pressures. In Fig. 4, we compare the images of cells exposed to temperatures − 55°C and 65°C and pressures – 1and 800 atm. We did not find any significant effect of temperature and pressure on the morphology of M. wolfeii. It has been shown that high pressure exhibits cell division inhibiting the effects on mesophilic bacteria such as E. coli (Kumar and Libchaber, Reference Kumar and Libchaber2013). The lack of morphological alteration such as elongation in the case of M. wolfeii suggests that the exposure time of 15 h was not long enough for the cells to undergo multiple cycles of cell division.

Fig. 4. Images of Methanothermobacter wolfeii after exposure to (a) T = 55°C and P = 1 atm and (b) T = 65°C and P = 1200 atm under a magnification of 400×.
Discussion
The growth and survivability of several methanogenic archaea in simulated Martian surface conditions such as at low temperature, low pressure and desiccation have been studied previously (Kral et al., Reference Kral, Brink, Miller and McKay1998; Kendrick and Kral, Reference Kendrick and Kral2006; Reid et al., Reference Reid, Sparks, Lubow, McGrath, Livio, Valenti, Sowers, Shukla, MacAuley and Miller2006; Kral et al., Reference Kral, Altheide, Lueders and Schuerger2011). On the other hand, deep subsurface of Mars could potentially offer a feasible environment for a biosphere. The challenges are then high pressure, temperature and availability of liquid water, nutrients and the source of energy. It is imperative to locate liquid water in the subsurface of Mars. All terrestrial life needs water at some stage in their life cycle. Martian geophysical models suggest that the liquid water in the subsurface of Mars could be present to a depth of ~310 km (Jones et al., Reference Jones, Lineweaver and Clarke2011). According to this model, the depth and pressure for approximate temperature range 45–65°C would be between 1–30 km and 100–3000 atm.
In this work, we have investigated the effects of temperature (45°C, 55°C and 65°C) and pressure (1, 400, 800 and 1200 atm) on the growth, carbon isotopic data and morphology of M. wolfeii. The growth and survivability of methanogens were determined by measuring methane concentration in the headspace gas samples after they were returned to their conventional growth conditions. Due to the limitation on the maximum temperature and prolonged experiments in hydrostatic temperature–pressure chamber, 15 h long experiments were performed with a maximum temperature of 65°C and pressure of 1200 atm. Since the typical doubling time for M. Wolfeii is about 10 h at conventional growth conditions, our experiments should be able to detect the survivability over the timescale of our experiments. We found that M. wolfeii was able to endure a temperature of 65°C and a pressure of 1200 atm for at least that amount of time. Surprisingly, M. wolfeii demonstrated methanogenesis following exposure to all the temperatures and pressures studied here. M. wolfeii exhibited the highest methane concentration following exposure to a pressure of 800 tm and a temperature of 65°C. The exact reason for this is not clear and will be the focus of future studies.
The stable carbon isotope fractionation of methane was measured in different temperature and pressure experiments. We found very slight or negligible difference in the carbon isotopic data following optimal and non-optimal growth conditions of M. wolfeii. The δ13C(CH4) data in the optimal conditions were slightly lower than the δ13C(CH4) data in non-optimal conditions. It is possible that for M. wolfeii, 15 h exposure to various temperatures and pressures may not be long enough to have a significant effect on the carbon isotopic data. Takai et al. (Reference Takai, Nakamura, Toki, Tsunogai, Miyazaki, Miyazaki, Hirayama, Nakagawa, Nunoura and Horikoshi2008) have found that Methanopyrus kandleri produced isotopically heavier methane under high hydrostatic pressure conditions compared with the methane produced by M. kandleri in a conventional growth condition (Takai et al., Reference Takai, Nakamura, Toki, Tsunogai, Miyazaki, Miyazaki, Hirayama, Nakagawa, Nunoura and Horikoshi2008).
We compared the morphology of cells before and after the exposure to different temperatures and pressures. Most of the cells remained intact and we did not find obvious alteration in the morphology of M. wolfeii, unlike E. coli, which shows increase in cell length with increase in pressure (Kumar and Libchaber, Reference Kumar and Libchaber2013). In Figs. 5(a) and (b), we show the probability distribution, ρ(l), of cell length, l, at P = 1 atm and P = 1200 atm. We find the mean length <l> of the cells to be 4.15 ± 0.32 μm at P = 1 atm and 3.98 ± 0.30 μm at P = 1200 atm. The error bars on the mean length of the cells is estimated as the sum of errors arising from segmentation of the images and standard error due to finite sampling. The number of cells used to obtain the distribution were 597 and 670 for P = 1 atm and 1200 atm, respectively. The variance  ${\rm \sigma} _l^2 $ and the coefficient of variation, defined as (σ/〈l〉), for the distributions are 2.30 and 0.36 at P = 1 atm and 1.76 and 0.33 at P = 1200 atm, respectively. Our results suggest that both the distribution and the mean cell length does not change appreciably with pressure. Since the doubling time of E. coli is very small as compared with M. wolfeii, it was possible to detect stochasticity in cell division and elongation of E. coli at high pressure over a large number of generation times.

Fig. 5. Probability distributions, ρ(l), of cell length, l, for pressure (a) P=1 atm and (b) P=1200 atm.
The results presented here suggest that one Mars’ model microorganism, M. wolfeii, can survive under presumed Martian subsurface conditions in terms of temperature and pressure. Therefore, the search for life on Mars should also be focused on the deep subsurface of Mars.
Conclusions
Methanogens have been considered ideal life forms on Mars for a long time. Here, we have examined the growth and the survivability of a methanogen, M. wolfeii, in presumed deep-subsurface environments in terms of temperature and pressure. We used three different temperatures (45, 55 and 65°C) and four different pressures (1, 400, 800 and 1200 atm). M. wolfeii demonstrated survivability by producing methane following exposure to all different temperatures and pressures. The growth and survivability of M. wolfeii were investigated after returning them to their conventional growth conditions. We have also measured the carbon isotopic fractionation of methane produced by M. wolfeii and found that δ13C(CH4) in optimal growth conditions was slightly lower than the values obtained in non-optimal growth conditions. A comparison of the images of cells before and after the exposure to different temperatures and pressures did not reveal any apparent alteration in the morphology of M. wolfeii.
Acknowledgements
The authors would like to thank Erik Pollock, manager of the University of Arkansas Stable Isotope Laboratory, for his assistance in obtaining isotope data.
Conflict of interest
None.


