


I
The development of finance in the nineteenth century was led by Britain, and various aspects of the British economy of that period have been studied intensively. What is missing from the modern literature is any discussion of the many striking pricing anomalies in Victorian financial markets. These add to the literature on market inefficiencies and also provide new insights into the origins of modern finance.
This article documents one very unusual mispricing, which lasted in a strong form for about two years, 1848–9, and involved two of the three government securities that accounted for most of the tradeable securities in Britain at that time. The largest and best-known government bond of that time was the famed Consols, designated as CA in this article. It constituted about half of the national debt. Most of the remaining half consisted of the Reduced 3 percent Annuities, designated as RA here, and of what will be called NR, and was known at the time as the 3.25 percent Annuity. All are described in more detail in Section ii. Their sizes are shown in Table 1, together with the size of the UK economy and its national debt. At the time from which the data of this table were drawn, those three gilts, CA, NR and RA, made up about 70 percent of the value of all securities traded on the London Stock Exchange. That institution was set up at the beginning of the nineteenth century just to trade gilts, and in the mid nineteenth century was slowly accommodating the growth in other types of tradeable securities, in particular of private companies.
Table 1. British economy and national debt around 1850

Note: All figures in millions of pounds sterling. CA, NR and RA designate certain British government securities, and entries in those rows are nominal values of outstanding debt in the corresponding security.
Source: Parliamentary Papers 1850 (169) xxxiii.1 and Mitchell (Reference Mitchell1988).
What this article shows is that in the late 1840s, NR was noticeably underpriced relative to RA. The underpricing was often in the order of 1 percent, with a maximum of about 1.5 percent, as is visible in Figure 1, with details explained later. Anomalies of this size are not uncommon in modern bond markets, in particular in the on-the-run vs off-the-run phenomenon. However, those modern mispricings are usually explained as results of a variety of causes, differences in liquidity most prominent among them. That factor does not apply to the NR vs RA case, as NR was the more liquid security. Other explanations, such as that of naive investors exposed for the first time in their life to complicated or volatile securities, also do not apply, as NR and RA (along with CA) were giant securities that were widely held, and had low turnover.
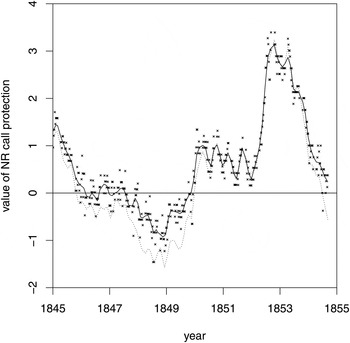
Figure 1. Market value of NR non-callability, 1845–54, in pounds sterling for units of nominal value £100
While there was an established method for shorting CA, that was not possible for either NR or RA. Hence active arbitrage, in which the overpriced security is shorted, and the underpriced one is bought, was not an option. However, passive arbitrage, in which owners of the overpriced security trade into the underpriced one, was relatively inexpensive, and according to press reports was practised to some extent.Footnote 1 But apparently this, as well as new investors buying underpriced securities, and those liquidating their holdings preferentially selling the overpriced ones, was not carried out on a scale sufficient to bring NR and RA prices into the proper relationship.
There is a large literature on modern financial asset pricing anomalies, which is discussed briefly in Section iv. Almost all the phenomena that have been documented can be shown not to apply to the NR vs RA mispricing. The only ones that appear to cover this case are those of ‘fads’, ‘opinions’ and ‘noise traders’. They are basically modern terminology for irrational investor crowd behavior, and in principle can explain just about anything. The NR vs RA case appears to be in a new category of more specific behavioral finance anomalies, one rooted in Victorian culture. This is a plausible explanation based on the available evidence, and is discussed in Section vi. But it is not a firm conclusion, given the paucity of data on investors’ thinking. What may have led to NR underpricing was the fact that during the period shown in Figure 1, it paid 0.25 percent more per year on par value than RA, but those payments were due to stop at the end of of 1854. This conflicted with the early Victorians’ strong preference for stability and simplicity. Another quantitative example of this quirk of investor psychology was most likely the substantial underpricing of terminable annuities (fixed payments for a fixed number of years) during that period.
Evidence about terminable annuity underpricing is presented and discussed in Section vi. By one standard valuation methodology, the largest and most prominent of those securities was undervalued by an average of 6 percent during its existence from 1761 to 1860, with frequent periods of discount exceeding 10 percent, and some long stretches where this discount was over 15 percent. This is a far greater mispricing than observed for NR vs RA, and extends over far longer periods of time. However, it is not the primary subject of this article. It involved a far smaller security than NR, and one that was poorly understood by the general investing public. This security was a singular one among what was basically just a handful of available securities. There was no practical way to hedge, carry out arbitrage, etc. Most important of all, there was no unambiguous way to determine the ‘proper’ value of that security in relation to the main ones. In the case of NR vs RA, this article argues that it was clearly economically irrational for the multitude of RA investors not to switch to NR, which was in most respects almost identical, and the differences could be quantified with great confidence. That was not the case with terminable annuities, as exchanging into them out of RA would have landed investors with a different type of security. So the underpricing issue there is of a different nature from that of NR vs RA.
This article is based on a new collection of prices of British gilts in the nineteenth century. Essentially, all previous studies of Victorian markets used information just about CA, and neglected all the other gilts. The new data set is publicly available on the author's home page, www.dtc.umn.edu/~odlyzko/19finance/
Some evidence is also drawn from new studies of gilts markets, obtained from studies of the ledgers in the Bank of England Archive that contain complete data about gilts ownership over time (Odlyzko Reference Odlyzko2016c).
Although this article concentrates on market efficiency, its findings have some other implications as well. Estimates of long-term interest rates in Britain in the nineteenth century have been based almost exclusively on the market yield of CA. Adjustments to the figures derived from that source have been made only for the 1880s – the most recent and most trustworthy being those of Klovland (Reference Klovland1994) – to compensate for the expectations of CA redemption in that period. Yet Figure 1 shows that similar adjustments should also be made for the mid 1840s and mid 1850s, as there was clearly a perception then that further declines in interest rates leading to redemption of CA and RA could soon take place. Hence the prices of CA and RA were lower than they would have been, and yields higher, than if they had been truly perpetual.Footnote 2
The main contribution of this article is to exhibit an interesting historical example of a financial asset mispricing that does not fit any of the currently popular models. It also serves to reinforce the criticism of the reigning ‘assumption … that the same motives are at work, that the same causes are operative, and that the same laws hold good’ across cultures, to quote Cunningham's famous attack (Cunningham Reference Cunningham1892). The NR vs RA mispricing shows that behavior that by our standards is clearly economically irrational was apparently regarded as normal by most early Victorian investors.
Section ii describes the major gilts that are the main subject of this study. Then Section iii presents a detailed study of the underpricing of NR relative to both RA and CA in the late 1840s. This is followed by a survey of the literature on financial asset mispricings and its applicability to the NR vs RA anomaly. The following section presents evidence that factors such as liquidity and redemption features could not have been responsible for the observed phenomenon. Section vi discusses the likely cultural features that may have led to this underpricing. This section also presents some data and discussion about the pricing of terminable annuities, which exhibit behavior that appears to be similar to what is observed with NR vs RA underpricing. Finally, Section vii presents the conclusions of this work, and outlines a programme of desirable further investigations.
II
This section reviews basic facts about gilts (British government bonds) in the nineteenth century. Modern authors who have looked at long-term interest rates in Britain have studied Consols (CA) to the almost complete exclusion of other gilts (see Brown et al. Reference Brown, Burdekin and Weidenmier2006; Capie and Webber Reference Capie and Webber1985; Gayer et al. Reference Gayer, Rostow and Schwartz1953; Heim and Mirowski Reference Heim and Mirowski1987; Homer and Sylla Reference Homer and Sylla1996; Klovland Reference Klovland1994; Mitchell Reference Mitchell1988; Siegel Reference Siegel1992). All published studies have found that the nineteenth-century gilts markets passed those standard efficiency tests that were applied (Brown and Easton Reference Brown and Easton1989; Brown et al. Reference Brown, Burdekin and Weidenmier2006; Mitchell et al. Reference Mitchell, Brown and Easton2002). However, these studies relied on data only for CA.
The main subjects of this study are the other two of the three major gilts that formed the bulk of the British national debt in the 1845–54 period:
-
– CA = Consols, the Consolidated 3 percent Annuities of 1751, paying 3 percent annually, in early January and early July
-
– RA = Reduced 3 percent Annuities, also dating to the 1750s, paying 3 percent annually, in early April and early October
-
– NR = gilts created in the 1844 debt conversion, paying 3.25 percent from late 1844 to late 1854, and then 3 percent, with a guarantee of no redemption until late 1874, with interest payable on the same days as RA
After 1854 these three securities all paid 3 percent per year (actually about 3.02 percent, since they paid 1.5 percent twice a year, but we'll follow the convention of the time and disregard this pedantic point) and were collectively often referred to as ‘the Three percents’. They were called ‘perpetual’, although this is a misnomer, in that investors could not cash them in, but the government could call them by paying face value. Such redemptions of various British annuities happened a number of times in the nineteenth century, although in practice they involved mostly rollovers into new gilts carrying lower interest rates and not cash payments.
Gilts in this period were strictly book-entry securities, with no certificates, etc. Prices were universally quoted in units of nominal (par) value of £100.00, even though transactions could and were carried out in units as small as 1/240-th of £1.00. Transaction prices and quotes for the major gilts were almost always reported in increments of £0.125 (for a unit of par value £100). This was also the standard brokerage commission, and also the jobber (dealer, market maker, specialist) standard margin (the difference between buy and sell quotes, then called the ‘turn’). Large customers could normally get better deals, while in times of stress, the jobber margin would increase, although very seldom above £0.25, or twice the standard. Thus differences in price of £0.125 during that period were in general not significant, and could often be due just to the drift of prices and the timing of transactions that were reported.
When retail investors sold a security and immediately purchased another one, they usually paid only one commission (Tuck Reference Tuck1845, p. 14). Hence such investors could engage in profitable arbitrage when mispricing exceeded £0.25, but not below. Large investors and insiders could profit from smaller differences.
While almost all share transactions were subject to a stamp tax, gilts trading was exempt. Also, income tax (which was brought back in the early 1840s) was at low levels and did not apply to capital gains. Hence taxes are disregarded here in considering potential arbitrage.
NR and RA traded for immediate cash settlement. Hence selling any of them short required private arrangements and so is not considered a viable strategy here. Until 1861, each gilt had trading in it suspended for about a month before the interest payment date. Therefore we have data for NR and RA for about 10 months of each year.
This study is based mainly on prices obtained from the standard source for such data, namely the Course of the Exchange, abbreviated as CoE, primarily in the form of closing prices on Fridays.
In the future, we can expect much more detailed information to become available as the ledgers preserved at the Bank of England Archive are explored more intensively. Some preliminary results are available in (Odlyzko Reference Odlyzko2016c). In particular, we may obtain some estimates of the extent to which passive arbitrage of swapping RA for NR was actually carried out. That such passive arbitrage was not unknown is shown not only by the anecdotal evidence of news reports, like that referenced in Section i, but also by data about the South Sea Company, called here SSC, which was central to the South Sea Bubble of 1720. At the beginning of 1845, the SSC received from the British government £483,382 of RA and £127,083 of CA in settlement of the agreement of 1815 by which this company relinquished its trading monopoly with Latin America. Over the next few years the SSC swapped much of this fund for its own equity and the 3 percent Annuities it administered for the government, which were often deeply underpriced relative to CA and RA. Particularly noteworthy was the swap of early May 1845, in which in one day, £10,831 of RA and £90,348 of CA were exchanged for SSC securities.Footnote 3 That transaction, involving almost a dozen jobbers and bankers on the other side, was proposed to the SSC directors in the morning of 8 May, so must have been prepared at the London Stock Exchange the preceding day. After approval by the directors, it was executed the following day, 9 May. Since CA and RA were being swapped for similar securities, with the same nominal yield, the risk to the jobbers or the company in spreading the deal over three days was minimal, as variations in market prices were likely to affect relevant securities in similar ways. The brokerage charge for the entire transaction was just £64, which was half of the usual fee for a single deal of that size. This example demonstrates that gilt swaps were practised at low cost, and so there was no obstruction to moving from RA to NR.
III
After 10 October 1854, NR paid the same interest rate, 3 percent per year, as CA and RA, and one finds citations in the contemporary literature to ‘the sweet simplicity of three percents’. These three ‘perpetual’ annuities encompassed almost all of the British national debt until the Goschen refinancing of 1888–9 which replaced them all with a single new security at a lower interest rate. After 1854 (and so beyond the range of Figure 1) NR traded at a slight but diminishing premium to RA, as can be seen in the data for this project, available on the author's home page. From about 1860, NR and RA traded and were quoted essentially identically, except for a few months in 1884, when NR was at a substantial premium, an episode that is discussed in Section v, and usually at a noticeable discount to CA, after adjusting for accrued interest. The premium on NR compared to RA that is visible for much of the period covered by Figure 1, or that prevailed in the late 1850s, can be easily justified on the grounds that NR was protected from redemption until 1874, unlike RA. The puzzle is the underpricing of NR in the 1846–9 period, especially in the last two years of that stretch.
The differences between NR and RA before October 1854 can be decomposed into quantifiable components. NR before 1855 can be regarded as the sum of NR1 and NR2, where NR1 was a perpetual 3 percent annuity that could not be redeemed until after the October 1874 dividend was paid, and NR2 was a terminable annuity, paying £0.125 each April and October of 1845 through 1854. It was regarded as such by contemporaries, too.Footnote 4 Except for the differences in redeemability that are discussed in Section v, and which did not appear to have much effect on pricing, NR1 was superior to RA by virtue of the call protection. Hence (using italic versions of symbols of securities to denote prices) we should have
 $$NR1 = RA + C,$$
where C is the ‘option value’ of not being callable until the end of 1874. Hence rational pricing would force
 $$C = NR - RA - NR2.$$
The values NR and RA can be taken from market data, listed in the price tables, while NR2, the value of the finite stream of payments NR2, can be computed explicitly if we are given a discount rate. This was done for each Friday from beginning of 1845 through early September 1854 (when RA and NR trading was shut, just prior to NR losing its extra interest). The prices for RA and NR were the closing prices from the CoE. NR2 was evaluated using the market yield of CA on each day, computed using the precautions of Klovland (Reference Klovland1994). The main results are not very sensitive to the discount rate, since NR2 was a rather short annuity, as is demonstrated later.
Figure 1 shows the results. The scatter plot displays the values of C that were computed for the 420 Fridays for which we have prices for both RA and NR. The solid line is a smoothed version, obtained with the lowess function in the R statistical package. The dotted line is a smoothed version (again, using lowess) but applied to a similar data set, in which the price of NR was compared not to RA, but to CA (after adjusting for accrued interest).
The valuations of C shown for early 1845 are not unreasonable, as there were wide expectations interest rates would go lower, leading to redemption of CA and RA. Even the much higher values of C in late 1852 and early 1853 are plausible. Interest rates on gilts were declining to below 3 percent, and there were wide expectations of further declines.
What is totally unrealistic are the negative values of C. In a rational world, the value of an option (in this case, protection from redemption) cannot be negative. Yet negative values is what we observe. Not only that, but in mid to late 1848 those values were very large on the negative side, especially when we compare NR to CA. (CA was substantially overpriced relative to RA during this period.) As an example, tables show that on 28 July 1848, C was valued at a negative £1.46 relative to RA, and a negative £2.21 relative to CA. Since the price of CA (after removal of accrued interest) was £85.81, NR was underpriced relative to CA by over 2.5 percent, even if we value its call protection C at zero.
That C should have been close to zero at that time is not surprising. With market yield on CA close to 3.5 percent, the prospects of redemption were far from investors’ minds. But negative values should not have happened. Especially in this case, the markets could not stay irrational forever. The terminable annuity NR2 was going to terminate in six years, and at that point NR was clearly going to be superior to RA by virtue of liquidity and call protection.
Figure 1 is based on valuing NR2 using the interest rate derived from CA, which was a long-term security. However, NR2 expired in October 1854, so one can argue that short-term rates should be used instead for discounting. That does lead to different NR2 values, but the difference is substantial only for 1847 and the first few months of 1848. The period 1845–55 covered by Figure 1 started out with great prosperity and low interest rates. Then, towards the end of 1845, interest rates began rising in response to the Railway Mania, fears of food shortages and other factors. The year 1847 saw the peak of the Irish Famine, and other, less intense, famines elsewhere, and saw a small financial panic early in the year. Then came the major crisis in October 1847 that led to the suspension of the gold standard, and involved short-term rates at or above 10 percent per year. This was followed by a recovery of the markets, but only for a few months, as in February 1848 a revolution broke out in France, and soon much of continental Europe was in flames. There were even fears of violent uprisings in Britain in early 1848. However, after the fizzling out of the Chartist meeting on Kennington Common on 10 April 1848, and the stabilization of the political situation in France, financial markets started a rapid recovery. Figure 2 shows the interest rates on CA as well as the Bank of England rate of discount and the Overend, Gurney rate on bills of exchange (Parliament 1857, pp. 463–4). From February 1848 on, all were at or below 4 percent, and were generally declining.
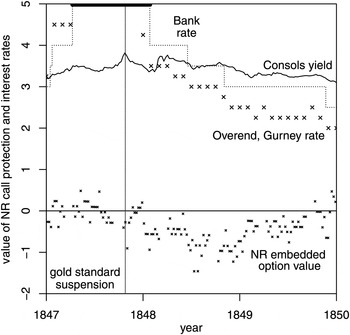
Figure 2. Market value of NR non-callability, 1847–50, in pounds sterling for units of nominal value £100, and interest rates as percentage
As an illustrative case, consider the situation in early April 1848, right after the payment of interest on NR and RA. At that stage, NR was due 13 payments of £0.125 on 10 October 1848, 5 April 1849, …, with the final one on 10 October 1854. Using an annual discount rate of 2 percent, and following the conventions of that time (which, in the absence of calculators, involved relying on tables, and assuming exactly half a year between interest payments, and a discount rate of 1 percent for each half-year, approximations that electronic tools allow us to dispense with, but which are not material in any case), we find the present value of NR2 to be £1.517. At an annual discount rate of 4 percent, this value is £1.419. (A zero discount rate gives value of £1.625, 13 times £0.125.) These variations are too small to noticeably affect the picture visible in Figure 2. Even a rate of 10 percent, similar to those that held briefly during the peak of the crisis in October 1847, yields a discounted value of £1.174. Such a value would show a considerably smaller underpricing of NR, but would preserve most of it. Hence we can conclude that all reasonable discount rates that could be used to value NR2 yield similar results from the spring of 1848 onwards, and so do demonstrate the same mispricing.
The extreme underpricing of NR is puzzling, especially when we look at actual prices. On four days in the summer of 1848, spread over two and a half weeks, the closing prices of RA and NR were identical. Thus not only was the NR call protection valued at zero, so was the £1.625 extra that was due in interest payments over the next six years! In these cases, the actual pricing was apparently a little less absurd. The equal closing prices for RA and NR were most likely an artifact of the market's ups and downs towards the close, and of the securities not trading at the very end, or at least not having some of the closing prices reported.Footnote 5 Closing quotes listed for those days varied from newspaper to newspaper, but generally suggest there was a price difference of about £0.25 in favor of NR (Odlyzko Reference Odlyzko2014). Still, that was far from the value of that extra flow of £1.625 that was due, even after discounting to get present values.
Although the money market of the second half of 1848 and of 1849 was placid, there were substantial financial upheavals that may have contributed to NR underpricing. The railway share market suffered a mini-crash in late 1848. This was followed by a recovery after the release of reassuring accounting statements from the major lines, but then in early 1849 railway shares started on the slow grinding decline that led to the market bottom in late 1849. Also, newspaper reports provide anecdotal reports of large capital inflows in mid 1848 from continental Europe, in response to the upheavals there. It is possible that those foreign investors were telling their agents to invest in the old and better-known RA rather than in the newer NR that was unknown to them. This may also have contributed to the growth in underpricing of RA relative to the even better known CA (Odlyzko Reference Odlyzko2016b). In an efficient market, such factors should not have mattered, as knowledgeable investors in RA should have taken advantage of this opportunity to switch to NR. But the markets were clearly not working properly.
Discussions of the overpricing of CA relative to RA during this period have been found in several newspapers (see Odlyzko Reference Odlyzko2014, Reference Odlyzko2016b). But much less discussion of the far more dramatic overpricing of CA and RA relative to NR has been found so far in serial publications in Britain before the end of 1849. The most persistent in noting it was the Illustrated London News, one of the two highest-circulation weeklies of the time, which did cite this anomaly several times. Far more emphatic was an Irish newspaper, Freeman's Journal, a Dublin daily. Gilts traded not only on the London Stock Exchange, but also on the Dublin one, and given the information lags in the pre-telegraph days, there were noticeable price differences and active arbitrage between those two markets (Thomas Reference Thomas1986), with the Irish gilts market at that time exhibiting smaller anomalies than the English one. The financial column of Freeman's Journal, published on Mondays, started a crusade in October 1847 to persuade readers to take advantage of the obvious opportunity of switching from overpriced CA to underpriced NR.Footnote 6 But by mid 1848, as the underpricing continued to increase, the editor of that column appears to have given up, and only came back to the subject at the end of 1849, when this underpricing was rapidly diminishing. This limited press coverage demonstrates the inefficiency of the information systems of the time. The use of publicity by arbitrageurs to attract other investors to bring prices to their fundamental values, which has been documented in modern times (Ljungqvist and Qian Reference Ljungqvist and Qian2016), is not discernible in the NR vs RA case.
The overpricing of CA relative to RA is studied in a separate article (Odlyzko Reference Odlyzko2016b). In some ways it is far more remarkable, as it lasted for most of the nineteenth century, with varying degrees of intensity. However, it requires more care, since CA was definitely more liquid than RA, and there were other differences, such as the ability to short that was possessed only by CA, and different dates when interest was due. NR underpricing relative to RA is much simpler, given that the interest was paid on the same dates, both traded only for money, and so on. The next section briefly surveys the explanations that have been offered for modern bond pricing anomalies. Most can be easily dismissed as not applicable to the NR underpricing. Then Section v considers in more detail liquidity and redemption features, and shows that they also could not have been responsible for the observed mispricing.
IV
The literature on behavioral finance is vast. A survey that is already somewhat dated is available in Barberis and Thaler (Reference Barberis, Thaler, Constantinides, Harris and Stulz2003). A variety of basic cognitive biases have been identified that serve to explain some of the documented market anomalies. For example, overconfidence has been used to explain the momentum effect (Daniel and Hirschleifer Reference Daniel and Hirshleifer2015), which has been found in several studies (e.g. Chabot et al. Reference Chabot, Ghysels and Jagannathan2009; Geczy and Samonov Reference Geczy and Samonov2016). The NR vs RA mispricing that is the main subject of this article, as well as the terminable annuity pricing puzzle discussed in Section vi, and also the CA vs RA mispricing discussed in Odlyzko (Reference Odlyzko2016b), do not fit any of the previously published patterns. But they do show some common features, as discussed in Section vi. These appear to be rooted in the early Victorian culture, and most likely reflect the evolution of modern society from its earlier roots. This evolution, which has been studied by Karl Marx, Max Weber, Werner Sombart and legions of later scholars, involved the development of what has been called a ‘calculative mentality’, associated with growing rationalization and secularization.
Before considering the likely effects of culture on financial behavior, we briefly discuss some of the known behavioral finance explanations for mispricings, and the reasons why they do not cover the NR vs RA case. Currently the favorite explanation for various market anomalies appears to be liquidity (see Alquist Reference Alquist2010; Amihud et al. Reference Amihud, Mendelson and Pedersen2005; Fleckenstein et al. Reference Fleckenstein, Longstaff and Lustig2014; Musto et al. Reference Musto, Nini and Schwarz2015, and the references therein). Some argue that liquidity is overvalued. But the same can be said of the equity premium, which is ubiquitous. So whether liquidity preferences at their current intensities are rational or not, they do appear to explain many apparent anomalies. If the NR vs RA mispricing could be ascribed to liquidity, the findings of this article would then be primarily an amusing early historical example of the influence of this factor. However, as is shown in the next section, NR had superior liquidity.
Various additional explanations, many related to liquidity, have been proposed for mispricings of modern bonds. The search-based theory, for example, suggests that, to greatly oversimplify, market agents concentrate their activities on a particular instrument for various reasons, possibly historical and possibly purely arbitrary, enhancing its value (see Lagos and Rocheteau Reference Lagos and Rocheteau2009; Vayanos and Weill Reference Vayanos and Weill2008). The evidence we have for the London markets of the 1840s does not support this theory, as the next section shows. Nor is there any evidence that RA was required or preferred for various financial transactions, which would justify a deliverability premium (Kuipers Reference Kuipers2008).
An explanation that does explain many pricing anomalies is inability to short the overpriced security. Shorting was not available as a sanctioned activity on the London Stock Exchange for either NR or RA. The argument of this article is based on passive arbitrage, of investors in RA switching in NR. For that, there was no barrier, and there were plenty of traders and plenty of liquidity. Further, as was mentioned earlier, we can document cases of passive arbitrage from that period.
The underpricing of NR is depicted in Figure 1 in terms of the negative pricing of NR call protection, this security not being redeemable until the end of 1874. There is a substantial literature on negative option prices for bonds, centred on the comparison of pricing of callable and non-callable US Treasury bonds (Carayannopoulos Reference Carayannopoulos1995, Reference Carayannopoulos1998; Jordan et al. Reference Jordan, Jordan and Jorgensen1995; Jordan and Kuipers Reference Jordan and Kuipers1997; Longstaff Reference Longstaff1992). Somewhat disputed explanations for this observation encompass tax effects and deliverability of some bonds against futures contracts. Those factors did not enter into NR and RA pricing. There were no capital gains taxes in Britain in the nineteenth century. Further, as noted above, and demonstrated in the next section, NR and RA seemed to be used with about equal frequency for the limited number of financial transactions that were common.
V
All available evidence shows that the underpriced NR had higher liquidity than the overpriced RA. Liquidity is a poorly defined concept, but generally refers to the ability to buy or sell easily, without affecting the market price (Amihud et al. Reference Amihud, Mendelson and Pedersen2005). Without a precise method to measure liquidity, especially in markets a century and a half ago, we have to rely on proxies for it, just like previous investigators. The first measure we can use is just size, and Table 1 shows NR far ahead of RA by that measure. (The largest of the four 3.5 percent Annuities that were converted into NR in 1844 was already larger than RA in its capital.) There were 120,392, 101,525 and 37,619, accounts in CA, NR and RA, respectively, at the end of 1847. Hence account sizes were similar, on average around £3,000 in each in CA and RA, and around £2,000 in NR, and so was the general distribution of account sizes.Footnote 7 Jobbers were obliged to honour their quotes for a minimum of £1,000 of nominal value in the major gilts. Press reports indicate that deals for tens of thousands of pounds could be carried out without affecting market prices. For example, the Daily News of 19 August 1848 noted that while the sale of £50,000 of CA the previous day depressed the price, this was not because the transaction was large, but because it was ‘supposed to be grounded upon some exclusive intelligence of importance possessed by the operator’. On the other hand, The Times of 23 March 1830 reported that the market had been so firm the previous day that a broker sold £200,000 of CA ‘without in the least affecting the current quotation’.
Even more relevant than account numbers and sizes is transaction activity. Data were collected on prices reported in the CoE. The 57 trading days between 6 April 1848 through 13 June 1848 were considered. The average number of prices shown per day was 3.79 for RA and 3.47 for NR. For the range of prices in a day (difference between the highest and lowest), the figure was 0.42 for RA and 0.43 for NR. Thus by this measure NR and RA were similar. (CA for cash settlement was somewhat higher on both measures, at 4.54 and 0.476, respectively.)
For the years 1855 through 1879, published reports provide statistics on monthly volumes of transfers in CA, NR and RA.Footnote 8 The annual turnover rate (fraction of capital that was transferred) was consistently lowest for RA, higher for NR and highest for CA, with averages for all 25 years of 27.1 percent, 31.9 percent and 33.7 percent, respectively. So this measure also points to higher liquidity for NR than for RA. There do not seem to be similar statistics available in printed form for earlier periods, closer to the ones that are subject of this articler, so new statistics were collected.
A complete record of transfers of gilts is available in the ledgers in the Bank of England Archive. The volume of data precludes the possibility of a complete analysis, with tens of millions of transaction entries. However, there are separate ledgers for transactions for the jobbers (the dealers who made the market in gilts, by buying and selling to brokers acting on behalf of outside customers), and some statistics were collected for jobbers in CA, NR and RA in 1848 whose last names started with the letter ‘T’. (The relevant ledgers in the Bank of England Archive are catalogued as AC27/2722, AC27/5816 and AC27/7206, respectively.) For each of those gilts, there were precisely three such jobbers, and they were the same three for each gilt. Jobber ledgers were organized so that each page has in one column that jobber's purchases, and the other column has his sales. For each jobber, a count was taken of the number of pages where the first date for a purchase was between 6 April 1848 and 31 December 1848. Hence a certain number of April purchases may have been missed as they are on an earlier page, and some purchases in early 1849 were included, and this differed from case to case. From the summary information for each page, the total amount of purchases recorded on that page was extracted. Adding up the data for those three jobbers produced 18 pages concerning NR, with total purchases of £193,332, and 8 pages for RA, with total purchases of £86,706. Given the relative sizes of NR and RA, as shown in Table 1, this says that those two gilts were being traded with about the same frequency relative to their sizes, so NR should have been more liquid than RA.
Gilts were frequently used as collateral for loans, and at least in the early 1840s, overnight borrowing rates varied rapidly with time and between securities (see Parliament 1842). However, we do not have any systematic data set that could tell us whether any particular gilt was on average more profitable to lend out than another. Still, we can estimate the frequency with which gilts were used as money market collateral. The jobber ledgers often contain information about accounts of large and frequent traders who were not jobbers. Data were collectedFootnote 9 about the transactions in CA, NR and RA during 1845 by three such figures, and are shown in Table 2. William Hammond the Younger was an unusual figure, as documented in Odlyzko (Reference Odlyzko2016c). He was a member of the London Stock Exchange, and in many ways operated as a jobber, but on a larger scale and over more instruments than regular jobbers, and engaged in a variety of other transactions. The other two were not members of the Stock Exchange, and so operated through brokers or, especially for money market deals, directly with customers going through the Bank of England for record keeping. Philip Hanbury was a partner in a private West End bank, and his account is surely that of the bank. Lionel Nathan de Rothschild was the head of the London branch of the Rothschild family. Each figure in the table gives the total volume of the respective security that was transferred into that individual's account during the year. These three individuals engaged in a variety of financial transactions, but it is very likely that almost all of what is recorded in Table 2 represents lending with the respective security as collateral.
Table 2. Major gilt transactions in 1845 by some financiers

Note: Total volume (in pounds sterling, figures not completely accurate due to rounding) of the major gilts acquired during calendar year 1845 by three large and active financial figures who were not regular jobbers. Data from the Bank of England Archive, as described in this article.
The one surprising observation that emerges from the data in Table 2 is that CA was not used far more often than NR and RA. Contemporary financial commentary could easily lead a reader to conclude that CA was the overwhelming choice for financiers, but that is not what we see in the data. As for the relative roles of NR and RA, though, we find that they were used in volumes roughly proportional to their total capital. So it seems very unlikely that any of the proposed modern bond mispricing mechanisms produced the underpricing of NR relative to RA that we find in the historical record.
The British government was the borrower, and it also set the rules. However, although it had an interest in keeping costs low, it was extremely solicitous in making sure investors felt they were being treated fairly. It also had the legal and practical constraints of managing large conversions. The magnitudes of CA, NR and RA limited what could be done. There does not seem to be any scenario that might have seemed plausible in the late 1840s under which NR holders might be treated worse than RA investors. It would have required a strong belief that there would be no redemption before 1874 (when NR's immunity from such steps expired), and that afterwards, the government would be much more generous to RA holders than NR ones.
In the end, in the Goschen conversion of 1888–9, holders of CA and RA were given £0.25 more than those of NR (and in all cases about 1 percent more than the bare minimum they were entitled to). The reason was that the statutes that set up CA and RA called for a year's notice before redemption, while NR could be called within just a couple of weeks. Therefore Goschen gave CA and RA investors an inducement to voluntarily convert at the time when NR holders were forced to either convert or take cash. (The vast majority of CA and RA investors did respond positively to this modest bonus.) Prior to the conversion announcement, during January 1887 through February 1888, the average prices of CA, NR and RA, after stripping away accrued interest, were £101.49, 101.20 and 101.21, respectively (Hamilton Reference Hamilton1889, p. 6). Long-term risk-free interest rates had been below 3 percent for some time (see Klovland Reference Klovland1994), so those prices reflected expectation of a conversion in the near future, and press commentary reflected such expectation as well. Those prices show that the precise nature of Goschen's move was not anticipated by the markets, but it is clear that the expectation was that all three major gilts would be treated similarly. Also, while NR did carry a slight premium to RA in the late 1850s, beyond the range of Figure 1, after a few years, from 1860 on, NR and RA were priced and quoted almost identically. The one substantial exception to this was a few months in 1884, when NR carried a substantial premium, briefly exceeding £1.00, relative to both CA and RA. This was caused by some comments by Hugh Childers, the Chancellor of the Exchequer, that his interpretation of the law limited redemptions of NR to ones that took in the entire sum at once. This overpricing of NR dissipated in a few months, after it became clear this was not the official position, and that NR could be redeemed gradually, just like CA and RA (for details, see Odlyzko Reference Odlyzko2014). The conclusion is that redemption features were not likely to have played a role in producing the observed NR underpricing in 1848–9.
VI
At one level, the financial environment faced by the early Victorians was similar to ours. The legal system was essentially the same, property rights were carefully observed, financial institutions were able to provide most of the services we are familiar with at modest cost, even if in a more rudimentary form than we are used to. At another level, there were substantial differences, but ones that often offset each other. The investing population was far less sophisticated, and the technology was far more primitive, with all calculations having to be done by hand. There was much reliance on printed tables, such as those in Corbaux (Reference Corbaux1825), for even simple financial computations. On the other hand, this lack of sophistication was offset by the far simpler choices of financial instruments. As was mentioned before, in the mid nineteenth century, about 70 percent of all tradeable securities were made up of just the three gilts CA, NR and RA. For trusts, which according to all reports controlled a very large proportion of investments, the universe of eligible tradeable securities was limited basically to just gilts, so CA, NR and RA were almost the only choices. As the crisis of 2008 showed, even very modern and highly sophisticated MBAs and finance PhDs were confused by the complexity of CDO-squareds and similar securities. So it is doubtful that modern investors understand available securities better than the Victorians understood the ones available to them.
At yet another level, there were differences that are hard to quantify, involving general attitudes to finance. The early Victorians were only slowly shedding traditional modes of thought. Long-term relations were prized, and so most people continued with the same grocers and bankers for decades. Market transactions were becoming more prevalent, but the evolution was slow. As an example, the Bank of England did use an open bidding process to procure coal. But the governor of that company, who was elected by shareholders, was almost invariably the previous deputy governor, and the person elected to that position was the most senior director who had not yet served.
Finance was held in very low regard, and prestige and social and political status were tied primarily to land ownership. There were still substantial and influential groups that looked down not just on the London Stock Exchange and its jobbers, but even on the Bank of England and the institution of national debt. They were regarded as Dutch and Jewish imports, corrupting the ‘good old England’ of feudal times (Aytoun Reference Aytoun1849). While the City (the financial center of metropolitan London) was full of sophisticated finance professionals alert to even small opportunities for making money, society in general frowned on short-term financial dealings, which seemed unseemly, below the dignity of properly bred gentlemen. We can find many instances of financial activity and lack of activity that seem to reflect such attitudes. For example, the Commissioners for the Reduction of the National Debt (CRND), a government body set up by Pitt in 1786 to administer his sinking fund, in one of their first meetings issued instructions to their broker to buy the cheapest of the 3 percent Annuities (National Debt Office 1961). Thus they were aware of mispricings among those annuities, but apparently there was no discussion of this issue in the minutes of that meeting or other ones over the next 60 years. On the other hand, CRND meeting minutes do record many discussions and decisions about conditions under which the CRND broker should purchase the 3 percent Annuities vs the 3.5 percent ones, and there were studies on this topic prepared by their actuary. It seems that exploitation of the anomalous mispricings among the 3 percent Annuities was not regarded as serious enough to deserve the attention of the august membership of the CRND.
The NR vs RA mispricing documented in this article was most likely influenced by such attitudes. This would be consistent with other failures to take advantage of what seem obvious opportunities for financial gain. For example, the life insurance industry in the 1840s was still small and dominated by the Equitable Society, whose approximately £10 million of assets may have been as much as a third of the life insurance industry total. The Equitable's 1849 financial statement is available in print (Equitable Society 1854), and shows that the only gilts they held were CA (at £2.3 million nominal value) and RA (at £2.7 million). Comparison with the 1839 statement shows some liquidation of gilts holdings (including what had been a modest £0.4 million stake in a 3.5 percent gilt that was to be converted into NR in 1844). It appears this company was not taking advantage of the opportunities of converting CA into RA and NR, and of RA into NR. Nor was it investing at all in the underpriced terminable annuities, discussed below. Those would have been very appropriate for part of the Equitable portfolio, as payouts in life insurance were quite predictable. All of these maneuvers were probably regarded as the kind of ‘jobbery’ that was not quite respectable, and so were avoided.
An associated factor was most likely the dominant desire for permanent investments. That is probably why the ‘perpetual’ annuities such as CA and RA became the main form of national debt in Britain in the eighteenth century, after an early period when life and terminable annuities were dominant. It was also why stable dividends were what Victorian investors looked for in securities (Rutterford Reference Rutterford2004). Until the middle of the nineteenth century, there was little expectation of steady economic growth. Progress was known, but was thought of as coming in quantum jumps, through dramatic new technologies, or opening of new trading routes. At the same time there was a preoccupation of the wealthy with the preservation of family fortunes. While they did not use modern language, they instinctively knew that r >g, where r is the rate of return on capital, and g is the growth rate. The reason is that they could obtain r of about 3 percent per year by investment in gilts or land. On the other hand, they thought of g as being zero or close to zero (Odlyzko Reference Odlyzko2016a). But they were also sure that r >g was not enough to preserve family positions, and so went to great lengths to protect against improvident heirs and other vicissitudes of life, through measures such as primogeniture and entail. This concern about stability and permanence was reflected in legal statutes and practices involving trusts. Trusts were ubiquitous, and were used for a variety of purposes. Many were permanent, and a large body of law emerged to govern what trustees should do in terms of responding to current beneficiaries’ desire for maximal payouts, and the need to protect the principal for future beneficiaries. One of the key decisions came in 1828 in the case of Dimes v. Scott, as described in Stebbings (Reference Stebbings2002, pp. 74ff), but without some of the background financial details. In this case, money in a trust was invested in East India Company ‘stock’. This was originally equity, but by the time of the decision it was effectively a bond of that company, paying 10.5 percent on the par value, and subject to redemption in 1874 at twice the par value. The trustees in the Dimes v. Scott case were held personally liable for giving the full dividend to the current beneficiary. The problem was that this ‘stock’ was trading at about 2.4 times par, but was almost certain to be redeeemed at 2 times par half a century later, so some of the payout was compensation for the declining value of the principal. (The pricing of this ‘stock’ is an interesting subject in itself, in its relation to the main gilts, but the particulars are complicated, so it is not covered here.) Thus those trustees were providing high payouts to the current beneficiary at the expense of ones half a century in the future. Any trustee aware of this judicial decision penalizing the trustees in Dimes v. Scott would surely have been reluctant to invest in NR as opposed to RA, since that extra 0.25 percent per year would have to be allocated between the current beneficiary and growth of capital so as to provide equitable treatment. Given the relatively small gain from purchasing NR, typically under 1 percent even in the 1848–9 period, many trustees as well as private investors probably decided it was not worth bothering with it.
An excellent example of the preference for simplicity and permanence is provided by a leader in The Times in 1822, when attempts to sell a terminable annuity, the so-called Dead Weight Annuity, only a part of which was eventually sold to the Bank of England, were foundering:Footnote 10
The objections to the proposed scheme, as it affects the lender, are, that he can neither turn his money to immediate advantage, nor can he make a provision out of it for posterity, repayment being finished and abruptly stopping at the end of 45 years. It is true, that at the close of that term, his representatives will have received all that their father originally lent, with, no doubt, a considerable gain: but they will have received it, as the old sonnet states, ‘driblet by driblet’– year after year; so that, except they are very provident persons, living within their income, they will find themselves suddenly aground … no one being able to ascertain in advance, whether the disposition of his successors may be of that prudent kind, which, foreseeing the future years of scarcity, hoards out of the current years of plenty.
As it turns out, this quote also illustrates another factor that apparently was important on the contemporary investment scene, and was cited earlier in this article. That was the limited quantity and poor quality of financial information. At the time The Times published the passage above, the most prominent of all the terminable annuities in existence were the Long Annuities (LA) that originated in 1761 and expired in 1860. For most of their life, LA were significantly underpriced relative to the main valuation measure for them. This was their Consols discounted cash flow (CDCF) value, where the payments were all discounted at the current market yield on CA. The underpricing averaged 6 percent over the 99-year history of LA. However, at the time of The Times leader, LA was just at about its CDCF value, and for much of the 1820s it was significantly above it, with the overpricing reaching 8 percent for short periods. It appears, though, that The Times writer was influenced by the historical record and oblivious of the contemporary market situation.
Figure 3 shows market pricing of LA in the decade from the start of 1845 to the end of 1854. The pattern of underpricing differs from that of NR, shown in Figure 1, so whatever factors drove the two phenomena, they were not exactly the same.
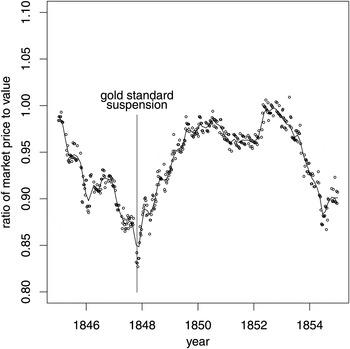
Figure 3. Market prices of Long Annuities that terminated in 1860 compared to their discounted present value, 1845–54
In valuing terminable annuities, the fundamental problem is the choice of the discount factor. In the modern world, the textbook answer is that each payment should be discounted by the appropriate factor for that period. But that assumes the existence of a well-defined yield curve. Such an assumption is unrealistic for most of the nineteenth century. Between 1855 and 1888, there were basically just three large risk-free British government securities on the market, CA, NR and RA, and each was ‘perpetual’, and each yielded 3 percent on its par value. Between roughly 1785 and 1820, the gilts market was dominated by ‘perpetual’ bonds with yields of 3 percent (for CA and RA), 4 percent and 5 percent. Their relative prices do provide some indication of investor expectations of the future course of interest rates, but are utterly inadequate to determine anything like a yield curve. So how could terminable annuities such as LA be valued?
The obvious answer was to use the market yield on the most visible long-term security, namely CA (possibly in combination with RA). This was standard, gives the CDCF cited above and was used by the British government to price the terminable annuities it started selling in 1829 (10 Geo. IV, c. 24). Sometimes the government used a fixed rate, an estimate of the average yield on CA.Footnote 11 But the investing public had other preferences. The investing rationale that was articulated by contemporary observers involved taking for current consumption as much from the terminable annuity as would have been obtained from CA bought for the same amount, and investing the rest so as to reconstitute the capital when the annuity expired (Thatcher Reference Thatcher1825). CDCF pricing of the terminable annuity would produce this result if interest rates remained constant. However, it was accepted that to satisfy investor preference for permanence, and provide a high level of assurance that the original capital would be rebuilt, the assumed reinvestment rate might have to be lower, and so a price below CDCF might be required to persuade investors to buy. But the reinvestment rates that would have justified the observed market prices of LA appeared absurdly low to some of the most sophisticated observers. An attempt in the early 1820s to elucidate market prices of terminable annuities attracted support of almost 200 of the most prominent financial figures in London, including the Chancellor of the Exchequer, the Bank of England, the London Stock Exchange, Nathan Mayer Rothschild, the Hoare and Coutts banks, and Francis Baily, a prominent astronomer who had been a stockbroker and was a preeminent authority on annuities (Thatcher Reference Thatcher1825). Apparently they were all puzzled by investor behavior, which was driven by some cultural factors that remain to be explained.
VII
The results of this article demonstrate the existence of interesting pricing anomalies in the early Victorian markets that are not explainable through any of the published mechanisms. Evidence suggests that they might be due to cultural factors, which would show that even under essentially identical legal, institutional and economic settings, investors can behave in different ways that can be quantified. This has several implications. One is that the evolution of the modern world involved changing some of the basic attitudes to finance, in particular in willingness to tolerate risk and instability. Another is that we might obtain useful insights into our system by considering how it might have appeared to those early Victorians. While their actions are economically irrational from our perspective, they would probably view many of our attitudes in a similar light.
Further studies of Victorian financial markets are desirable. There were many more financial instruments than have been discussed here. Their relative pricing should shed further light on the attitudes of contemporary investors and the functioning of their markets, and therefore on the genesis of modern financial markets.


