


The tulip speculation collapsed after the first week of February 1637, but there is no explanation for this timing. (Garber Reference Garber2001, p. 61)
Although economists, historians, and other social scientists have written at length about tulipmania, to date there is no explanation for the timing of either its boom or bust. By framing tulipmania in terms of sequestered capital – whose quantities, usages and future yields are hidden from market participants – we offer an explanation for the heretofore inexplicable timing of the boom and bust. Investment capital that is hidden can put the level of investment in such capital at odds with the prices of financial assets that hinge upon the quantities of such capital. Long overlooked by business cycle theorists, sequestered capital (investments that are non-signal emitting, or signal-less) appears to be a key factor that will shed new light upon the timing of financial boom/bust events.
The seventeenth-century boom in the prices of tulip bulbs and the prices of bulb futures contracts that took place in the Netherlands have often been explained in psychological terms such as tulip ‘mania’ or bulb ‘craze’. The meteoric acceleration of prices in the fall and winter of 1636–7 is an unusual economic phenomenon that has long inspired curiosity. Our reframing of tulipmania provides a straightforward explanation for the timing of the boom and bust of this historic financial bubble.
We organize the remainder of the article as follows: Section i provides a brief overview of the theory of sequestered capital that underlies our investigation of tulipmania. Section ii reviews tulip history and biology, and explains why viewing the bulbs as capital investments makes sense. Section iii discusses the financial innovations that define tulipmania. Section iv discusses the swarming of investment into hidden capital (the underground bulbs) in the fall of 1636 and the subsequent rise in the price of bulb promissory notes that continued until the bust in February 1637. Section v presents an explanation for the timing of the boom and bust along with a discussion of the post-collapse actions taken by the local Dutch governments. Section vi evaluates alternative hypotheses of the tulipmania boom and bust. Section vii presents a joint-probability calculation to assess the strength of our explanation. Section viii provides some concluding comments.
I
Recently, McClure and Thomas (Reference McClure and Thomas2016) discovered that the Austrian school's stages-of-production specification of the capital structure fails to account for the fact that the capital that businesses use to create new products is signal-less capital. Those researching and developing the new products keep this capital secret. Bringing this distinction into play provides an explanation of how a boom-to-bust event might arise even in the absence of an excessive expansion of credit by a monetary authority.Footnote 1 The key to the argument is that capital used in new-product research and development (R&D) is sequestered by the entrepreneurs employing it. New-product R&D capital is uncoordinated and unconstrained by the market's price and production signals that coordinate and constrain capital used to produce products that are already in the market. With sequestered capital in play the potential for an unsustainable boom arises whenever the interest rate falls below the natural rate.
Here we argue that the planting of the tulip bulbs in the fall of 1636, sequestering them literally out of sight, is crucial to understanding the tulipmania boom and bust. A thorough grasp of the historical and institutional context in which the financial crisis occurred is necessary to understand how sequestered capital applies. If the financial history and institutions surrounding tulipmania were unimportant, the annual planting of ordinary agricultural crops might rationally arouse concerns about the likelihood of unsustainable speculative booms at the planting of every crop. Our explanation for the tulipmania boom and bust depends not only upon the concept of sequestered capital, but also upon the historical context that made it crucial to this case.
II
Historian-turned-professional-writer Mike Dash has written a history (Reference Dash1999) of the tulip. He traced its origins to ‘the foothills and valleys of the Tien Shan Mountains, where China and Tibet meet Russia and Afghanistan in one of the least hospitable environments on earth’ (p. 5). Tulips are hardy; they are the ‘heralds of spring’ that sprout in late winter/early spring and emerge as the first flower of the year notwithstanding whatever unmelted snowfall remains on the ground. The tulip's hardiness and early emergence are important characteristics in our explanation for the timing of the bust in February 1637.
Nomadic Turks had ‘peopled the Asian steppe lands since the beginning of recorded history’ (Dash Reference Dash1999, p. 6). By the sixteenth century, Turks had carried tulips west to Istanbul where sultans revered them in grand gardens:
of all the blooms in a Muslim garden, the tulip was regarded as the holiest, and the Turkish passion for this flower went far beyond mere appreciation of its beauty. For the Ottomans, as for the Persians, it had a tremendous symbolic importance and was literally regarded as the flower of God because, in Arabic script, the letters that make up lale, the Turkish word for ‘tulip’, are the same as those that form Allah. The tulip also represented the virtue of modesty before God: When in full bloom, it bows its head. (Dash Reference Dash1999, p. 10)
A key link in the transmission of tulips to Holland was Ogier Ghislain de Busbecq, ‘the bastard son of a Flemish lord who was for years the most influential Netherlander in the Austrian court’ (Dash Reference Dash1999, p. 29). De Busbecq Ogier traveled to Constantinople in 1554 as the ambassador of the Holy Roman Emperor. From there he sent ‘valuable flower bulbs [tulips] and seeds from Istanbul to Europe’ by post c.1573.Footnote 2
It is important to consider tulip bulbs as investment goods. The tulip flower has extraordinarily vivid colors and variations that appear in strikingly distinct flames and flares; these explain the demand for the flowers. But wholesale trading was always in bulbs; ‘even before the mania began; the blossoming flower was never the object of wholesale trade’ (PosthumusFootnote 3 Reference Posthumus1928–9, p. 140). Understanding this point is crucial because it was neither the prices of tulip flowers nor the prices of tulip seeds that soared in the fall and winter of 1636–7 and subsequently plunged in February 1637. Bulb prices were the subject of speculations leading to dramatic price increases in early fall 1636 and the subsequent upward-accelerating prices on claims for future bulbs that inspired the term tulipmania.
The reason that tulip bulbs rather than tulip flowers were the object of wholesale trade is simply that bulbs, unlike seeds or flowers, are an economically viable investment good. Bulbs produce annual underground offshoots, or offsets that grow into new bulbs, which grow more offsets, which become new bulbs, etc. Existing bulbs, those that have flowered in the past, if planted in October/November will, again, produce two to three offset bulbs that are accessible when harvested the following summer. Although seeds can be used to produce bulbs that will eventually flower, growing tulips from seeds is not a good substitute (neither economically nor horticulturally) in comparison to growing from existing bulbs. This is for two reasons: (1) ‘A bulb produced directly from seed requires seven to twelve years before it flowers’ (Garber Reference Garber2001, p. 39); and (2) ‘because plants grown from a single pinch of seed gathered from just one flower can exhibit considerable variation, [so] it is impossible to know exactly what sort of tulip will emerge at the end of this time’ (Dash Reference Dash1999, p. 56).
Additional facts about tulip bulbs explain why some bulbs were so much more valuable than others were. Ironically, the best bulbs (those with the most highly valued color patterns) were those that Dutch tulip growers referred to as ‘broken bulbs’. Tulips in the wild are usually mono-colored. The Dutch discovered that if a mono-colored ‘breeder’ bulb was planted adjacent to a common-patterned bulb, the flower pattern of the second bulb would sometimes ‘break’ from its common pattern into a new pattern of greater intricacy, vividness and value:
The whole process [of ‘breaking’] was extremely unpredictable. There was no way of telling if or when a flower would break; one tulip might bloom in the spring with a dazzling new array of colors, while another, of the same variety and planted next of the first in the same flower bed, remained quite unaffected … The only certainties [to the seventeenth-century Dutch growers] seemed to be that tulips grown from seed were invariably breeders and that, once broken, a mother bulb would never again produce a unicolored flower. (Dash Reference Dash1999, p. 60)
The reason for the unpredictability of tulip breaking was not discovered ‘until well into the twentieth century, when an agent that causes the disease [responsible for the breaking], called the mosaic virus, was finally identified by the staff at the John Innes Horticultural Institute in London’ (Dash Reference Dash1999, p. 61). Although broken bulbs were coveted for their vivid color variations and patterns, the mosaic virus left the infected mother bulbs less hardy and, hence, less prolific than unbroken bulbs in terms of the number of annual underground offshoots (offsets that grow into clone bulbs of the mother) they would produce. This made the supply of clones of any broken bulb less elastic than unbroken bulbs:
Most [unbroken] tulip bulbs will produce only two or three offsets a year and can do so for only a couple of years before the mother bulb becomes exhausted and dies. For this reason, new varieties of tulips multiply only very slowly at first. Once a grower has identified, in a single flower of some new variety, great beauty or strength that he may be able to sell, he will have – even if all goes well – quite possibly only two bulbs the next year, four the year after that, eight in the next year, and sixteen in the fourth year of cultivation. (Dash Reference Dash1999, p. 57)
Regardless of whether the bulbs were broken or unbroken, they were akin to the contemporary capital investments into new-product R&D in an important way. Both are examples of sequestered capital by different means.Footnote 4
By the seventeenth century, tulips were found throughout Europe. Dash (Reference Dash1999, p. 32) dates ‘the first tulip definitely known to have flowered in Europe’ to 1559 in the garden of the ‘councilor of Augsburg, in Bavaria’ (Dash Reference Dash1999, p. 33); he also reports that from this and other bases in Venice, Italy and Bologna ‘the flower spread quickly from country to country. Its novelty, delicacy, and beauty made it welcome everywhere, and its wide distribution was assisted by the easy portability of bulbs.’
As tulips spread, demand for them kept increasing as new classes of consumers emerged; demand appears to have spread from collectors and botanists, to status seekers and finally to profit seekers. By the late sixteenth century, ‘a passion for tulips grew up among botanists and collectors … professional men with an interest in plants, particularly doctors and apothecaries, as well as a variety of elite groups’ (Goldgar Reference Goldgar2002, p. 6).
Carolus Clusius, a renowned sixteenth-century botanist, developed a classification system to distinguish ‘rare and covetable’ tulips from the ‘common and worthless’, making the tulip trade possible (Dash Reference Dash1999, p. 35). Ironically, Clusius lamented the emergence of tulip demand by status and profit seekers: ‘merchants, yes even artisans, low-grade laborers and other base craftsmen are getting involved in it [the bulb trade]. For they can see that rich men sometimes hand out much money in order to buy some little plant or other that is recommended because it is so rare, so that they can boast to their friends that they own it’ (Clusius quoted by Goldgar Reference Goldgar2007, p. 59).
Clusius was a bulb snob and a bit of a hypocrite: he ‘disapproved of the commercial activities of the “rhizotomi” (rootcutters), his name for the (mainly French) travelling sellers of bulbs and exotic plants, at the same time as he made purchases from them’ (Goldgar Reference Goldgar2002, p. 33). ‘Twice during the summer’ of 1596 and once ‘in the spring of 1598’, Clusius suffered a substantial loss of bulbs due to theft, ‘with more than a hundred bulbs taken in just one of these raids’ (Dash Reference Dash1999, p. 62). Furthermore, he speculates that:
Nevertheless, the thefts did have one positive result. [Via commercialization the] precious bulbs were distributed throughout the Netherlands, north and south, and they flourished. In some of their new homes, at least, they must have become parents of new hybrids, varieties that in their turn bred and formed an important part of the stock of bulbs traded in the next century. (Dash Reference Dash1999, p. 63)
Rather than the bulbs remaining in the gardens of elite connoisseurs, theft and commerce diverted them to florists and collectors across the Netherlands, ultimately, liberating them to play their part in spawning tulipmania.
III
Two financial innovations made possible the ‘buying and selling [of] flowers that were still in the ground’ (Dash Reference Dash1999, p. 114), making tulipmania possible. The first innovation was the substitution by 1635 of the old system of sale-by-the-bulb with sale-by-bulb-weight (ace).Footnote 5 For high-quality bulbs that continued to be sold as ‘piece’ goods, this innovation had the benefit of bringing prices into closer alignment with the discounted present value of bulbs and expected future offshoots/offsets:
Under the old system of paying by the bulb, a florist would have been charged the same for an immature tulip [bulb] weighing, say, a hundred aces, which might not produce offsets for another year or more, as he would for a mature specimen of four hundred aces. Paying by the ace, he was charged a price that more accurately reflected the development of the bulb. (Dash Reference Dash1999, p. 119)
The sale-by-weight innovation facilitated the sale of the ‘common’, low-quality bulbs ‘in standardized units of 1000 azen (plural of aas; synonym – aces) or 1 pound (9,728 azen in Haarlem, 10,240 azen in Amsterdam).Footnote 6 Purchase contracts for “pound” goods would not refer to particular bulbs’ (Garber Reference Garber2001, p. 44; italics added).
A second financial innovation, the bulb promissory note,Footnote 7 initially appeared in 1635. Importantly, this innovation was not in common usage until the fall of 1636. Promissory notes, as Dash (Reference Dash1999, p. 115) explains, ‘did much more than make the tulip trade a business that could flourish all year round; … it encouraged the sale and resale not so much of bulbs but of the notes themselves.’ As long as prices kept rising, promissory notes operated as a form of private money. It is the boom and bust in the prices of these futures contracts – the use of which became common practice in 1636 – that defines tulipmania.
Knowledge of the working details of these futures markets in bulbs (and their outgrowths) enriches our understanding of the boom in promissory note prices in the fall and winter of 1636-7:
Formal futures markets developed in 1636 and were the primary focus of trading before the collapse in February 1637 … Trading became extensive enough in the summer of 1636 … that traders began meeting in numerous taverns in groups called ‘colleges’ where trades were regulated by a few rules governing the method of bidding and fees. Buyers were required to pay one-half stuiver (1 stuiver = 1/20 guilder) out of each contracted guilder to sellers up to a maximum of 3 guilders for each deal for ‘wine money’. To the extent that a trader ran a balanced book over any length of time, these payments would cancel out. No margin was required from either party, so bankruptcy constraints did not restrict the magnitude of an individual's position.
Typically, the buyer did not currently possess the cash to be delivered on the settlement date, and the seller did not currently possess the bulb. Neither party intended a delivery on settlement date; only a payment of the difference between the contract and settlement price was expected. So, as a bet on the price of the bulbs on settlement date, this market was not different in function from currently operating futures markets. The operational differences were that the contract was not continuously marked to market – that is, repriced according to daily price fluctuations, required no margin deposits to guarantee compliance, and consisted of commitments of individuals rather than of an exchange. (Garber Reference Garber2001, p. 45)
There is little doubt that the absence of continuous repricing,Footnote 8 margin requirements, and the reputational capital and oversight of soberFootnote 9 exchange officials engendered the booming bulb-futures prices that define tulipmania.
IV
In one crucial sense, the planted tulip bulbs in 1636 were akin to capital employed in modern-day new-product R&D. The planted bulbs were signal-less capital. The reason that tulipmania provides the perfect illustration of signal-less (sequestered) capital is that there was information about neither the total number/types of bulbs that were planted in the fall of 1636 nor, by extension, the number of bulb offsets to be lifted in the late spring / early summer of 1637. Once planted, neither bulb development nor the growth of offsets could be seen. That is, an unknown amount of investment was made in the fall of 1636 into sequestered capital that was literally buried underground.
The stimulus of free coinage,Footnote 10 the emergence of private money in the form of promissory notes, and rising tulip popularity and bulb prices encouraged anyone in possession of tulip bulbs to grow their investment by planting them that fall. These stimuli resulted in Schumpeterian swarmingFootnote 11 into tulip bulb planting.
As prices rose, bulb planting and cultivation spread beyond professional growers:
I think the sequence of events may be seen as follows. At the end of 1634, the new nonprofessional buyers came into action. Toward the middle of 1635 prices rose rapidly, while people could buy on credit, generally delivering at once some article of value (bulbs and/or offsets); at the same time the sale per aas was introduced. About the middle of 1636 the colleges appeared; and soon thereafter the trade in non-available bulbs started, while in November of the same year trade was extended to common varieties, and bulbs were sold by the thousand azen and per pound. (Posthumus Reference Posthumus1928 – Reference Posthumus9, p. 444)
By the fall of 1636, bulb cultivation was swarming. Once the bulbs were planted, people in the Netherlands speculated on the value of the bulbs, bidding bulb-futures prices to dizzying heights.
Towards the boom in 1636, however, buyers of bulbs often knew that the seller possessed none; so they did not pay or deliver their goods till they were certain the tulip would really come into their possession. At the height of business, most transactions took place without any basis in goods. The trade in futures had degenerated into the purest gamble, the seller selling bulbs he did not have against a counter value, mostly money at this period, which the buyer did not possess. Each succeeding buyer tried to sell his ware for higher prices; and, in the general excitement, one could make a profit – at least on paper – of several thousands of florins in a few days. The craze spread rapidly with these high profits. All classes of the population ended by taking part in it – intellectuals, the middle class, and the laborers. (Posthumus Reference Posthumus1928 – Reference Posthumus9, p. 442)
The swarming into bulb cultivation, which resulted from the factors that expanded credit,Footnote 12 gave impetus to the unsustainable tulipmania boom. Repeating our epigraph: ‘The tulip speculation collapsed after the first week of February 1637, but there is no explanation for this timing’ (Garber Reference Garber2001, p. 61). In the next section, leveraging the perspective of sequestered capital, we explain the timing of the boom and collapse of tulipmania speculation.
V
Although explanations for the timing of economic booms and busts have generally been nonexistent or admittedly ad hoc, bringing the concept of sequestered capital into consideration promises to improve matters. So long as development remains hidden, an unsustainable boom may continue undetected because price and production signals are not forthcoming. Unsustainable booms, however, can be expected to collapse upon the emission of informational signals of systematic malinvestment/overinvestment that emerge at the end of the development phase. In this section, we offer insights into the timing of the tulipmania boom and the timing of the tulipmania bust.
It is not till the last planting … that people have sold the bulbs and brought the prices to great height. (Posthumus Reference Posthumus1928–Reference Posthumus9, p. 144; quoting Gaergodt's Dialogue)
Given the above quote (c.1636), a correlation can be made between the last planting of the bulbs and the onset of the soaring prices that defines tulipmania; but from then until now, no one has offered an explanation for this correlation. As explained in the previous section, unknown quantities of bulbs were planted in the fall of 1636, hidden underground as the process of new bulb development played out. So long as bulbs remained sequestered throughout the fall and winter of 1636–7, speculation continued to rage.
Figure 1 illustrates the boom and bust of Thompson's constructed index of tulip bulb promissory note prices (bulb-futures prices) from the late fall of 1636 through 1 May 1637.Footnote 13 Our graphic presentation of the dated index numbers differs from Thompson's for several reasons. First, our scaling of the timing on the horizontal axis is more accurate than Thompson's scaling, especially with respect to the relative lengths of the periods: (1) from 12 December 1636 to 1 February 1637; and (2) from 11 February 1637 to 1 May 1637.
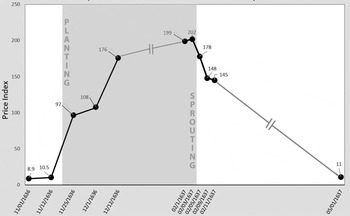
Figure 1. Prices of Dutch tulip bulbs, 1636–7
The former period (winter 1636–7), of about a month and a half, was when there were not enough recorded data for Thompson to be able to calculate his price index. The latter period was a much longer period of two and a half months; it is the period of time during which there were no price data because the market had been shut down by the local Dutch governments. Unmentioned by Thompson, the reopening of bulb markets on 1 May 1637 corresponds to the time at which bulbs were typically lifted – late April to early May. This is important because this is the time at which: (1) futures contracts could physically be settled; and (2) international bulb trade would have resumed, bringing into play the constraining effect of arbitrage upon price distortions.
Our second modification to Thompson's figure is the shading of the period from mid November 1636 through 4 February 1637. The shading defines the period during which the tulip bulbs were sequestered beneath the soil. This period began in the fall of 1636, when the bulbs were placed in holes six to eight inches deep and covered over, literally sequestered in the soil. From what is known about the planting of tulip bulbs that fall, planting began in late September and concluded by mid November.Footnote 14 Once underground, the bulbs became developing capital that was sequestered. The underground bulbs emitted no observable signals; no one could tell either the number of bulbs that had been planted or the number of outgrowths being produced by the planted bulbs. For these reasons, the shading in Figure 1, demarcating sequestration, begins in mid November. It is important to point out that our explanation for the tulipmania boom would hold up even if the last planting in the Netherlands in 1636 had occurred anywhere from October through November.
In the Netherlands, proximity to the sea moderates the temperature swings. This means that the ground there does not cool to below 60°F (the threshold temperature above which bulb planting is not recommended) as early in the fall as it does in other regional European countries. For this reason, tulips would have been planted earlier in the fall of 1636 in nations neighboring the Netherlands. Throughout the fall of 1636, as more and more bulbs were planted across Europe, the constraining force of arbitrage on price distortions in the Netherlands gradually disappeared because planted bulbs cannot be moved until lifting time (which, as mentioned above, typically occurs at the beginning of May). The earlier planting times elsewhere in Europe and delays created by seventeenth-century communications and transportation would likely have ended arbitrage opportunities in the Netherlands well before mid November. There is also no reason to think that arbitrage of the promissory notes would have been in play to any significant extent. The highly localized nature of information about the growers and bulbs involved and the nature of seventeenth-century communications and transportation must be remembered.
The crisis came unexpectedly. There is no reason to disbelieve the author of the Dialogues when he says that trouble began on February 3rd, 1637. At Haarlem, where the mania was more especially localized, insiders still advised people to buy on February 1st, with a guaranty on their part of eight days against possible losses. On February 4th the possibility of the tulips becoming definitely unsalable was mentioned … (Posthumus Reference Posthumus1928–Reference Posthumus9, p. 144)
Neither Posthumus nor Garber, nor anyone else we are aware of who has written about tulipmania, has offered an explanation as to why the bust began during the first week of February 1637. In light of our hidden-capital framing, the timing of the collapse of tulipmania is straightforward. The collapse occurred when the developing tulip bulbs sprouted. In the Netherlands in the seventeenth century, tulip bulbs would have sent up sprouts that became visible in late January or early February. As the sprouts emerged during the first week of February 1637, it became increasingly clear, day-by-day, that the quantity of new tulips (as a result of the swarming cultivation in the fall of 1636) was too large to support the prices.
As shown in Figure 1, the shaded area ends in the middle of the first week of February 1637. This marks the approximate date at which bulb capital developing underground ceased to be signal-less. Signals from the bulbs would have been increasingly clear by mid to late March 1637 when the tulip flowers would have been in full bloom.Footnote 15 However, it would not have required full blooms to signal the magnitude of the malinvestment/overinvestment and trigger the collapse. Simply looking out across the miles of flat brown earth covered in pale green tulip sprouts would have signaled both the volume of future flowers and the size of the future bulb harvest. The sprouts, which emerge four to six weeks before the flowers, would have appeared in the earliest part of February, coinciding with the collapse in prices that occurred on or before 4 February 1637.
Due to the localization of the colleges, and the limitations of communications and transportation in the Netherlands in the seventeenth century, the collapse played out like a line of toppling dominoes, and, as shown in Figure 1, by 11 February all the dominoes were down:
It took only a few days for the panic to spread through the rest of the United Provinces. In college after college and in town after town, desperate florists discovered that flowers that had been worth thousands of guilders only a day or two before now could not be sold for any price. A few dealers kept their heads and tried to stimulate renewed interest by organizing mock auctions or offering bulbs at huge discounts, but they were ignored. In most places the tavern trade crashed so completely that it was not even a question of prices falling to a quarter or a tenth of what they had been when the mania was at its peak. The market for tulips simply ceased to exist.Footnote 16 (Dash Reference Dash1999, p. 163)
This explains the void in Thompson's price index series between 11 February 1637 and 1 May 1637 and our representation of the void in Figure 1 with the gray line, with a gap in the middle, connecting the two dates.
During this period devoid of transaction prices, florists and politicians sought a way to reduce the looming economy-wide disruptions associated with the unwinding of the speculative bubble that the tulip sprouts had popped. Thompson draws together the gist of the discussions of Mackay ([1841] Reference Mackay2016) and Posthumus (Reference Posthumus1928–Reference Posthumus9) about the timing and fundamental outcome of this political process:
In particular, they tell us that, on February 24, 1637, a large organization of Dutch florists and planters, in a decision that was later ratified by Dutch legislatures and courts, announced that all contracts written after November 30, 1636 and before the reopening of the cash market in the Spring possessed provisions that were not in the original contracts. The new provisions relieved their customers of their original unconditional contractual obligations to buy the future tulips at the specified contract price but demanded that they compensate the planters with a fixed percentage of their contract prices. The provisions, in effect, converted the futures prices in the original contracts to exercise prices in options contracts. The corresponding option price paid to the planters was only later determined. In particular, after over a year of political renegotiation, the legislature of Haarlem, the center of the tulip-contract trade during the ‘mania’, determined the compensation to the sellers to be only 3½ % of the original contract price for those contracts made between November 30, 1636 and the spring of 1637. (Thompson Reference Thompson2006, p. 101)
With the ‘reopening of the cash market in the spring’, the bulb trade resumed and, as shown in Figure 1, the price index on 1 May 1637 was 11. The explanation for the reopening at that particular time, like the explanation for the timing of the boom and bust, has to do with both tulip flower and bulb biology and the market processes surrounding bulbs. By this time, all the bulbs would have flowered, making it possible to assess what had developed underground. For example: (1) newly broken bulbs would have been identified and the potential value of their visible color patterns would have been assessed, and (2) as lifting began, the number of bulb offsets and their health and the health of the mother bulb would become known. In addition, by this time, arbitrage would have resumed as bulbs were being lifted in other nations.
The protracted ex post political process that converted the future claims on sequestered bulbs into options unwound tulipmania, thereby diminishing the threatening economy-wide disruptions:
The tulip mania thus ended, as the Court of Holland had wished, not in a flurry of expensive legal actions but in grudging compromise. In the end it had been a craze of the poor and the ambitious that – contrary to popular belief – had virtually no impact on the Dutch economy. No general recession followed in its wake, and the vast majority of florists emerged from the liquidation shaken and chastened but little better or worse off than they had been before the mania began. (Dash Reference Dash1999, p. 193)
VI
Observed facts are necessarily finite in number; possible hypotheses, infinite. If there is one hypothesis that is consistent with the available evidence, there are always an infinite number that are. (Friedman Reference Friedman1966, p. 9)
The hidden (signal-less) capital explanation for tulipmania presented in this article must be assessed relative to the two existing hypotheses that have been advanced by Garber (Reference Garber1989; 2001) and Thompson (Reference Thompson2006). This section assesses the ‘goodness’ of the three hypotheses using Milton Friedman's criteria of: (1) ‘simplicity’; (2) consistency with ‘factual evidence’; and (3) ‘fruitfulness’ (Reference Friedman1966, pp. 7–10).
Garber compared the decline in tulip bulb prices in the seventeenth century with subsequent price declines he found in the eighteenth and nineteenth centuries. Finding the bulb-price declines to be of similar magnitudes, he argued that it was gross hyperbole on the part of Dash, and others, to refer to the seventeenth-century bulb-price movements as a mania. He argued that the so-called ‘tulipmania’ was a run-of-the mill price swing in line with subsequent bulb-price swings.
On both logical and empirical grounds, Thompson has discredited Garber's hypothesis. Logically, Thompson argues, ‘one might as easily infer from the later data that bulb markets are congenitally susceptible to irrational speculative excess as infer that the tulip bulb market has been efficient’ (Reference Thompson2006, p. 100). Empirically, Thompson took a more comprehensive look at Garber's estimates and concluded ‘once we complete Garber's reported tulip price data by employing his basic data sources, the seventeenth century price declines were not the 18th–19th century maximum average annual rate of 40%, but rather 99.999%!’
Thompson created a reliable price index from seventeenth-century sources and used it to criticize Garber's selective usage of data and sources. We have disagreement neither with Thompson's price index nor with his criticisms of Garber's tulipmania hypothesis. Unfortunately, Thompson's account of why tulipmania was not a mania is no stronger than Garber's account. Thompson's account generalizes, from just three transactions, that none of the promissory contracts were in fact promissory contracts. Rather, he argues, that all the promissory contracts should be converted into options contracts despite the existence of the dozens of deals that directly contradict his hypothesis (some, as we will see, contradict Thompson's ‘they were not what they said they were’ perspective in spectacular fashion).
Let us consider the three transactions upon which Thompson bases his hypothesis. The first is explicitly an options contract (rather than a promissory contract); the other two are low-price, cash transactions. These three transactions constitute Thompson's entire evidentiary case for discounting all other transactions prices (converting all promissory contracts into options contracts) that took place during tulipmania. Logically and empirically, Thompson's usage of these transactions as the basis for his hypothesis is fundamentally flawed.
Logically, there is no reason to convert the explicit promissory contracts into options contracts because of the existence of one contract that explicitly was an options contract. Yet incredibly, this is exactly the reasoning that Thompson (Reference Thompson2006, p. 112) provides:
By mid-December, the nature of the call option contract must have been widely understood by traders. Indeed, Dash (p. 165) describes in detail a deal made toward the end of December 1636 which plainly defines the terms of the option, as planter ‘Henricus Munting was able to complete a lucrative deal to sell a handful of his tulips for 7000 guilders to a man from Alkmaar only by promising his nervous customer that if prices fell before the summer of 1637 he could cancel the purchase and pay no more than 10 percent on the agreed price’ (p. 176). (footnote omitted)
On the contrary, if (as Thompson's hypothesis assumes) it would have been rational for market participants to have expected that promissory contracts would be discounted into options contracts, then: (1) there was no reason to use a more complicated contract; and (2) there was no reason for market participants (endowed, by assumption, with perfect foresight of all the legal and political processes that would play out after the bust) to have been ‘nervous’.
Empirical generalizations from small samples are always suspect; those based on a sample of only one or two observations should be circumspectly scrutinized. A careful reading of Dash's twelfth chapter raises red flags regarding the validity of the generalization based upon two low-price cash transactions that Thompson uses to ‘rationalize’ his hypothesis. Dash's twelfth chapter details the large number of high-price, cash transactions that took place at the estate auction in Alkmaar on 5 February 1637 of Wouter Winkel's bulb collection (an auction so lucrative that it left his seven orphans financially set for life):
The auction at Alkmaar was the supreme moment of the tulipmania. The crowd attracted to the sale seems to have been a cut or two above the general hoi polloi of the taverns, and almost certainly the bidders would not have been permitted to get away with college practices such as offering part payment in kind. This was an auction for connoisseurs and affluent dealers. Real bulbs were being sold on a large scale for cash … The buyers appear to have been convinced, either by the tulip book or by Winkel's reputation, that the flowers were of the highest quality and that this was a rare opportunity to acquire some of the most sought-after tulips in the United Provinces. They bid fiercely, and the prices achieved at Alkmaar were, with few exceptions, the highest ever recorded for the various tulips on sale. (Dash Reference Dash1999, chapter 12)
These ‘record’ high-price cash transactions directly contradict Thompson's hypothesis. Thompson's two observations leave the many observations constituting the ‘supreme moment in tulipmania’ – the transactions at the auction at Alkmaar – beyond explanation.
Relative to Garber's and Thompson's hypotheses, our signal-less capital approach offers an explanation for tulipmania that is (1) simpler, (2) more consistent with evidence and (3) potentially more fruitful.
The sequestered capital hypothesis is simpler because it depends upon no ex post rationalization. As we have explained, both the Thompson hypothesis and the Garber hypothesis are attended by logical and empirical inconsistencies; and each is largely an ex post rationalization. Thompson hypothesizes that all market participants would have rationally anticipated, ex ante, the rewriting of promissory contracts that took place ex post – after a full year of uncertainty involving numerous political proposals and reversals detailed by Dash. Garber hypothesizes that swings in flower prices in the eighteenth and nineteenth centuries mean that the tulipmania boom and bust was not a price bubble, but rather a run-of-the-mill price swing.
Due to the rise in popularity in tulips across Europe in the seventeenth century and the economic boom in the Netherlands, a swarm of tulip-bulb capital of unknown quantity was planted, and hence sequestered, in November of 1636. Unchecked by arbitrage, the prices of promissory notes (whose trade was the rage in Dutch pubs) rose until signals of the enormous quantity of capital that had been planted emerged. As the tulip sprouts became visible, emerging from beneath the Dutch soil in the first week of February 1637, the bubble burst. By the end of that week, as Dash (Reference Dash1999, p. 163) put it, ‘the market simply ceased to exist’.
By explaining the timing of both the boom and bust, something no other hypothesis does, the sequestered capital hypothesis establishes itself as being more consistent with the available evidence. Additionally, our hypothesis, unlike any other, offers insight into why the bust began in Haarlem. As explained by Dash:
The great crash in tulip [promissory note] prices began in Haarlem on the first Tuesday of that February, when a group of florists gathered to buy and sell as usual in one of the city's tavern colleges. As was customary, an established member of the college began the day's trading by testing the state of the market; he offered a pound of Witte Croone or Switsers for sale. The florist asked a fair price – 1,250 guilders – for the bulbs, and in the normal course of events he would have found several eager buyers. Slates of chalk would have been distributed, the tulips would have been knocked down to the highest bidder, and the rest of the day's trading would have continued in its usual frenzied way. On this day, however, there were no bidders for the bulbs at 1,250 guilders. The auctioneer offered them again, this time cutting the price to 1,100 guilders. Still there was no interest. Desperately now, he offered his bulbs for a third time, dropping his price to a risible thousand guilders for the pound. Once again there were no bids. (Dash Reference Dash1999, p. 162)
The Haarlem location is relevant to our sequestered capital explanation for two reasons. First, the temperature profile of Haarlem makes it a likely place for sprouts to have been seen earlier than other places. Temperatures of 32oF or below delay the date at which the tulip bulbs send up sprouts. Haarlem's proximity to the sea means that it, unlike many other cities in the Netherlands, does not typically experience such low temperatures. Table 1 presents evidence regarding the temperature of Haarlem relative to other current cities in the Netherlands that existed in the seventeenth century.
Table 1. Temperature profiles of major Dutch cities in fall and winter months (degrees Fahrenheit)

Source: www.weatherbase.com – from a variety of public sources of weather data.
The numeric entries in Table 1 are the average of the lowest temperatures over the past 30 years for each of the cities listed. Bulb biology is the reason to be interested in this particular metric. According to the commercial tulip production text by John C. Mather (Reference Mather1961), in his discussion of tulip-forcing in Great Britain (indoor cultivation methods by which tulips can be raised year-round):
Where prepared bulbs are being used a method known as double cooling is sometimes used. This consists in returning the boxed bulbs to the cold store where they are kept at 48oF until forcing. The advantages of this system are that an even cool temperature can be maintained without the possibility of wide temperature fluctuations which may occur outdoors. There the soil temperature may rise [in Great Britain] to 60oF soon after boxing, and in a cold autumn it may drop to 32oF by the end of November or earlier. Whereas the first may prematurely force the bulbs, the second may delay the growth of the shoot and bud out of the neck of the bulb. (Mather Reference Mather1961, p. 49)
By comparing the data in Table 1 for Haarlem with the lowest temperatures for the other cities, it is apparent that Haarlem is unique in a way that makes it the likeliest to see tulip sprouts before they are seen in the other cities. Haarlem is the city that both: (1) has the most moderate average temperature across the likely coldest months when tulip bulbs would have been in the ground; and (2) does not have a month in which the average lowest temperature dips to 32oF or lower.
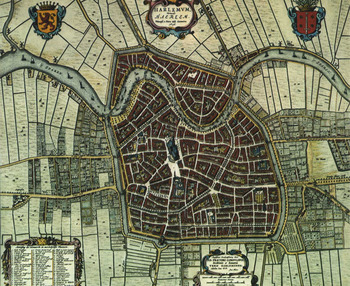
Second, beyond the moderate temperature profile that made Haarlem a likely place for the tulipmania bust to begin, Haarlem is a city that was completely surrounded by fields whose moist, sandy, lowland soil is ideal for tulip cultivation.Footnote 17 Being so surrounded means that the emerging sprouts would have been virtually impossible for anyone to overlook. The 1652 map of Haarlem reproduced in Figure 2 illustrates the point. As seen on the map, the town of Haarlem (the dark area in the map's center) was a veritable island surrounded by a sea of plotted agricultural fields (the more lightly shaded areas encircling it).
Not only is the sequestered capital hypothesis simpler and more consistent with the available data in comparison to the hypotheses of Garber and Thompson, but it is also potentially more fruitful. This is because our hypothesis is neither ad hoc (applicable only to the case of tulipmania), nor does it require any ex post rationalizations. The approach we have taken in this article to provide an explanation for the timing of the tulipmania boom and bust can be applied to other famous financial crises. Two such crises that we are currently investigating are the dotcom boom and bust of 1999/2000 and the stock market crash of 1929. In each case, we have conducted a preliminary review of the historical context in which each crisis took place, alert to the possibility that hidden capital may have cut off market signals and blindfolded speculators to capital quantities, usages and future yields. These preliminary reviews were so encouraging that we have begun full-scale investigations into the historical context, capital investments and timing of each of these well-known boom-to-bust events.
VII
The tulipmania boom drove the exchange values of bulbs so high that ‘mania’ and ‘madness’ have long been popular characterizations.Footnote 18 Had the tulipmania boom begun in any of the months other than the typical last planting month (November), this would have been solid evidence against our timing hypothesis. The odds that the boom would have begun in this particular month purely by chance are about 1/12, or 8.33 percent. If the bust had taken place in any of the months long after those in which tulips would have begun sprouting or those months when no tulips would have been sprouting (March, April, May, June, July, August, September, October, November, December), this would have been solid evidence against our hypothesis. The odds that the bust occurred, by chance, in one of the two months when tulips typically begin to sprout (late January or early February are the likeliest times) are about 2/12, or about 17 percent.
Combining the figures, the joint probability that both the boom and the bust timings would be consistent, by chance alone, with our hypothesis is approximately 1.4 percent (multiplying 1/12 by 2/12 by 100). Although this estimate inspires significant confidence in our timing hypothesis, because it is an upper bound estimate, even greater confidence should be applied to the hypothesis. The true odds that pure chance is responsible must be less than 1.4 percent because this estimate makes no correction for the odds that the bust would have, by pure chance, begun, as it did, in the city of Haarlem. The temperature profile and proximity of Haarlem to visible tulip fields made it one of the most likely places (per our hypothesis) for the bust to have begun.Footnote 19
VIII
Economists who study business cycles have long overlooked investment capital whose quantities, usages and future yields are hidden from market participants. This omission has obscured their understanding of booms and busts generally and the timing of booms and busts more specifically. The historical case of tulipmania offers, perhaps, the perfect illustration of the potential for sequestered capital to provide insight into the timing of economic boom-to-bust phenomena. As we have explained, the underground planting of tulip bulbs in the Netherlands (and throughout Europe) by mid November of 1636 shut off both bulb arbitrage and physical visibility of the quantity of planted bulbs.
Consistent with our theory, the beginning of the boom corresponded with the time when the bulbs were planted. Additionally, as informational signals (the tulip sprouts) became visible in the first week of February of 1637, a market correction ensued. Finally, the tulipmania bust began in the city of Haarlem whose temperature profile and proximity to tulip fields put it among the likeliest of places for the bust to have begun. Our back-of-the-envelope assessment of the odds that the timings of the tulipmania boom and bust occurred purely by chance, rather than because the tulip bulbs were sequestered beneath the ground, is below 1.4 percent.


