


1. Introduction
The diagnosis of schizophrenia is usually performed clinically by an operational approach such as implemented in the two most widespread diagnostic systems ICD-10 and DSM-V. Schizophrenic disorder is primarily characterized by so-called “positive symptoms” such as delusions, hallucinations and thought disturbances, and “negative symptoms” such as blunted emotions, social withdrawal, catatonic behavior and lack of spontaneity [Reference Liddle, Lane and Ngan1]. In addition to positive and negative symptoms, cognitive deficits are widely considered a core feature of the disorder and play a role as vulnerability indicators, as enduring abnormality across psychotic and clinically remitted periods and have a strong predictive influence on functional recovery [Reference Nuechterlein, Subotnik, Ventura, Green, Gretchen-Doorly and Asarnow2]. Cognitive impairments include symptoms of deficits in attention, memory and executive functions as well as social cognitive deficits such as constraints in emotion recognition, theory of mind and social attributional style [Reference Barch and Ceaser3, Reference Penn, Sanna and Roberts4].
The dopamine system is the neurotransmitter system which has been most commonly associated with schizophrenia, under the hypothesis that schizophrenic patients undergo an increased dopamine synthesis capacity in the striatum as compared to healthy subjects [Reference Howes, Williams, Ibrahim, Leung, Egerton and McGuire5]. While an enhanced activity within the subcortical mesolimbic dopaminergic pathway is associated with positive symptoms, negative symptoms and cognitive deficits are related to a hypoactive prefrontal mesocortical dopaminergic system [Reference Weinberger6–Reference Carlsson8]. Besides the widely discussed influence of dopaminergic neurotransmission, there is increasing evidence that alterations of serotonergic functioning also play a crucial role in the pathophysiology of negative symptoms in schizophrenia [Reference Wyss, Hitz, Hengartner, Theodoridou, Obermann and Uhl9].
However, in healthy volunteers the N-methyl-D-aspartate (NMDA) receptor antagonist ketamine led to more effects like negative symptoms than the serotonin 5-HT2A agonist N, N-dimethyltryptamine (DMT) as a typical hallucinogen [Reference Gouzoulis-Mayfrank, Heekeren, Neukirch, Stoll, Stock and Obradovic10]. Meta-analyses have reported that NMDA receptor agonist D-serine and glycine transporter type 1 inhibitor sarcosine reduce total and negative symptoms as an adjunct to antipsychotics [Reference Singh and Singh11, Reference Tuominen, Tiihonen and Wahlbeck12]. Based on these observations, it can be inferred that glutamate is also involved in the pathophysiology underlying negative and cognitive symptoms in schizophrenia.
Newer approaches assume that the dysregulation of subcortical dopamine system functioning is secondary to hyperactivity within hippocampal subfields. Preclinical and human imaging studies suggest an activation of the ventral hippocampus secondary to a loss of interneuron function which leads to dopamine hyperfunction [Reference Lodge and Grace13]. Results from animal and human studies indicate dysfunctional GABAergic inhibition [Reference Sullivan and O’Donnell14]. Additionally, the glutamatergic system is involved in the development of the cognitive impairment. Repeated exposure to NMDA receptor antagonists leads to changes in the GABAergic markers that mimic the impairments found in schizophrenia [Reference Lodge and Grace13, Reference Rotaru, Lewis and Gonzalez-Burgos15]. From the above studies, it becomes clear that the different neurotransmitter systems (dopamine, serotonin, glutamate, GABA etc.) are closely related and cannot be considered separately.
While alterations in brain structure are robustly seen in schizophrenia with standard Magnetic Resonance (MR) techniques, they may be not diagnostic, in particular during the prodromal phase of the illness, and structural alterations may be common to patients with psychotic features across diagnostic boundaries [Reference Strasser, Lilyestrom, Ashby, Honeycutt, Schretlen and Pulver16]. Further, structural changes in the schizophrenic brain are likely to be the end point in the chain of pathological events that lead to symptoms. Unlike structural investigations of the brain, it has only been possible to study alterations in brain function with the advent of functional neuroimaging techniques. Positron Emission Tomography (PET) is a well-established imaging technique in the field of oncology, cardiology and neurology [Reference Del Guerra, Belcari and Bisogni17]. PET and blood oxygenation level dependent (BOLD)-based fMRI provide a reasonable balance of spatial and temporal resolution to study regional brain function. On the one hand, fMRI does not require ionizing radiation and rather relies on the magnetic properties of endogeneous haemoglobin in the brain. On the other hand, PET allows to address metabolism and neuroreceptors in a way that MRI simply cannot. In fact, whereas in BOLD-based fMRI studies, the detected signal is related to the haemodynamic responses accompanying neural activity, PET allows studying, at different stages, specific biochemical processes involved in the control of cerebral activity. This is possible thanks to the development of new radiotracers, such as dopaminergic (e.g., F-DOPA), gabaminergic and glutamatergic radiotracers, now available for research and for clinical applications.
Neurophysiological techniques involve the assessment of electrical activity of the brain using scalp electrodes at rest or while the subjects participate in a given experimental paradigm. Electroencephalography (EEG) is a routine approach in clinical psychiatry today. Especially evoked potential parameters such as mismatch negativity (MMN), P300 [Reference Takahashi, Rissling, Pascual-Marqui, Kirihara, Pela and Sprock18] and NoGo-Anteriorization [Reference Ehlis, Pauli, Herrmann, Plichta, Zielasek and Pfuhlmann19] are being introduced into clinical routine due to their high sensitivity in detecting schizophrenic disorders. EEG is advantageous for its temporal resolution, far better than in other imaging methods, and for the time course analysis. The drawback is the relatively poor spatial information, e.g. 1 cm in the cortex with evoked potentials [Reference Kawohl, Waberski, Darvas, Norra, Gobbelé and Buchner20]. Substantial research has been carried out to clarify the relationship between neurotransmission and evoked potentials in EEG. For example, the loudness dependence of auditory evoked potentials (LDAEP) is closely related to serotonergic neurotransmission and the mismatch negativity (MMN) to glutamatergic transmission [Reference Heekeren, Daumann, Neukirch, Stock, Kawohl and Norra21, Reference Kenemans and Kähkönen22].
In summary, PET, MR and EEG provide complementary anatomical, physiological, metabolic, and functional information about the brain. Pooling information obtained with each modality has long been performed through parallel analysis of the sequentially acquired data and, more commonly today, by using software co-registration techniques. The rationale for multimodal imaging in the form of simultaneous MR/EEG, and the extension thereof to triple modality PET/MR/EEG has been already discussed in the literature [Reference Shah, Oros-Peusquens, Arrubla, Zhang, Warbrick and Mauler23]. However, an off-line combination of the MRI and PET data acquired separately at different times is still insufficient because a number of correlated, patient-specific influences such as blood flow, breathing, pulse rate and other physiological parameters may vary over time and therefore potentially in different ways in the two scanners. As a consequence, the full integration of different diagnostic modalities into a seamless clinical tool is mandatory for the acquisition of multi-parametric measurements on a routine basis in schizophrenia patients.
In this paper, we describe the status of the TRIMAGE project funded by EU (www.trimage.eu) that started at the end of 2013 and is expected to be completed by the end of 2018. The TRIMAGE project aims to create a trimodal, simultaneous, cost-effective PET/MR/EEG imaging tool that makes use of cutting edge technology with performance beyond the state-of-the-art. By integration of three relevant modalities, it will facilitate multiparametric characterization of brain tissue in a single diagnostic session. Since these modalities are involved in early diagnosis of schizophrenia, the project TRIMAGE is on this case first. This involves not only the development of integrated hardware but also the whole chain of image generation and multimodal data analysis. Once established, it may also be applicable to other mental health disorders such as Tourette syndrome [Reference Rajkumar, Rota Kops, Mauler, Tellmann, Lerche and Herzog24].
The TRIMAGE project [Reference Del Guerra25] is coordinated by the Department of Physics of University of Pisa and is run by a consortium of 11 partners, seven from academia and four from the SME environment, namely: Department of Physics of Pisa University, Technological Educational Institute of Athens, INFN Torino, Technische Universitat Munich, Forschungszentrum Jülich GmbH, JARA BRAIN-RWTH Aachen, Department of Psychiatry, Psychotherapy and Psychosomatics, University of Zurich, AdvanSiD s.r.l., WeeROC s.a.s., raytest GmbH and RS2D s.a.s.
PET/MR instrumentation available today can be one of these three types [Reference Zaidi and Del Guerra26]: sequential systems combine both modalities in the same manner as PET/CT systems do, placing them in a tandem configuration with some space between the two tomographs; a second approach relies on a removable PET insert, which can be placed within the bore of the MR scanner; finally, integrated systems include the PET detectors inside the MR scanner. The solution adopted for the TRIMAGE scanner is the fully integrated solution with the PET scanner positioned between the gradient coils and the RF coil, so as to optimize the space and the combined scanner performance. A schematic drawing of the proposed TRIMAGE scanner is presented in Fig. 1.

Fig. 1 Schematic drawing of the TRIMAGE scanner. The EEG cap is not shown.
The main objectives of this project are two-fold: (a) to build and optimize an integrated diagnostic solution including a molecular imaging tool based on simultaneous PET, MR and EEG; (b) to validate the new tool with specific protocols for detecting characteristic patterns in asymptomatic and at-risk patients and monitoring medication during drug therapy. The project is directed towards a new, cost-effective and integrated, “beyond the state-of-the-art” instrument in order to provide a toolset for the diagnosis of patients in most clinical psychiatric centres. The TRIMAGE project aims to discover and develop suitable biomarker combinations that are based on structural-functional-metabolic changes in the brain. The marker of functional changes will focus on alterations in the dopaminergic and the glutamatergic neurotransmitter systems using appropriate PET tracers. Thus, parallel to developing the combined instrument, TRIMAGE performs studies on existing PET/MR instrumentation available at partner institutions so that protocols and processing pipelines are optimized and can be implemented in the new device immediately after hardware development.
Here we report on the concept, status, and first results of this multi-faceted international project.
2. Material and methods
2.1. Imaging schizophrenia
At two partner sites, clinical PET/MR instrumentation is available that was used for imaging studies in the context of schizophrenia with the goal of adapting existing paradigms, so that they can be transferred to the TRIMAGE scanner. The MR-sequences were defined as compatible as possible in order to be able to perform post-hoc pooling and comparisons between the MRI data of the two sites. While dopaminergic imaging was the focus in Munich, glutamatergic studies are performed in Jülich, where EEG acquisition during PET/MR scans is an additional research focus.
2.1.1. The pilot study in Munich
Simultaneous [18F]-FDOPA PET and MRI was carried out in the combined whole-body mMR Biograph PET/MRI scanner (Siemens AG-Healthcare, Erlangen, Germany) [Reference Delso, Fürst, Jakoby, Ladebeck, Ganter and Nekolla27]. [18F]-FDOPA is a radioactively labelled precursor of dopamine, that permits measurement of presynaptic dopamine synthesis in the brain. The goal was to optimize the protocol towards quantitative imaging with maximum patient compliance.
PET scanning lasted 70 min and started simultaneously with an intravenous injection of 150 MBq of [18F]-FDOPA. PET data were reconstructed using ordered subset expectation maximization (OSEM) (21 subsets, 3 iterations) with a voxel size of 1.7 × 1.7 × 2 mm3 and corrected for attenuation and scatter based on anatomical MR information. 30 dynamic frames were created (1 × 30 s, 10 × 15 s, 3 × 20 s, 2 × 60 s, 2 × 120 s, 12 × 300 s). The MRI sequences were acquired simultaneously with PET. Resting-state functional MRI data were obtained by three separate sequences: whole-brain, focus on basal ganglia and orbitofrontal cortex, and focus on medial temporal lobe. T1-weighted anatomical data were also acquired.
The protocol adopted at Munich is described in Table 1 and illustrated in Fig. 2.
Table 1 Experimental procedure followed at Munich.

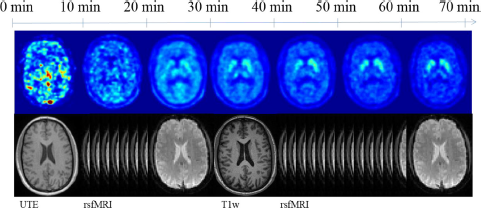
Fig. 2 Method and scanning protocol followed by the Munich group in the search of a biomarker.
PET data were motion corrected by realigning all frames (starting from 5 min) to the last PET frame (65–70 min), and then applying the transformation matrix for the last frame to all the early frames. A graphical Patlak analysis over the time frames from 20 to 60 min was conducted obtaining whole-brain kinetic parametric maps. From Patlak analysis the dopamine synthesis capacity can be measured through the index of the influx Kc. The simplified reference tissue model [Reference Lammertsma and Hume28], with the cerebellum as reference, was adopted to circumvent the necessity of arterial blood sampling. To correct for FDOPA metabolites the signal from the cerebellum was taken as a surrogate of the metabolite measurement from the plasma [Reference Kumakura, Vernaleken, Gründer, Bartenstein, Gjedde and Cumming29].
2.1.2. The pilot study in Jülich
A pilot study to explore the feasibility to record and to validate the trimodal acquisition protocol was designed and carried out on a 3T MR/BrainPET scanner (Siemens AG-Healthcare, Erlangen, Germany) equipped with a 64-Channel MR compatible EEG system (Brain Products, Germany). 11C-ABP688 tracer, which is a special ligand of the m-Glu5-receptor [Reference Hintermann, Vranesic, Allgeier, Brülisauer, Hoyer and Lemaire30] was applied as PET tracer. A healthy male volunteer (age 26) as control and a schizophrenic patient (age 49) were included in this exploratory feasibility study.
The main objectives of this study were the following:
• To optimise and validate the PET [11C]-ABP688 bolus + infusion scheme.
• To validate the MMN paradigm in EEG and fMRI for simultaneous acquisition.
• To perform an exploratory pilot analysis on the acquired trimodal data by calculating
○ the binding potential (BP) in target regions like the precuneus, cingulum posterior, hippocampus and parahippocampus, nucleus accumbens, frontal, mid- and inferior cortex and cerebellum using PET data,
○ functional connectivity measures using fMRI data and
○ to investigate the event related potentials (ERP’s) related to MMN in EEG data.
Since the pilot study in Jülich was conducted only to show the feasibility of simultaneous trimodal measurement using [11C]-ABP688 as tracer (in healthy controls as well as in Schizophrenic patients), the possible effects due to age, education, ethnicity, and smoking status between healthy controls and schizophrenic patients are not taken in to account.
2.1.2.1. Data acquisition
The trimodal data acquisition protocol [31,32] is illustrated in Fig. 3. PET data acquisition in list mode started simultaneously with the injection of the [11C]-ABP688 tracer. Immediately afterward MRI (structural and functional − MMN task) and EEG (only during MMN task) data were recorded at common timepoints.

Fig. 3 Trimodal data acquisition protocol developed and implemented by the Juelich group.
Description of the parameters applied in each imaging modality and MMN paradigm designed for this study are as follows.
2.1.2.2. MMN paradigm
The MMN paradigm included changes in tone duration (standard tone 50 ms, deviant tone 100 ms). Auditory stimuli (1 kHz, 10 ms attack/decay) were presented in alternating sequences of mostly 50 ms standard tones with fewer 100 ms deviant tones in position 9 up to 16 after the standard tone (SOA 0.85 s +/− 50 ms). The deviant positions were pseudo-randomized (only two equal positions following each other). A total of 1410 trials (8% deviant, 92% standard) were presented.
2.1.2.3. MRI
Anatomical images were acquired with MPRAGE sequence (TR = 2250 ms, TE = 3.03 ms, 176 sagittal slices, 1 mm slice thickness, GRAPPA factor 2). A T2*-weighted EPI sequence (TR = 2.2 s, TE = 30 ms, FOV = 200 mm, matrix size 64 × 64, slice thickness = 3 mm, 36 slices) was used for the acquisition of the functional images (620 vol).
2.1.2.4. PET
Patient and volunteer were injected with 575.2 ± 0.57 MBq of 11C-ABP688 via bolus injection plus constant infusion during 65 min [Reference Carson, Channing, Blasberg, Dunn, Cohen and Rice33] with 53 min of bolus magnitude component as already validated by other groups [Reference Burger, Deschwanden, Ametamey, Johayem, Mancosu and Wyss34]. Equilibrium between plasma and tissue was noticed at 30 min.
Data were acquired in list mode, iteratively reconstructed with 3D OSEM 32 iterations and 2 subsets: 42 frames, 30 frames with 10 s frame length, 6 frames with 220 s frame length (frames between the task intervals settings were not considered in the analysis), matrix size 256 × 256, 153 slices, voxel size 1.25 mm3 isotropic. MR-template-based attenuation correction [Reference Rota Kops, Hautzel, Herzog, Antoch and Shah35] was applied. The AC method adopted by Jülich was different from the one by Munich on a different scanner. However, a comparison between the two AC methods showed compatible performance [Reference Cabello, Lukas, Rota Kops, Ribeiro, Shah and Yakushev36]. PET data were corrected for decay, dead time, random events and scatter.
2.1.2.5. EEG
EEG signals were recorded simultaneously during the MMN task paradigm, along with fMRI and PET data, using a commercially available MR-compatible EEG-system (Brain Products, Germany). EEG signals were recorded relative to the channel Fpz as reference and a ground electrode was located at AFz (10–5 electrode system). Signals were sampled at 5000 Hz, with a bandwidth between 0.016 and 250 Hz. During the measurement, the subject was requested to lie down in a supine position and relax. A silent “Mr. Bean” video was presented to the subject. The helium pump of the magnet was switched off during simultaneous measurement.
2.1.2.6. Data analysis of the Juelich data
A detailed description of the data analysis of the Juelich data is presented in the supplemental files.
2.2. The PET/MR/EEG trimodal instrument
2.2.1. The MR scanner
The MR scanner is designed to be fully compatible with the PET module. The magnet integrates a new technology bringing together a very compact design with a cryogen-free magnet at the most widely available clinical field of 1.5T. The limited axial dimension reduces the claustrophobic effects for the patient and gives the possibility of PET bolus injection under control, the arms outside of the magnet. Fig. 4 represents the actual dimension of the magnet produced by SSI, Superconducting Systems Inc., U.S.A. The magnet coil is cooled with a cryocooler that takes a minimum amount of space near the magnet and allows the system to work without any cryogenic fluids (no liquid helium, no liquid nitrogen). Eighteen days are needed to cool down the magnet before energizing it. As a result, the simpler safety requirements reduce the cost and the installation complexity.

Fig. 4 Schematic drawing of the MR magnet.
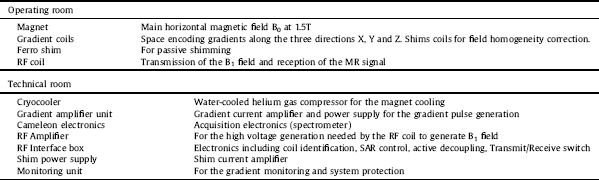
The magnet has been temporarily installed at RS2D (Strasbourg, France) for testing. A dedicated Faraday cage was built and installed around it. A description of the general properties of the MR component for the parts in the operating room and in the technical room is given in Table 2.
Table 2 MR System components.
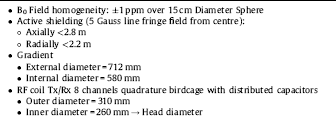
In addition to the measurement of the static B0 and of the magnetic field gradient strengths, imaging measurements were carried out on a standard MR phantom consisting of a PMMA cube (135 × 135 × 135 mm3) inside a cylinder (200 mm diameter and 160 mm length) filled with a preparation composed of 5 l of demineralized water, 18 g of NaCl and 6.25 g of CuSO4.
The selected RF coil is designed in two layers: the outer layer is a dedicated transmit-only, quadrature birdcage coil and the inner part is a receive-only, 8-channel phased array coil. Since the delivery date for this coil is December 2017, two other coils were used for testing the sequences to be implemented on the MR Scanner. The second one is an eight-channel degenerate birdcage coil for transmission and detection, manufactured using non-magnetic, fixed and variable capacitors located outside the PET field-of-view. The coils support frame is 3D printed on a polycarbonate substrate. The third coil is a quadrature birdcage coil built with copper tape on a PMMA cylinder tuned for the 1.5 T magnet.
2.2.2. The PET scanner
The PET component of the TRIMAGE system features a full ring (Fig. 5, right) comprising 18 LYSO/SiPM rectangular detectors [Reference Del Guerra, Belcari, Giuseppina Bisogni, Corsi, Foresta and Guerra37], 55 mm (transversal) × 163 mm (axial), with each one consisting of three square detector modules hosted in an RF shielded cassette. Each module is divided into four sub-modules, which we refer to as “tiles” (Fig. 5, left). A total of 216 tiles forms a full ring of 31 cm inner diameter. Each tile comprises two segmented LYSO crystal layers. The top layer (the nearer to the center of the field-of-view) consists of 7 × 7 crystals of 3.3 × 3.3 × 8 mm3, while the bottom layer has 8 × 8 crystals of 3.3 × 3.3 × 12 mm3. Both layers have a pitch of 3.4 mm and are half-pitch “staggered”, i.e., each crystal of the top layer is coupled to four crystals of the bottom layer. This configuration allows performing a dichotomic depth of interaction reconstruction, as photons interacting in different layers are expected to produce different light patterns on the SiPMs [Reference Camarlinghi, Belcari, Cerello, Pennazio, Sportelli and Zaccaro38].

Fig. 5 Left: module of the system (1 st layer in red and 2nd layer in blue), Right: scheme of the full TRIMAGE scanner. (For interpretation of the references to colour in this figure legend, the reader is referred to the web version of this article.)
The crystals in the bottom layer are coupled one-to-one to 64 SiPMs that are arranged in two matrices of 8 × 4 NUV SiPMs with a size of 3 × 3 mm2 manufactured by Advansid (Trento, Italy). All the 32 SiPMs are mounted on a common package which is completely covered with transparent epoxy layer. Each SiPM has approximately 5600 micro-cells, 40 μm side with a 60% fill-factor.
The light emitted by each LYSO matrix and sensed by the SiPMs is read out by a 64-channel TRIROC ASIC [Reference Ahmad, Fleury, C de la, Seguin-Moreau, Dulucq and Martin-Chassard39]. Four TRIROC ASICs are hosted on a single front-end board (ASIC board) that is able to read out all the 256 output signals from a detector module. The digital part of the TRIROC ASIC manages the conversion and the data transmission to a FPGA-based board that is hosted inside the cassette, called TX board as it transmits the acquired data to the back-end for coincidence processing.
The backend system is composed of a motherboard and 9 boards (RX boards) each one receiving data from two TX boards. The FPGA of the motherboard multiplexes the data coming from the RX boards; it handles the slow control and sorts all the single events by timestamp. Sorted events are then processed in real time for coincidence detection by timestamp comparison.
Several fully assembled prototypes of TX boards have been tested for coincidence read-out. Board testing coverage included: slow control registers read/write, high-speed data transfer, clock distribution, on-chip memory storage, on-chip events processing [Reference Sportelli, Ahmad, Belcari, Bisogni, Camarlinghi and Pasquale40].
2.2.3. The EEG
A commercially-available, 64-channel MR compatible EEG by Brain Products (Germany) will be used. An explorative study investigating and quantifying the effect of the components of an MR-compatible EEG cap during a simultaneous trimodal study on PET images has just been completed in Juelich [24,32]. The study was designed to investigate the influence of the EEG cap on the quality and quantification of PET images acquired during simultaneous measurements in the Jülich brain PET/MR device. The Brain-PET-MR emission images of the Iida phantom with [18F]-Fluorodeoxyglucose as well as of human subjects with EEG cap did not show significant artefacts caused by the EEG cap even though the applied attenuation correction did not take into account the attenuation of the EEG cap itself.
2.2.4. Integration of the three modalities
One of the main challenges in the design of the TRIMAGE hybrid scanner is to avoid interferences between components and parts of the PET and MR devices.
MR scanners, e.g., 1.5T MR scanner of the TRIMAGE project, use a number of radio frequency (RF) coils tuned to the Larmor frequency at 63.8 MHz to generate a magnetic field B1, perpendicular to the static B0-field, which can inhibit the PET electronics during the data acquisition. On the other hand, the emitted noise from the PET electronics can interfere with the MR signal, which is in the μV range and is picked up by sensitive RF receiver coils.
To avoid these interferences, usually a shield is installed between the two parts. For the TRIMAGE scanner the shield is based on a thin metal layer with high conductivity (e.g., copper), which provides a high shielding effectiveness (SE). The shield should not interact with the static B0 or the gradient fields. The interaction with the static field has been avoided by considering non-magnetic, e.g., nickel-free metals, with relative magnetic permeability μr ≈ 1, which do not perturb the homogeneity of the static field B0. The interaction between the shield and the gradients is more critical and has been carefully addressed. The main drawback of a standard shield based on a solid/continuous metal layer is the effect of eddy currents induced by the switching of gradient coils due to the law of induction. The fields produced by the eddy currents interfere with the gradient fields and change the encoding of the MR image. This effect is especially critical in MR sequences such as EPI and EPIK, which require fast switching gradients. In order to overcome this limitation, in the TRIMAGE project the standard solid metal shield has been replaced by an innovative frequency-selective shielding concept. The proposed solution is almost transparent to the gradient fields, thereby suppressing the eddy-current generation, while providing a high SE and EM screen for the PET electronics at the Larmor frequency. The frequency selective behaviour of the proposed shielding concept has been characterized via both simulations and measurements, including MR scans [Reference Berneking, Trinchero, Ha, Finster, Cerello and Lerche41].
Another possible source of interference is via the distortion of B0 and B1 fields due to the presence of material with a high magnetic susceptibility such as iron or nickel. While it is relatively easy to avoid iron in PET components, a full nickel-free construction is more challenging. In fact, nickel is widespread used in the plating process of electrical connectors. For that reason, we have selected a custom Nickel-Phosphide plating (that has a negligible magnetic susceptibility) for the components of the PET electronics and for the board to board connectors.
Another interference to be considered is the one between the cryocooler frequency and the MR. This effect has also been studied and will be avoided by filtering out the cryocooler frequencies from the MR data.
3. Results
3.1. Results of the pilot study
3.1.1. Recruitment and inclusion criteria
Recruitment of subjects with schizophrenia diagnosis according to ICD-10 and age- and education-matched healthy controls is described in the supplemental files. The recruitment took place at the two sites Munich and Jülich. Inclusion criteria were identical for both study sites.
3.1.2. Analysis of the Munich data
Presently, 12 patients with schizophrenia (mean age: 46.33 ± 10.52 years; 5 female) and 13 healthy control subjects (mean age: 43.76 ± 12.26 years; 6 female) were included in the study. All participants provided informed consent in accordance with the Human Research Committee guidelines of the Klinikum rechts der Isar, Technische Universität München.
Patients were recruited from the Department of Psychiatry by treating psychiatrists, healthy control subjects from the Munich area by word-of-mouth advertising. Participants’ examination included medical history, psychiatric interview, and psychometric assessment. Included patients suffered from chronic schizophrenia (at least 2 psychotic episodes) and were currently in psychotic remission. The mean total PANSS score was 47. Eleven patients were taking antipsychotic drugs at the time of measurement.
A two-sample t-test was used in order to test whether the groups differed with regard to age. There was no significant statistical difference with regard to age between patients with schizophrenia (mean age 46.33 years, standard deviation 10.52) and healthy controls (mean age 43.76 years, standard deviation 12.26), p = 0.58. With regard to gender, a chi-squared test was used to test for the frequency of men (7 in each group) and women (6 in the healthy control group and 5 in the patient group) between the two groups, resulting in no significant interaction (p = 0.83).
Fig. 6 shows an exemplar Kc map together with the last PET frame (65–70 mins) of the same subject, both overlaid on the T1 w for anatomical correspondence. In the PET frame, we see that most of the FDOPA is located in the striatum, together with some peripheral radio-metabolites. In the parametric map, a large number of voxels contained negative Kc values suggesting the unsuitability of the Patlak model for those voxels. Furthermore, the quality of the fitting (R2) was measured for each voxel, showing that most voxels in the brain have a poor fitting quality, mainly excluding the striatum. Only those voxels with a high fitting quality (R2 > 0.8) were considered in the region-of-interest analysis.
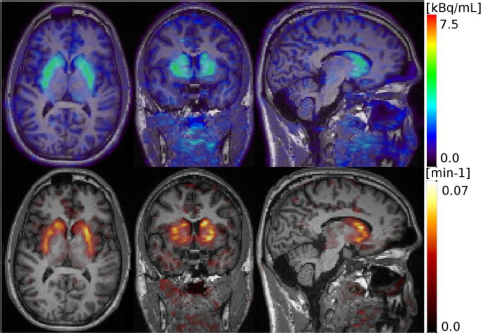
Fig. 6 Axial, coronal and sagittal PET slices from the last frame (65–70 min) (top) and from the Kc parametric map (bottom) at the level of the striatum.
Anatomical masks of striatal subregions from the Hammersmith atlas (accumbens, caudate and putamen), and functional masks from the Oxford-GSK-Imanova connectivity atlas (limbic, sensorimotor and executive) were non-linearly co-registered to the PET images using the Statistical Parametric Mapping2 (v12) tool in Matlab R2016b (The Mathworks, Inc., Natick, Massachusetts, United States) and the anatomical T1-weighetd MRI data. Regional Kc values were extracted from all voxels within the mask and two-sided t-tests were conducted to investigate group differences. Schizophrenic patients showed increased Kc values in the nucleus accumbens (0.040 ± 0.005 min−1) compared to healthy controls (0.035 ± 0.006 min−1) with statistical significance (p = 0.04) (Fig. 7 centre).

Fig. 7 The index of influx, Kc, in the whole striatum (left), nucleus accumbens (centre) and limbic region (right) of the striatum as measured with the PET/MR (mMR) at Munich.
Similarly, an increase of Kc values was found in the functional limbic region (Fig. 7, right), which largely overlaps with the anatomical region of the accumbens, for schizophrenic patients (0.039 ± 0.006 min-1) compared to controls (0.036 ± 0.006 min−1) (p = 0.043). No important differences were observed in the whole striatum (Fig. 7, left) or other striatal sub-regions.
3.1.3. Analysis of the Jülich data
3.1.3.1. FMRI
The functional connectivity measures calculated for the healthy subject and the schizophrenic patient are shown in Fig. 8. A two-sample t-test between GM mask and auditory network (AN) showed a significant difference (p < 0.0001) in both healthy subject and schizophrenic patient. These data based on two subjects must be taken as an indication only; larger group sizes are required before any definitive statement can be made.

Fig. 8 Functional connectivity measures, ReHo (top row) and DC (bottom row), for the healthy subject (left) and the schizophrenic patient (right). The colour bar shows Z standardized values in all images.
Similarly, the two-sample t-test between healthy subject and schizophrenic patient in AN and SN showed significant difference (p < 0.0001). The short range functional connectivity measure, called regional homogeneity (ReHo), and the long range functional connectivity measure, called degree centrality (DC), both showed less activation in comparison to the healthy subject.
3.1.3.2. PET
Time activity curves are shown in Fig. 9 for the healthy control and the schizophrenic patient. The time activity curves of Figs. 9 (top) and 9 (middle) show that we were in the equilibrium condition for non-displaceable Binding Potential calculations during the task. Average BPND values during the MMN task are given in Table 3 . Cerebellum was used as the reference region:
Furthermore, to address differences in activity concentrations in this patient versus healthy volunteer we normalized it by the reference region and made a performed a t-test. As an example, the Cingulum Posterior region normalized by the activity concentration in the cerebellum is plotted in Fig. 9 (bottom).
Table 3 Binding potential non-displaceable during task in different brain target regions.
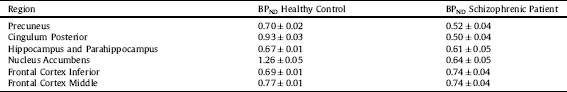

Fig. 9 Time activity curves of the healthy control (top) and the schizophrenic patient (middle); normalized activity curve of the Cingulum Posterior for the healthy control subject and the schizophrenic patient (bottom). Equilibrium is considered at 30 min after bolus plus infusion started.
The deviations in BPND represents the standard deviation between frames during the MMN task after 30 min.
3.1.3.3. EEG
The loudness dependence of auditory evoked potentials (LDAEP) during standard and deviant tone for control and schizophrenic patient are shown in Fig. 10. The computed amplitudes for the healthy control and the schizophrenic patient are 2.38 and 1.25 μV, respectively.

Fig. 10 LDAEP during standard (upper row) and deviant tone (lower row). A reduction in amplitude of MMN (deviant tone, lower row) is evident between healthy subject and schizophrenic patient.
3.2. Preliminary results of the performance of the trimodal instrument
3.2.1. MR performance
The major properties and static measurements performed on the magnet are reported in Table 4.
Table 4 Main properties and static performance of the MR magnet.
To measure the performance of the gradient system a gradient echo profile sequence on the axis X, Y and Z at maximum power was set up and the max voltage and the current monitoring port of the gradient amplifier were measured. The actual measured strength of the gradient was 41.23 mT/m, 41.3 mT/m and 41.2 mT/m for the X, Y and Z axis, respectively.
The gradient distortion measured with the PMMA phantom gave a standard deviation of the measured length of the phantom cube side of 0.69%, 0.75% and 0.93% for the X, Y and Z axis, respectively.
3.2.2. PET performance
Results on a demonstrator composed of a detector module readout by four TRIROC ASICs via a dedicated test bench are reported here. The flood map obtained with only the single layer shows well separated pixel spots indicating a proper ASIC and data acquisition functioning. The centroid algorithm implemented in the FPGA is also running to specifications with a 90% accuracy in pixel identification [38,40].
The energy resolution at 511 keV is 16% for the top layer and 18% for the bottom one. The worse energy resolution of the bottom layer can be attributed to the higher light dispersion that occurs when the scintillation light is produced in the bottom layer.
The best coincidence time resolution (CTR) obtained with two crystal pixels is shown in Fig. 11. The obtained value (420 ± 33) ps is at the state of the art of the advanced time-of-flight PET tomographs.

Fig. 11 Coincidence time resolution (CTR) obtained with two crystal pixels. The CTR FWHM is (420 ± 33) ps.
3.2.2.1. Simulation
Monte Carlo simulations were established to study the expected system performance and generate data which dedicated image reconstruction algorithms can be developed with even before real data are available. The GATE Monte Carlo toolkit [Reference Jan, Benoit, Becheva, Carlier, Cassol and Descourt42] was used for simulating the data using a precise description of the hardware under development. Several geometrical phantoms were implemented covering realistic imaging situations. For PET image reconstruction, the statistical iterative Maximum-Likelihood Expectation-Maximization (ML-EM) algorithm based on the PRESTO toolkit [Reference Scheins, Herzog and Shah43] was used, which was developed in Jülich for the MR-compatible BrainPET insert [Reference Herzog, Langen, Weirich, Rota Kops, Kaffanke and Tellmann44].
The simulated PET model was evaluated for its performance according to the NEMA standards. Specifically, the i) spatial resolution, ii) sensitivity and iii) count rate were evaluated on the basis of Monte Carlo simulations. For the lack of specific NEMA procedures for dedicated brain systems, NEMA standards [45–47] have been adapted case by case.
3.2.2.2. Spatial resolution
An 18F back-to-back point source was used to assess the spatial resolution with 1 MBq for 700 s measurement time. The source was placed at different positions within the active field of view (FOV). The spatial resolution, measured radially and tangentially, was obtained by applying the 2D filtered back-projection (FBP) within the software for tomographic image reconstruction (STIR) toolkit [Reference Thielemans, Tsoumpas, Mustafovic, Beisel, Aguiar and Dikaios48]. Spatial resolution varied between 2.34 mm and 3.66 mm (FWHM) axially moving radially 10 mm to 100 mm from the centre of the FOV.
3.2.2.3. Sensitivity
The simulated coincidence efficiency (i.e., the sensitivity) of the PET scanner for a point source positioned at the centre of the FOV was 61 cps/kBq.
3.2.2.4. Count rate
In order to assess the count rates, we used a solid, cylindrical phantom made of polyethylene (density 0.96 ± 0.1 g/cm3) with dimensions of 70 mm in length and 25 mm in diameter, according to NEMA NU 4-2008. The phantom is placed at the centre of the axial and transaxial FOV of the modelled scanner. A cylindrical hole of 3.2 mm diameter was drilled parallel to the central axis of the cylinder, at a radial distance of 10 mm from the centre. The line source insert is a clear polyethylene plastic tube 60 mm in length, filled with 5 to 11 kBq/ml of 18F and threaded through the hole in the phantom for 1000 s measurement time. The noise equivalent count (NEC) curve derived from the NEMA NU2-2008 phantom shows a peak NEC above 1.8 Mcps at 250 MBq.
3.2.3. Attenuation correction
Attenuation correction is essential for quantitative PET and is more challenging than in standard PET/CT. To optimize processing, we again used data obtained with existing PET/MR instrumentation (mMR in Munich). We developed a method that is based on the calculation of the R2-map [Reference Cabello, Lukas, Förster, Pyka, Nekolla and Ziegler49] from the dual echo Ultra-Short-Time-Echo (dUTE) images, and further post-processing to extract the bone structures and air cavities. The rest of the tissue was assumed to be soft tissue (fat, water…). It has been demonstrated in previous studies that bone and air are the two main tissues to identify, that have an impact on the PET quantification [Reference Visvikis, Monnier, Bert, Hatt and Fayad50]. The post-processing was based on statistical-based thresholding followed by linear transformation of the intensity values to Hounsfield units [Reference Cabello, Lukas, Förster, Pyka, Nekolla and Ziegler49]. To evaluate the method, nine patients were double measured in a PET/CT scanner (for reference) and in the PET/MRI, and uptake concentration in several brain regions were compared. A further comparison of the results was performed with the two methods provided by the mMR manufacturer based on the Dixon and UTE sequences, and with three state-of-the-art methods [51–53], one of them being the method used in the pilot study at Jülich. The evaluation was performed at the level of PET uptake accuracy and at diagnostics imaging accuracy, by comparing the nine patients with a database of control subjects (Neurostats) to identify hypo-metabolic regions, indicators for dementia [Reference Cabello, Lukas, Rota Kops, Ribeiro, Shah and Yakushev36]. Results demonstrated <5% error in PET quantification, and >90% precision at identifying abnormal glucose metabolism in patients with suspected Alzheimer’s disease, compared to attenuation correction based on CT. Translation of this method to the TRIMAGE scanner will be straightforward.
4. Discussion and conclusions
Several data acquisition and processing methods have been developed while the TRIMAGE scanner development is still under way.
Results from the experiments in Munich with the FDOPA (Fig. 7) demonstrate that regional analysis of the striatum can be feasibly used in a multi-modal platform. The evaluation shows that group differences between healthy controls and schizophrenic patients are well replicable. Due to the clear overlap between the two groups, a statement on the individual level is possible only to a limited extent. It is important to highlight the small size of these regions (i.e. accumbens as anatomical sub-region and limbic as functional sub-region, which emphasizes the need for an excellent functional-anatomical co-registration, as provided by simultaneous PET/MRI acquisition. This feature is especially relevant in long PET scans, like the ones performed in the present study. No partial volume correction was performed. Additional investigations by correlating the PET and fMRI data are ongoing.
A primary, exploratory analysis of the data of the healthy and the schizophrenic patient was done in Jülich. The acquired datasets from the three modalities show alterations in the connectivity measures assessed via fMRI (Fig. 8) and a change in binding potential in the PET data (Fig. 9). The MMN LDAEP EEG data (Fig. 10) show a difference between volunteer and schizophrenic patient data on a single trial level. We emphasize that in the absence of a group comparison, these data should not be over interpreted. Both the functional connectivity measures ReHo and DC showed less activation in comparison to the healthy subject. This indicates that communications between neurons in the brain of the schizophrenic patient are disrupted locally and at long range. Interestingly, the joint pilot data from Munich and Jülich show alterations in the nucleus accumbens. An ROI analysis performed on the Jülich data also displayed alterations in the glutamatergic system in the schizophrenic patient; we note this is a single subject result and should not be over interpreted. This avenue will be further investigated.
These preliminary results validate the PET [11C]-ABP688 bolus + infusion scheme and the design of MMN paradigm. The primary results from the three modalities show significant difference in BPND in the considered target regions (PET), difference in amplitude of MMN (EEG) and significant difference in functional connectivity measures in AN and SN (fMRI) between a healthy control subject and a schizophrenic patient indicating the potential use of a simultaneous trimodal measurement as a tool for detecting biomarkers in schizophrenia.
These findings need replication and will be extended to a much larger sample, as planned. However, initial findings on single subject level are very encouraging.
As for the TRIMAGE scanner development, the PET and MR scanner have been designed and built both as for the hardware and software side. The preliminary performance is very encouraging, since they respect the original specifications. The integration of three devices (PET, MR and EEG) in a single instrument is ongoing and the complete TRIMAGE scanner will be installed in Jülich in late spring 2018 to perform the pilot study on the 3 groups of 15 schizophrenic patients, 15 prodromic patients and 15 healthy volunteers.
The major advantage of the magnet is the new superconducting technology developed with a cryo-cooler with no liquid nitrogen and a closed circuit He gas. This allows a much simpler and safer installation and an easier and cheaper maintenance. Furthermore, the limited axial extension reduces claustrophobia to the patient and allows bolus injection with direct supervision. The limited field strength of 1.5T could give a lower signal/noise ratio with respect to a 3T magnet, but this will be compensated by a more powerful dedicated RF coil. The PET scanner performs well beyond the state of the art. The spatial resolution of 2.34 mm (FWHM) axially as obtained in simulation at 10 mm radius from the centre of the FOV with 2D-FBP is almost a factor 2 better than the current mMR whole body PET/MR system [Reference Delso, Fürst, Jakoby, Ladebeck, Ganter and Nekolla27]. The improvement in spatial resolution is of outmost importance for obtaining quantitative information within the sub-regions of the striatum (i.e., Figs. 6 and 9), because a higher spatial resolution increases the recovery coefficient. Furthermore, the simulated sensitivity of the PET scanner for a point-like source of 10 MBq at the centre of the FOV is 6.1% for a 380–850 keV energy window, i.e., at least a factor 2 higher than the current PET/MR systems. On the other hand, the limited axial extend of 160 mm is lower than the standard 250 mm of the commercial PET/MR devices, but the available axial extent is adequate for the designed application. The addition of the EEG adds the third imaging modality to the TRIMAGE scanner. This is a unique feature that could give a complete temporal analysis. Once available, this new trimodality instrumentation may facilitate hypotheses for new biomarkers, which can be checked versus clinical evidence not only in the field of schizophrenia, but also in other mental disorders.
Acknowledgments
The research leading to these results has received funding from the European Union Seventh Framework Programme (FP7/2007-2013) under grant agreement n° 602621- Trimage.
N. Jon Shah is funded in part by the Helmholtz Alliance ICEMED − Imaging and Curing Environmental Metabolic Diseases, through the Initiative and Network Fund of the Helmholtz Association. N. Jon Shah acknowledges funding from the BMBF and Siemens for the 9.4T MR-PET project (Grant number 13N9121). N. Jon Shah and Irene Neuner report partial funding from the DFG for the implementation of the trimodal approach (Shah DFG SH 79/2-2). Claudia Regio-Brambilla is financed by a DAAD PhD stipend under the joint supervision of Irene Neuner and Christoph Lerche with focus on the ABP688 approach. We thank Suzanne Schaden, Silke Frensch and Cornelia Frey for excellent technical assistance in data acquisition in Jülich.
The PET/MR facility at the Technische Universität München was funded by the Deutsche Forschungsgemeinschaft, Großgeräteinitiative (DFG). The research leading to these results has received funding from the European Union Seventh Framework Program (FP7) under grant agreement no. 294582 ERC Grant MUMI. The excellent technical assistance of Sylvia Schachoff at TUM is greatly appreciated.
Appendix A. Supplementary data
Supplementary data associated with this article can be found, in the online version, at https://doi.org/10.1016/j.eurpsy.2017.11.007.


Comments
No Comments have been published for this article.