


Introduction
Schizophrenia (SCZ) is a severe disorder with a large burden of morbidity and societal impact. It has a heritability of ~80%, much of which is attributable to common risk alleles [Reference Trubetskoy, Pardiñas, Qi, Panagiotaropoulou, Awasthi and Bigdeli1]. Patients with SCZ often have a large number of comorbid medical conditions during their lifespan [Reference Krebs, Themudo, Benros, Mors, Børglum and Hougaard2, Reference Mitchell, Vancampfort, Sweers, van Winkel, Yu and De Hert3]. In fact, people with SCZ have a higher mortality rate than the general population, corresponding to a 10–20 year reduction in life expectancy, predominantly due to cardiovascular disease [Reference Kurdyak, Mallia, de Oliveira, Carvalho, Kozloff and Zaheer4, Reference Rødevand, Steen, Elvsåshagen, Quintana, Reponen and Mørch5].
Antipsychotic (AP) drugs can help reduce the intensity and frequency of psychotic symptoms; however, most of them are obesogenic [Reference Vázquez-Bourgon, Ibáñez Alario, Mayoral-van Son, Gómez Revuelta, Ayesa Arriola and Juncal Ruiz6]. There are differences in the weight gain caused by AP drugs, with olanzapine and clozapine presenting a higher risk [Reference Pillinger, McCutcheon, Vano, Mizuno, Arumuham and Hindley7]. Obesity is a modifiable risk factor that reduces the quality of life [Reference Allison, Mackell and McDonnell8], adherence to treatment [Reference Dayabandara, Hanwella, Ratnatunga, Seneviratne, Suraweera and de Silva9], and is associated with many adverse health-related outcomes, including cardiovascular disease [Reference McWhinney, Kolenic, Franke, Fialova, Knytl and Matejka10, Reference Wilson, D’Agostino, Sullivan, Parise and Kannel11]. The risk of obesity in patients with SCZ is more than four times higher than in the general population [Reference Correll, Detraux, De Lepeleire and De Hert12]. In fact, the first year after the initiation of AP treatment is a critical period in which up to 60–80% of the total weight gain occurs [Reference Pérez-Iglesias, Martínez-García, Pardo-Garcia, Amado, Garcia-Unzueta and Tabares-Seisdedos13, Reference Bioque, García-Portilla, García-Rizo, Cabrera, Lobo and González-Pinto14]. Among all factors studied, rapid initial weight gain, AP drug, pretreatment body mass index (BMI), and sex are the best predictors of weight gain and associated metabolic abnormalities [Reference Gebhardt, Haberhausen, Heinzel-Gutenbrunner, Gebhardt, Remschmidt and Krieg15–Reference Raben, Marshe, Chintoh, Gorbovskaya, Müller and Hahn17]. However, substantial differences in susceptibility between individuals under AP treatment suggest that weight gain may be partially explained by a mixture of environmental effects and genetic background [Reference Theisen, Gebhardt, Haberhausen, Heinzel-Gutenbrunner, Wehmeier and Krieg18–Reference Müller and Kennedy20]. In support of this view, the heritability of weight gain in monozygotic twins with SCZ has been estimated to be 0.6–0.8 [Reference Gebhardt, Theisen, Haberhausen, Heinzel-Gutenbrunner, Wehmeier and Krieg21] and a few genetic loci have been associated with AP-induced weight gain by genome-wide association studies (GWAS) [Reference Ter Hark, Jamain, Schijven, Lin, Bakker and Boland-Auge22, Reference Maciukiewicz, Tiwari, Zai, Gorbovskaya, Laughlin and Nurmi23]. Moreover, given its strong polygenic component, SCZ shows extensive genetic overlap with other mental disorders [Reference Lee, Anttila, Won, Feng, Rosenthal and Zhu24, Reference Andreassen, Djurovic, Thompson, Schork, Kendler and O’Donovan25], and also with other nonpsychiatric traits [Reference Smeland, Bahrami, Frei, Shadrin, O’Connell and Savage26–Reference Bahrami, Steen, Shadrin, O’Connell, Frei and Bettella28]. In particular, studies have reported a negative overall genetic correlation between BMI and SCZ, which results from a mixture of variants with concordant and discordant effects [Reference Bahrami, Steen, Shadrin, O’Connell, Frei and Bettella28–Reference Ikeda, Tanaka, Saito, Ozaki, Kamatani and Iwata30].
There is a substantial genetic vulnerability to BMI trajectories in the general population [Reference Khera, Chaffin, Wade, Zahid, Brancale and Xia31, Reference Krapohl, Patel, Newhouse, Curtis, von Stumm and Dale32]; however, it remains to be established whether prediction models, including the polygenic risk score (PRS) for BMI (PRSBMI), are clinically useful for populations with psychiatric disorders. In this study, we aimed to determine whether common genetic variants for BMI confer a risk of BMI increase at treatment initiation in patients with first episode of psychosis (FEP), and to investigate the role of shared and private BMI variants in BMI increase (∆BMI). To our knowledge, this is the first study to confirm the role of genetics in FEP-associated weight gain, with a significant contribution of shared variants between the two traits, highlighting their relevance and applicability. This information can be used to identify individuals with an increased risk at the very early stages of the disease.
Methods
Study design
This study includes individuals with a FEP initially enrolled in the Cantabria Program for Early Intervention in Psychosis (PAFIP, Spain) between 2001 and 2018 [Reference Pelayo-Terán, Pérez-Iglesias, Ramírez-Bonilla, González-Blanch, Martínez-García and Pardo-García33]. Patients fulfilling inclusion criteria (Supplementary Material) were assigned to three consecutive phases of the PAFIP (PAFIP I, II, and III), including randomized, flexible-dose, and open-label clinical trials and followed up for 12 months. During this period, AP doses were adjusted at the treating psychiatrist’s discretion to target the lowest effective dose [Reference Gómez-Revuelta, Pelayo-Terán, Juncal-Ruiz, Vázquez-Bourgon, Suárez-Pinilla and Romero-Jiménez34]. Similarly, AP treatment could be switched based on the observed effectiveness and the patient’s tolerance. For further analysis, the diagnosis was categorized into Schizophrenia, Schizoaffective disorder, Schizophreniform disorder, Brief psychotic disorder, and not otherwise specified psychosis. Written informed consent was obtained from all subjects. The Clinical Research Ethics Committee of Cantabria approved the research protocol.
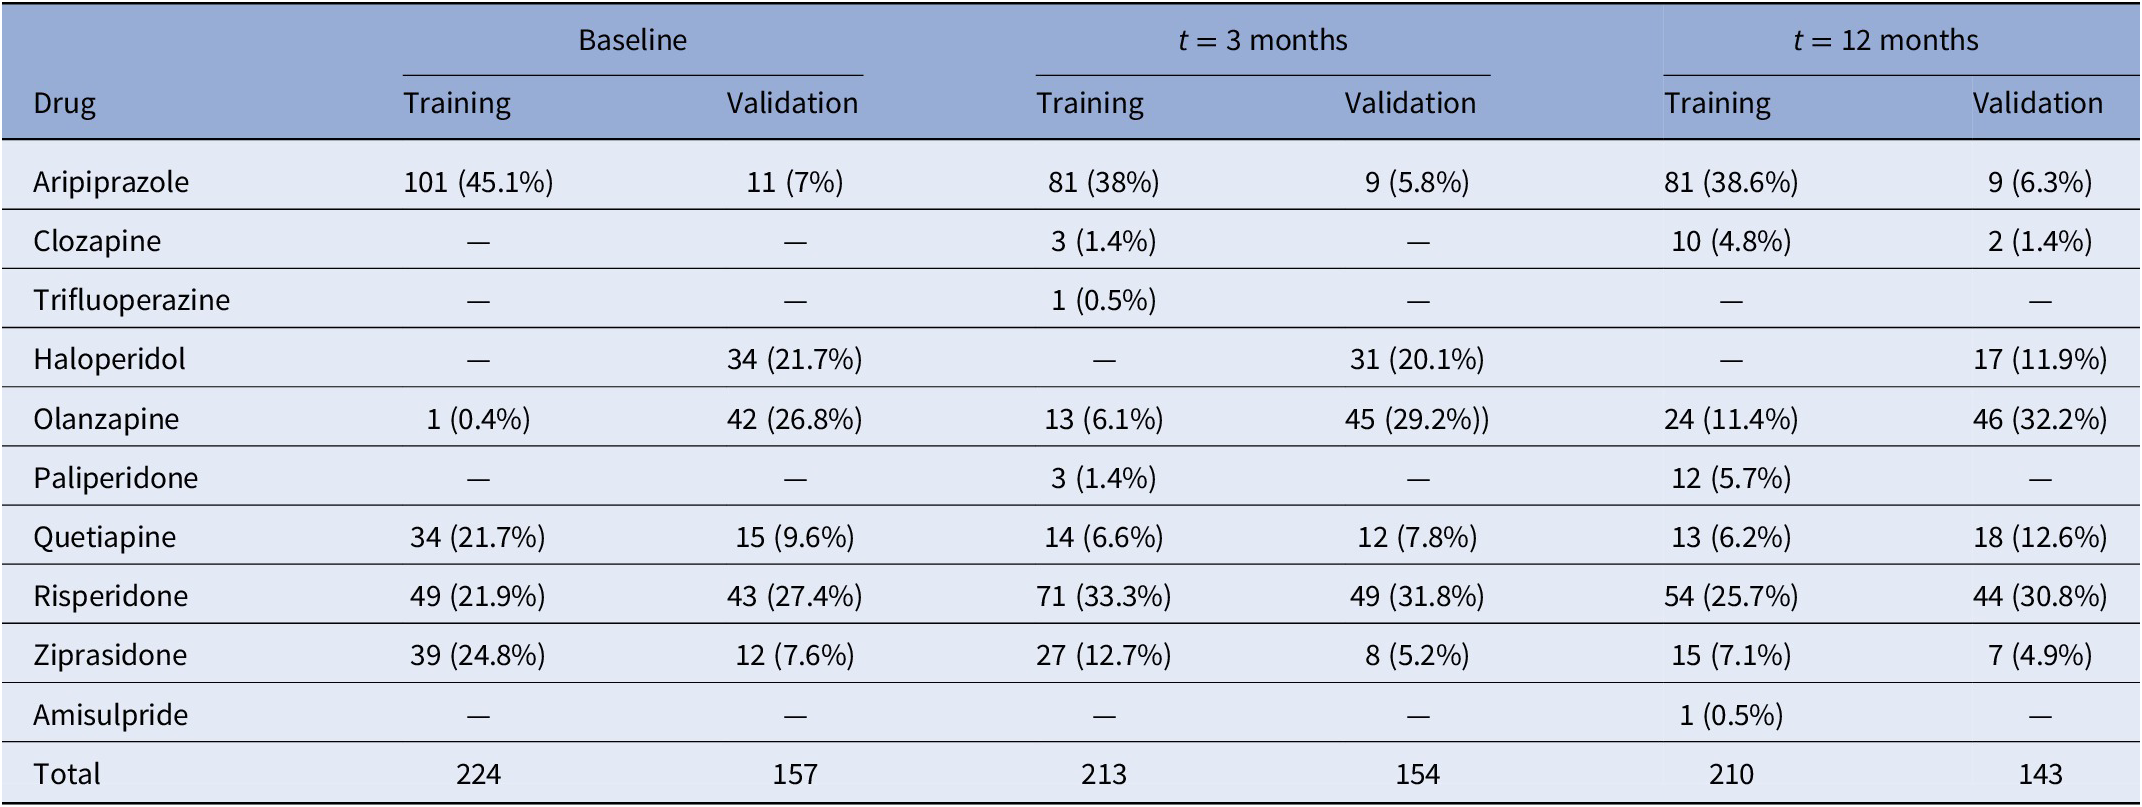
Patients were evaluated for research purposes at three consecutive time points: at baseline, and at 3- and 12-month follow-ups (after the initiation of AP treatment). Sociodemographic characteristics were recorded at baseline (Table 1), while clinical and anthropometric measures were obtained at each time point. Pharmacological treatment prescribed and chlorpromazine equivalents [Reference Gardner, Murphy, O’Donnell, Centorrino and Baldessarini35] were also recorded at each time point. Patients were grouped based on the primary active drug (Table 2).
Table 1. Sociodemographic and clinical characteristics of the sample at baseline.
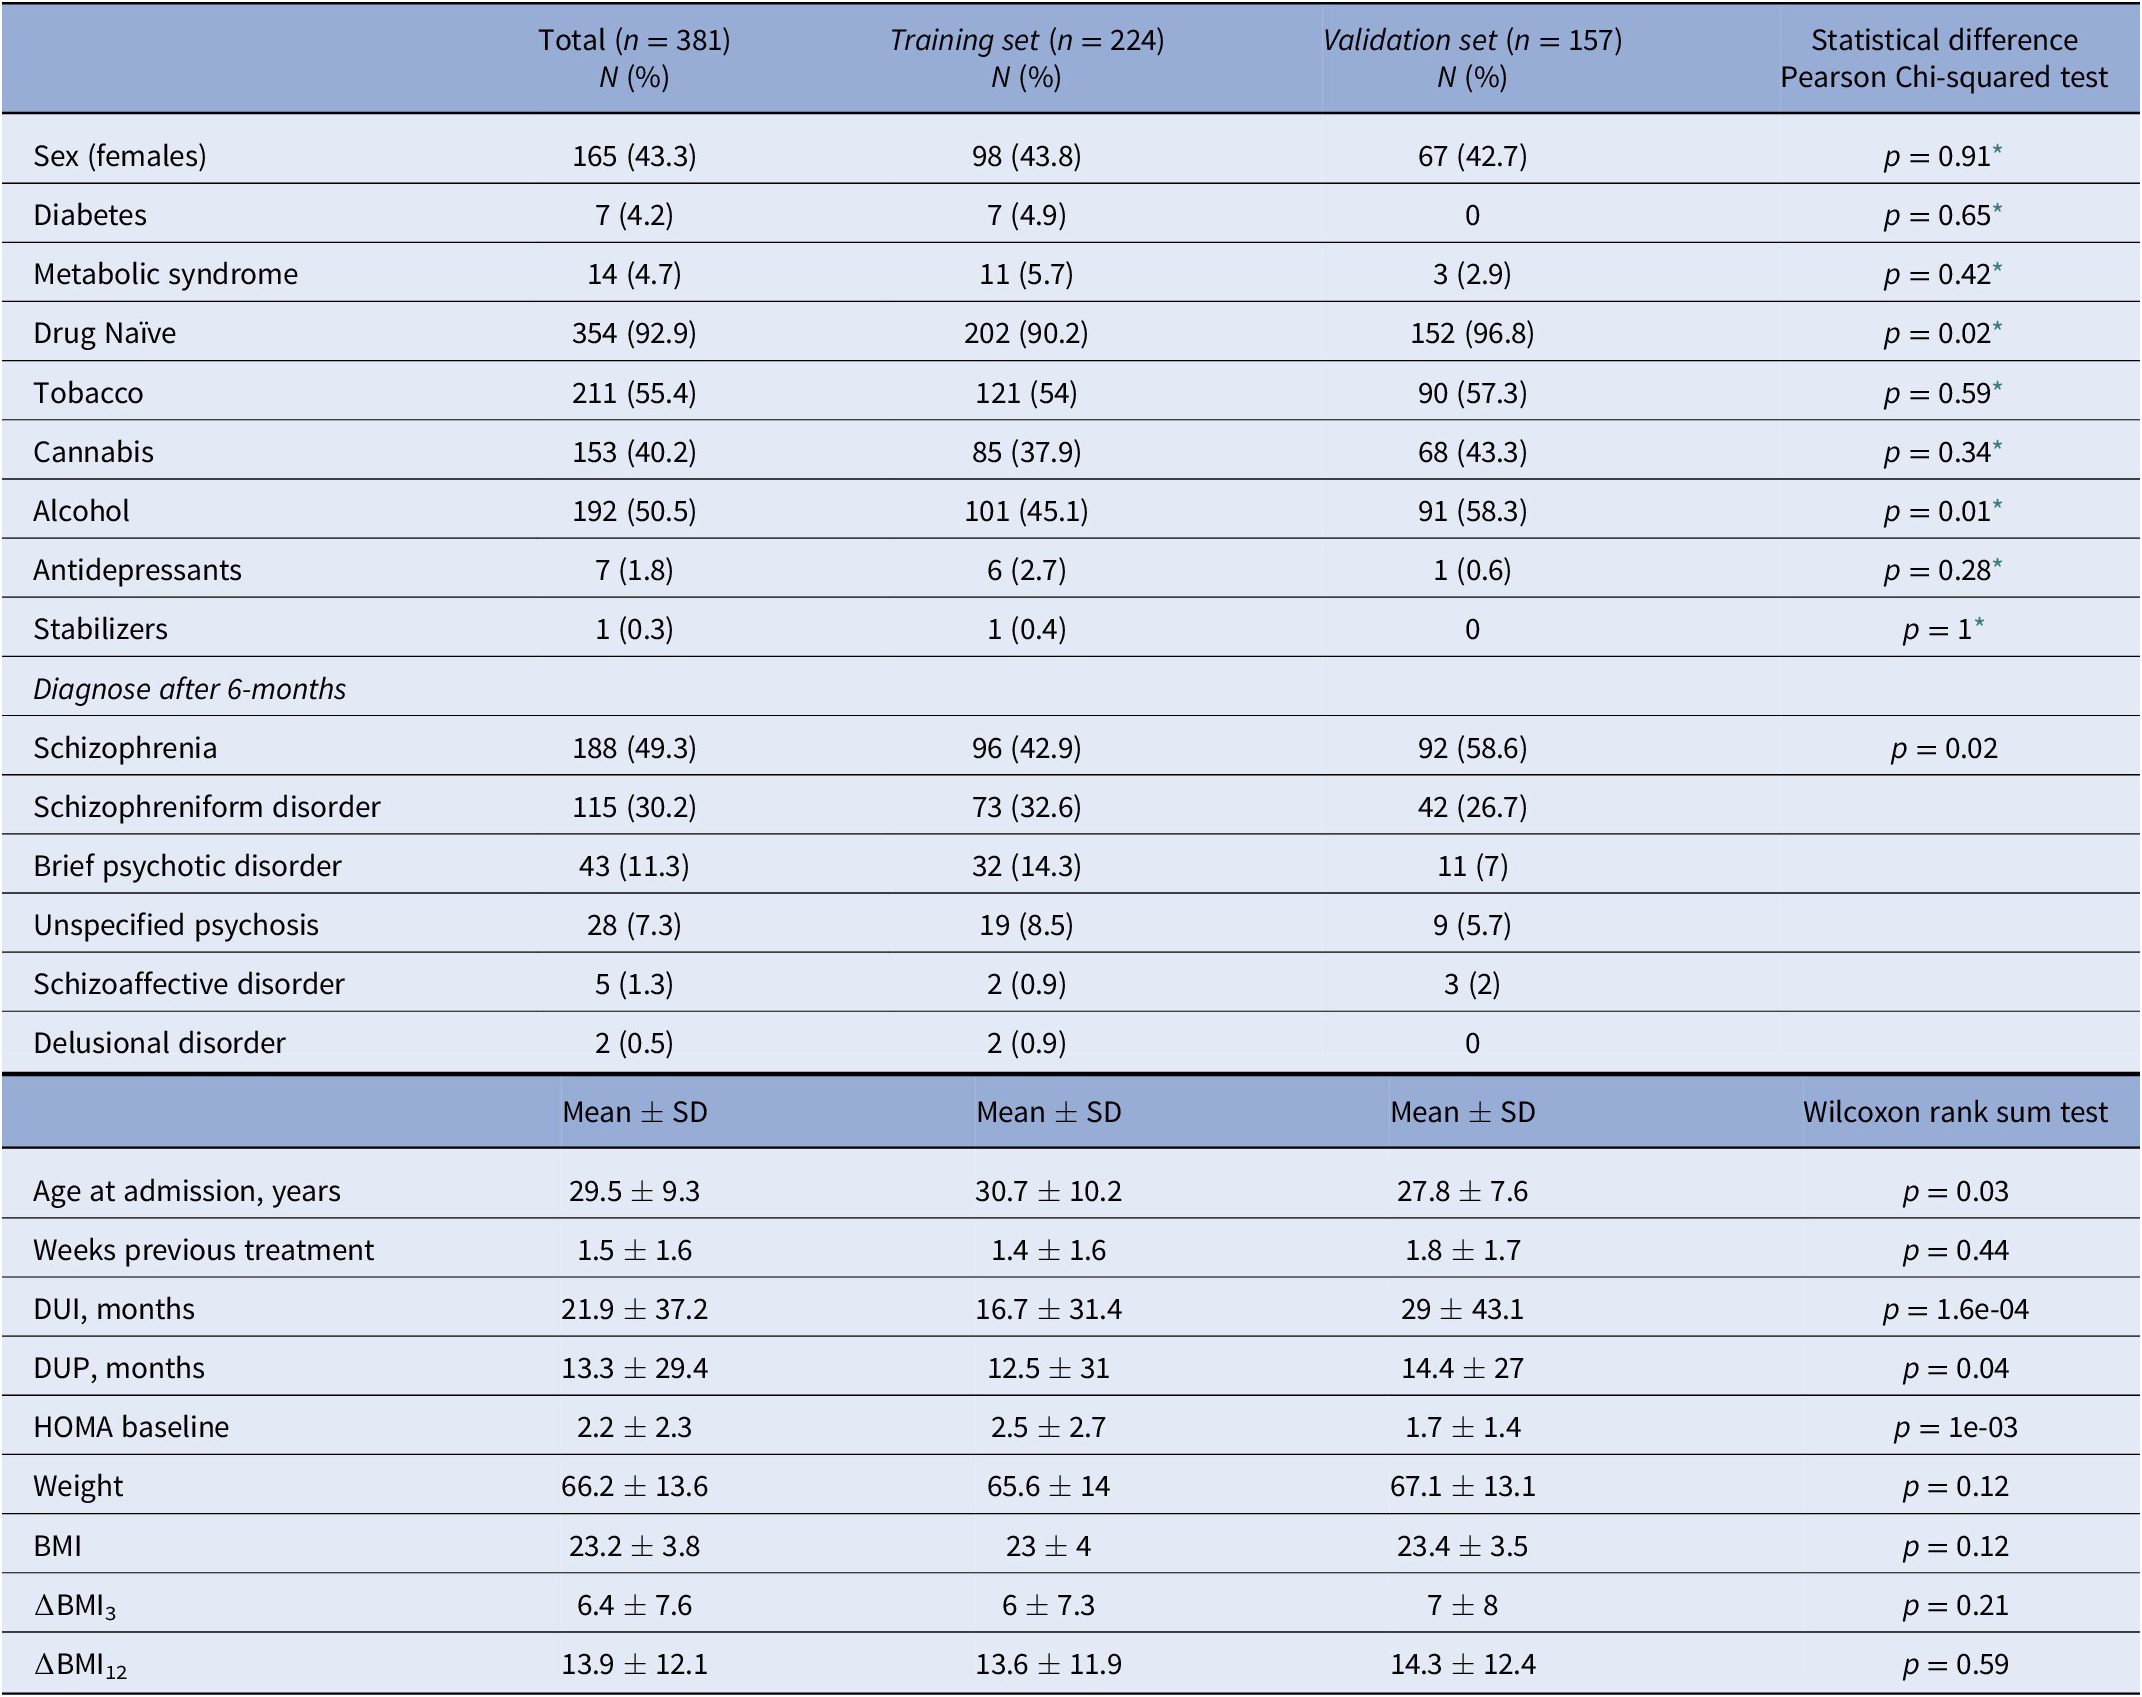
Abbreviations: DUI, duration of untreated illness; DUP, duration of untreated psychosis.
* Pearson’s Chi-squared test with Yates’ continuity correction.
Table 2. Number of participants in each treatment category at baseline and after 3 and 12 months of follow-up.
Samples and genotyping
For the present study, the PAFIP sample (n = 381) was divided into two independent patient datasets. Each of these datasets had been genotyped with a different platform. The first dataset (from now on Training set) included 224 patients and was used to determine the p-value threshold for PRSs, while a second sample (from now on Validation set) included 157 patients and was used for replication. In both datasets, DNA was extracted from peripheral lymphocytes, and genotyping was performed using the Affymetrix 6.0 platform (Training set) and the Illumina Infinium PsychArray (Validation set), respectively. Standard quality-control procedures [Reference Marees, de Kluiver, Stringer, Vorspan, Curis and Marie-Claire36] were performed with PLINK 1.9 [Reference Purcell, Neale, Todd-Brown, Thomas, Ferreira and Bender37], resulting in 6,910,431 SNPs in the Training set and 6,552,380 SNPs in the Validation set (Supplementary Material). Only those individuals with valid BMI measures were included (Supplementary Table S1). Finally, a PCA was performed on the resulting individuals and the top 10 PCs were kept for further analysis.
Pleiotropy analyses with GWAS data
GWAS summary statistics on BMI were obtained from Pulit et al. [Reference Pulit, Stoneman, Morris, Wood, Glastonbury and Tyrrell38], which comprised association analyses of a total of 806,834 European individuals. For SCZ, we obtained GWAS data on 67,390 patients and 94,015 controls, with 80% being of European ancestry [Reference Trubetskoy, Pardiñas, Qi, Panagiotaropoulou, Awasthi and Bigdeli1] (Supplementary Table S2). GWAS summary statistics were referenced to 9,546,816 SNPs generated from the 1,000 Genomes Project (1KGP). SNPs that were nonbiallelic, without rsIDs, duplicated, or with strand-ambiguous alleles were removed. We also filtered out SNPs with INFO scores < 0.9, those mapping to the extended major histocompatibility complex (MHC, chr6: 25,119,106–33,854,733), SNPs located on chromosomes X, Y, and mitochondria, and SNPs with sample sizes 5 standard deviations away from the mean. Finally, a common set of 1,949,409 SNPs were kept in the two datasets. ORs and betas were transformed into z-scores.
We used pleioFDR [Reference Andreassen, Djurovic, Thompson, Schork, Kendler and O’Donovan25] to identify genetic loci jointly associated with the two phenotypes, as previously described [Reference Muntané, Farré, Bosch, Martorell, Navarro and Vilella27] (Supplementary Material). SNPs jointly associated with BMI and SCZ (conj. FDR < 0.05) were mapped to genes with ANNOVAR [Reference Wang, Li and Hakonarson39]. Genelists were submitted to KOBAS-I [Reference Bu, Luo, Huo, Wang, Zhang and He40] to check for enrichment in biological categories and diseases; and to the GENE2FUNC option implemented in FUMA to check for tissue enrichment [Reference Watanabe, Taskesen, van Bochoven and Posthuma41]. All protein-coding genes were used as background and the Benjamini–Hochberg (BH) method was used for false discovery rate (FDR) correction.
To obtain the widest representation of the SNPs in the pleiotropic loci between SCZ and BMI, SNPs that were in r 2 > 0.1, distance < 250 kb, and MAF > 0.001 with each independent SNPs at conj. FDR < 0.05 were recovered with PLINK v1.9 from the CEU population of the 1 kG project. After this process, all the obtained SNPs were classified as pleiotropic SNPs. Nonpleiotropic SNPs were defined as all the SNPs in the original BMI GWAS that were not considered in any pleiotropic locus.
PRS estimation
PRSice 2.3.1.e was used to implement a pipeline in PRS creation [Reference Choi and O’Reilly42], using a two-step procedure as previously developed [Reference Khera, Chaffin, Aragam, Haas, Roselli and Choi43]. This avoids sample overlap between the Training and Validation sets and prevents test statistic inflation. First, PRSs were calibrated in the Training set using the GWAS on BMI [Reference Pulit, Stoneman, Morris, Wood, Glastonbury and Tyrrell38] as base data. Scores were calculated for multiple p-threshold cutoffs (from 5e-08 to 1 with increments of 5e-05) using r 2 = 0.1, 250-kb window, SNPs with INFO > 0.9, and excluding the MHC. Then, the optimal p-value (p optimal) threshold was determined as the one with the highest prediction for each phenotype. Sex, age, and the 10 first PCs were included as covariates (when evaluating ∆BMI, BMI0 was also included as a covariate). Second, SNPs below each obtained p optimal threshold were identified and carried forward for PRS computation in individuals of the Validation set.
Statistical analyses
First, Mann–Whitney and Kruskal–Wallis tests were used to assess differences in ∆BMI at 12 months (∆BMI12) based on clinical characteristics, use of antidepressants, and the AP drug described. Chi-squared tests were performed to evaluate differences between the Training and Validation sets.
To elucidate whether the PRSBMI were associated with the BMI in our dataset we carried out multiple linear regressions in the Validation set. We designed our analysis in three phases, first, we constructed linear models with the observed BMI12, ∆BMI3, and ∆BMI12 as the dependent variables, which combined only clinical and demographic variables. These models were referred to as Clinical models. They included as independent variables the 10 first PCs (to adjust for population stratification), sex, age, AP dose and the type of AP drug (at the corresponding time point), the diagnosis, tobacco smoking, and cannabis use. When the ∆BMI were evaluated, BMI0 was also included as a covariable. We also performed Clinical models with the whole dataset to determine each variable’s contribution in the BMI. Second, to examine the predictive ability of including genetic factors in the Validation set, the PRSBMI values obtained were subsequently incorporated into the previous models. Thus, we produced a series of absolute risk models with the observed BMI (or ∆BMI) as the dependent variable, and the covariates in the Clinical model plus the PRSBMI as independent variables, named PRS models. Third, we divided the genome-wide significant SNPs (p < 5e-08) from the BMI GWAS into pleiotropic and nonpleiotropic, using information from the pleioFDR analysis, to build additional PRS models which independently included PRS derived from pleiotropic (PRSpleio) and nonpleiotropic (PRSnonpleio) loci. In these cases, only SNPs that belonged to each category were included. Finally, we used the ANOVA() function to compare whether PRS models were significantly different from the Clinical models. All the analyses were performed in R 3.6.0 [44].
Since all the BMI measures were highly interrelated, a Bonferroni correction was considered too restrictive for the linear regression models. Instead, the alpha level was corrected by estimating the effective number of tests [Reference Derringer45]. In our study, the resulting significance threshold was set at p = 0.027.
Results
Characteristics of the whole dataset
A total of 381 patients were included in the entire dataset. Among them, 188 (49.3%) were diagnosed with schizophrenia, 115 (30.2%) with schizophreniform disorder, 43 (11.3%) with brief psychotic disorder, 28 (7.4%) with not otherwise specified psychosis, 5 (1.3%) with schizoaffective disorder, and 2 (0.5%) with delusional disorder (Table 1). At the end of the study, 89.2% of the patients had all BMI measures. None of the participants was initially treated with clozapine, which is indicated in treatment-resistant SCZ [Reference Kane, Agid, Baldwin, Howes, Lindenmayer and Marder46] (Table 2). A total of 354 patients (92.9%) were AP-naïve. The other 27 patients (7.1%) had been treated with AP prior to their inclusion in the study, although during a short period of time (mean 10.4 days, SD: 11.2 days; median 5 days; range: 1–42 days).
In the dataset, the mean ∆BMI3 and ∆BMI12 were 6.4 and 13.9%, respectively (Supplementary Figure S1). Most of the individuals displayed a positive ∆BMI12 (n = 312, 91.8%), while 25 individuals (7.4%) showed a negative ∆BMI12, and 3 individuals (<0.1%) had the same BMI0 and BMI12. In total, 108 patients in the Training set (48.2%) and 94 in the Validation set (59.9%) remained with the same AP drug during the study (Supplementary Figure S2). Both ∆BMI3 and ∆BMI12 were negatively correlated with BMI0 (p = 5.56e-10 and p = 7.07e-07) and positively correlated with each other (Supplementary Figure S3). In the whole sample, all APs were associated, on average, with a positive ∆BMI (Supplementary Figure S4). There were differences in ∆BMI12 between AP drugs among the individuals that did not switch AP drug during the study period (p = 1.9e-03), being olanzapine associated with a higher ∆BMI12. There were also differences in tobacco smokers versus nonsmokers (p = 0.01) and in cannabis users versus nonusers (p = 2.5e-03). However, ∆BMI12 was not associated with diabetes, metabolic syndrome, alcohol use, being AP drug naïve, or not having been prescribed antidepressants and mood stabilizers at baseline (Supplementary Figure S5). To reduce the number of variables in the models, only significant factors were incorporated into the subsequent prediction models.
Pleiotropy between SCZ and BMI
A total of 486 independent SNPs belonging to 449 near-independent genomic loci (r 2 < 0.1) were identified as being jointly associated with SCZ and BMI at conj. FDR < 0.05 (Figure 1A,B and Supplementary Table S3). Among them, 169 independent SNPs (Reference Gardner, Murphy, O’Donnell, Centorrino and Baldessarini35%) showed concordant relationships, where the alleles that confer risk for SCZ, also increase BMI. In addition, 317 independent SNPs (Reference van der Meer, Shadrin, O’Connell, Bettella, Djurovic and Wolfers65%) showed discordant links, in which the allele that increased SCZ-risk, had a BMI reduction effect (Figure 1C). This represented an approximate twofold ratio between discordant (antagonistic) and concordant (agonistic) pleiotropic variants that were conserved across significance thresholds (Supplementary Figure S6). Neither of the two groups of variants differed in their effect sizes in SCZ (p = 0.45) or BMI (p = 0.17), and nor in their minor allele frequency (p = 0.72).
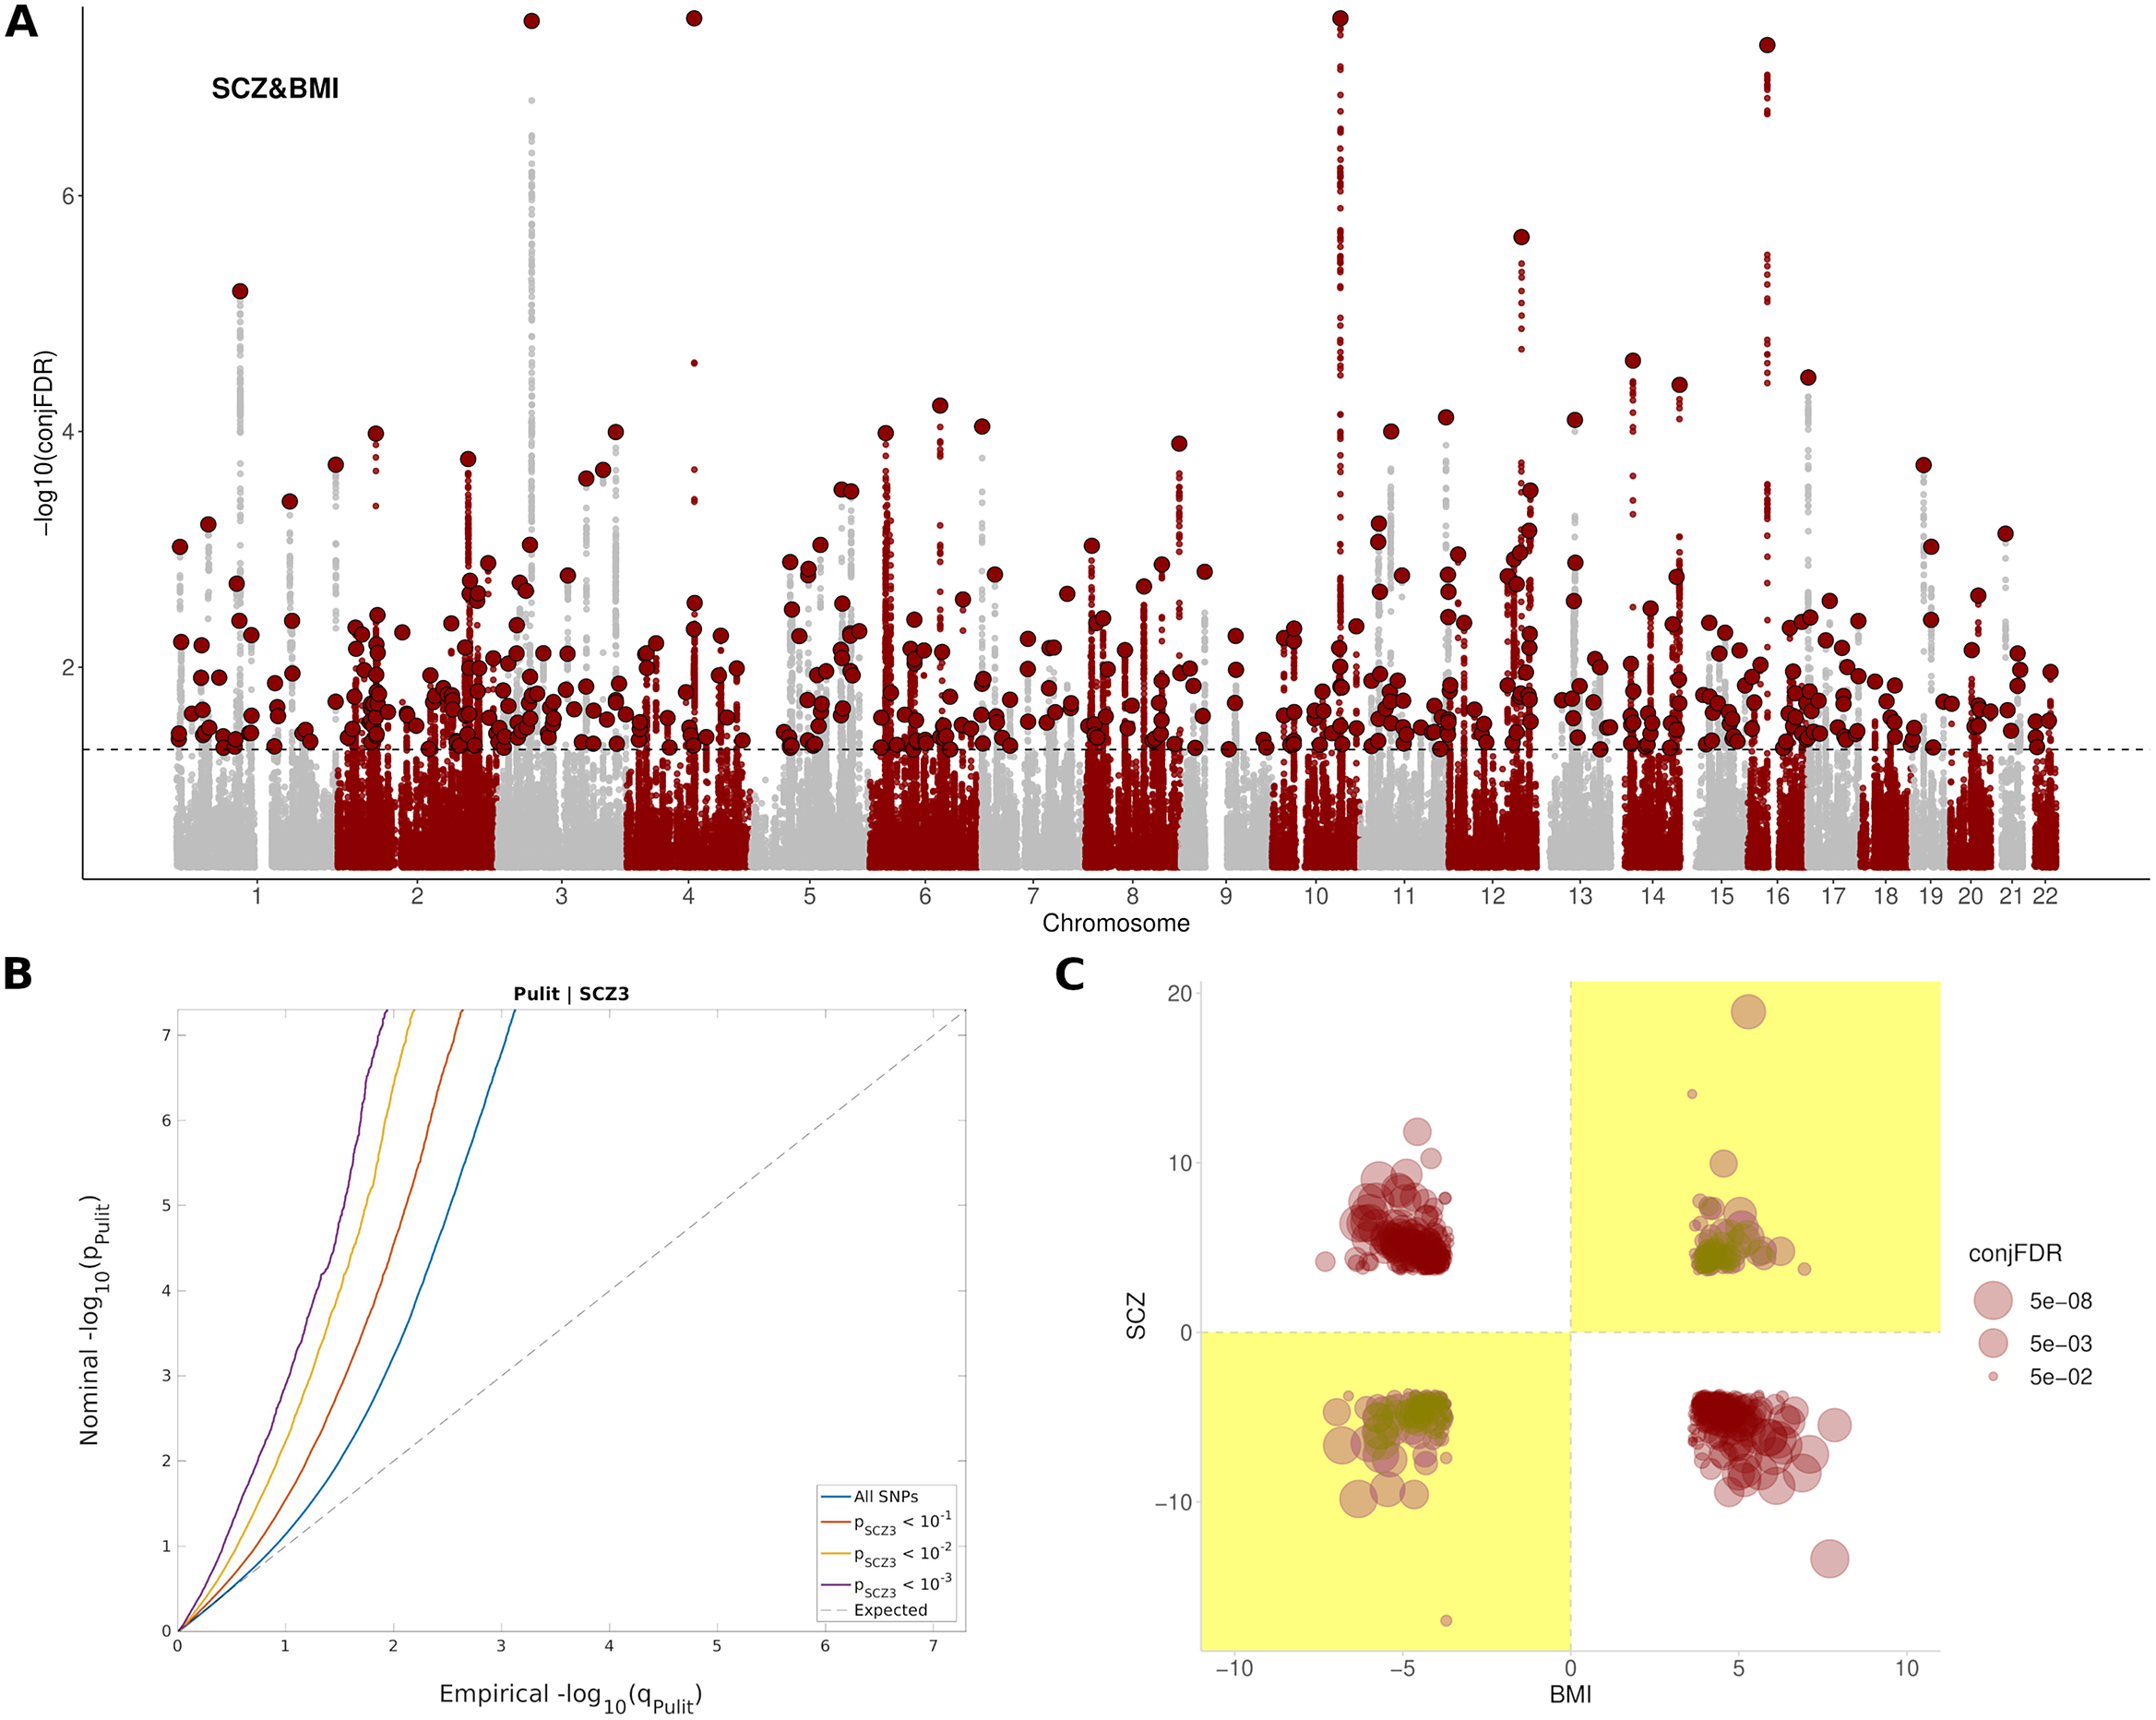
Figure 1. Pleiotropic variants between SCZ and BMI. (A) Manhattan plot showing independent (r 2 < 0.1) loci associated with both SCZ and BMI, as defined by conjunction false discovery rates (conj. FDR) after excluding SNPs in the MHC region. The dashed black line represents the conj. FDR threshold of 0.05. (B) Conditional Q–Q plots of nominal versus empirical (−log10) p-values (corrected for inflation) of BMI as a function of significance with SCZ, at the level of p < 10−1 (red line), p < 10−2 (yellow line), and p < 10−3 (purple line), respectively. The blue line indicates the standard enrichment of BMI including all SNPs, irrespective of their association with the secondary trait. The gray dashed line indicates the null distribution of p-values. (C) Pleiotropy plot for independent SNPs with conj. FDR < 0.05 (n = 486) between SCZ and BMI. The conj. FDR values and the direction of the effects (z-scores) of the minor alleles are plotted for BMI (x-axis) against SCZ (y-axis). Graph regions whose effects are consistent with a positive correlation between the two traits are shaded in yellow. (C) The ratio between discordant and concordant pleiotropic variants across different conj. FDR thresholds.
The set of SNPs shared between SCZ and BMI included 9,262 SNPs corresponding to 889 genes in total, enriched in Alcoholism (FDR = 5,15e-15), DNA methylation (FDR = 4,99e-14), DNA damage (FDR = 7,52e-13), cAMP signaling pathway (FDR = 2,45e-09), axon guidance (FDR = 1,06e-07), dopaminergic synapse (FDR = 2,99e-05), insulin resistance (FDR = 6,57e-03), and nervous system diseases (FDR = 7,58e-05), among others (Supplementary Table S4 and Supplementary Figure S7). These genes were differentially regulated in the brain; and were especially up-regulated in the frontal cortex, anterior cingulate cortex, putamen, amygdala, nucleus accumbens, and hippocampus (Supplementary Figure S8). A complete list of pathways enriched in both agonistic and antagonistic loci can be found in Supplementary Tables S5 and S6.
Risk models for BMI and ∆BMI
First, the Clinical models for BMI12 and ∆BMI12 were evaluated in the entire dataset. Variables associated with a higher BMI12 were male sex (p = 7.4e-05), being on haloperidol (p = 1.6e-04), olanzapine (p = 6.1e-03), risperidone (p = 6.8e-03), and quetiapine treatment (p = 0.03), and not consuming cannabis (p = 0.01, Supplementary Table S7). Among them, the major contributors to BMI12 were sex (4.5%), AP treatment (9.1%) and not being a cannabis user (1.7%, Figure 2A). On the other hand, variables associated with higher ∆BMI12 were reduced age (p = 0.01), low BMI0 (p = 2.4e-04), and AP treatment with paliperidone (p = 8.2e-03) and clozapine (p = 8.8e-03) at the 3-month follow-up (Supplementary Table S7). BMI0 contributed 3.8% to the total variance of ∆BMI12, AP treatment 8%, and age 1.8% (Figure 2B). When ∆BMI3 was included, it was the major contributor, accounting for 27.1% of ∆BMI12 variance (Figure 2C).
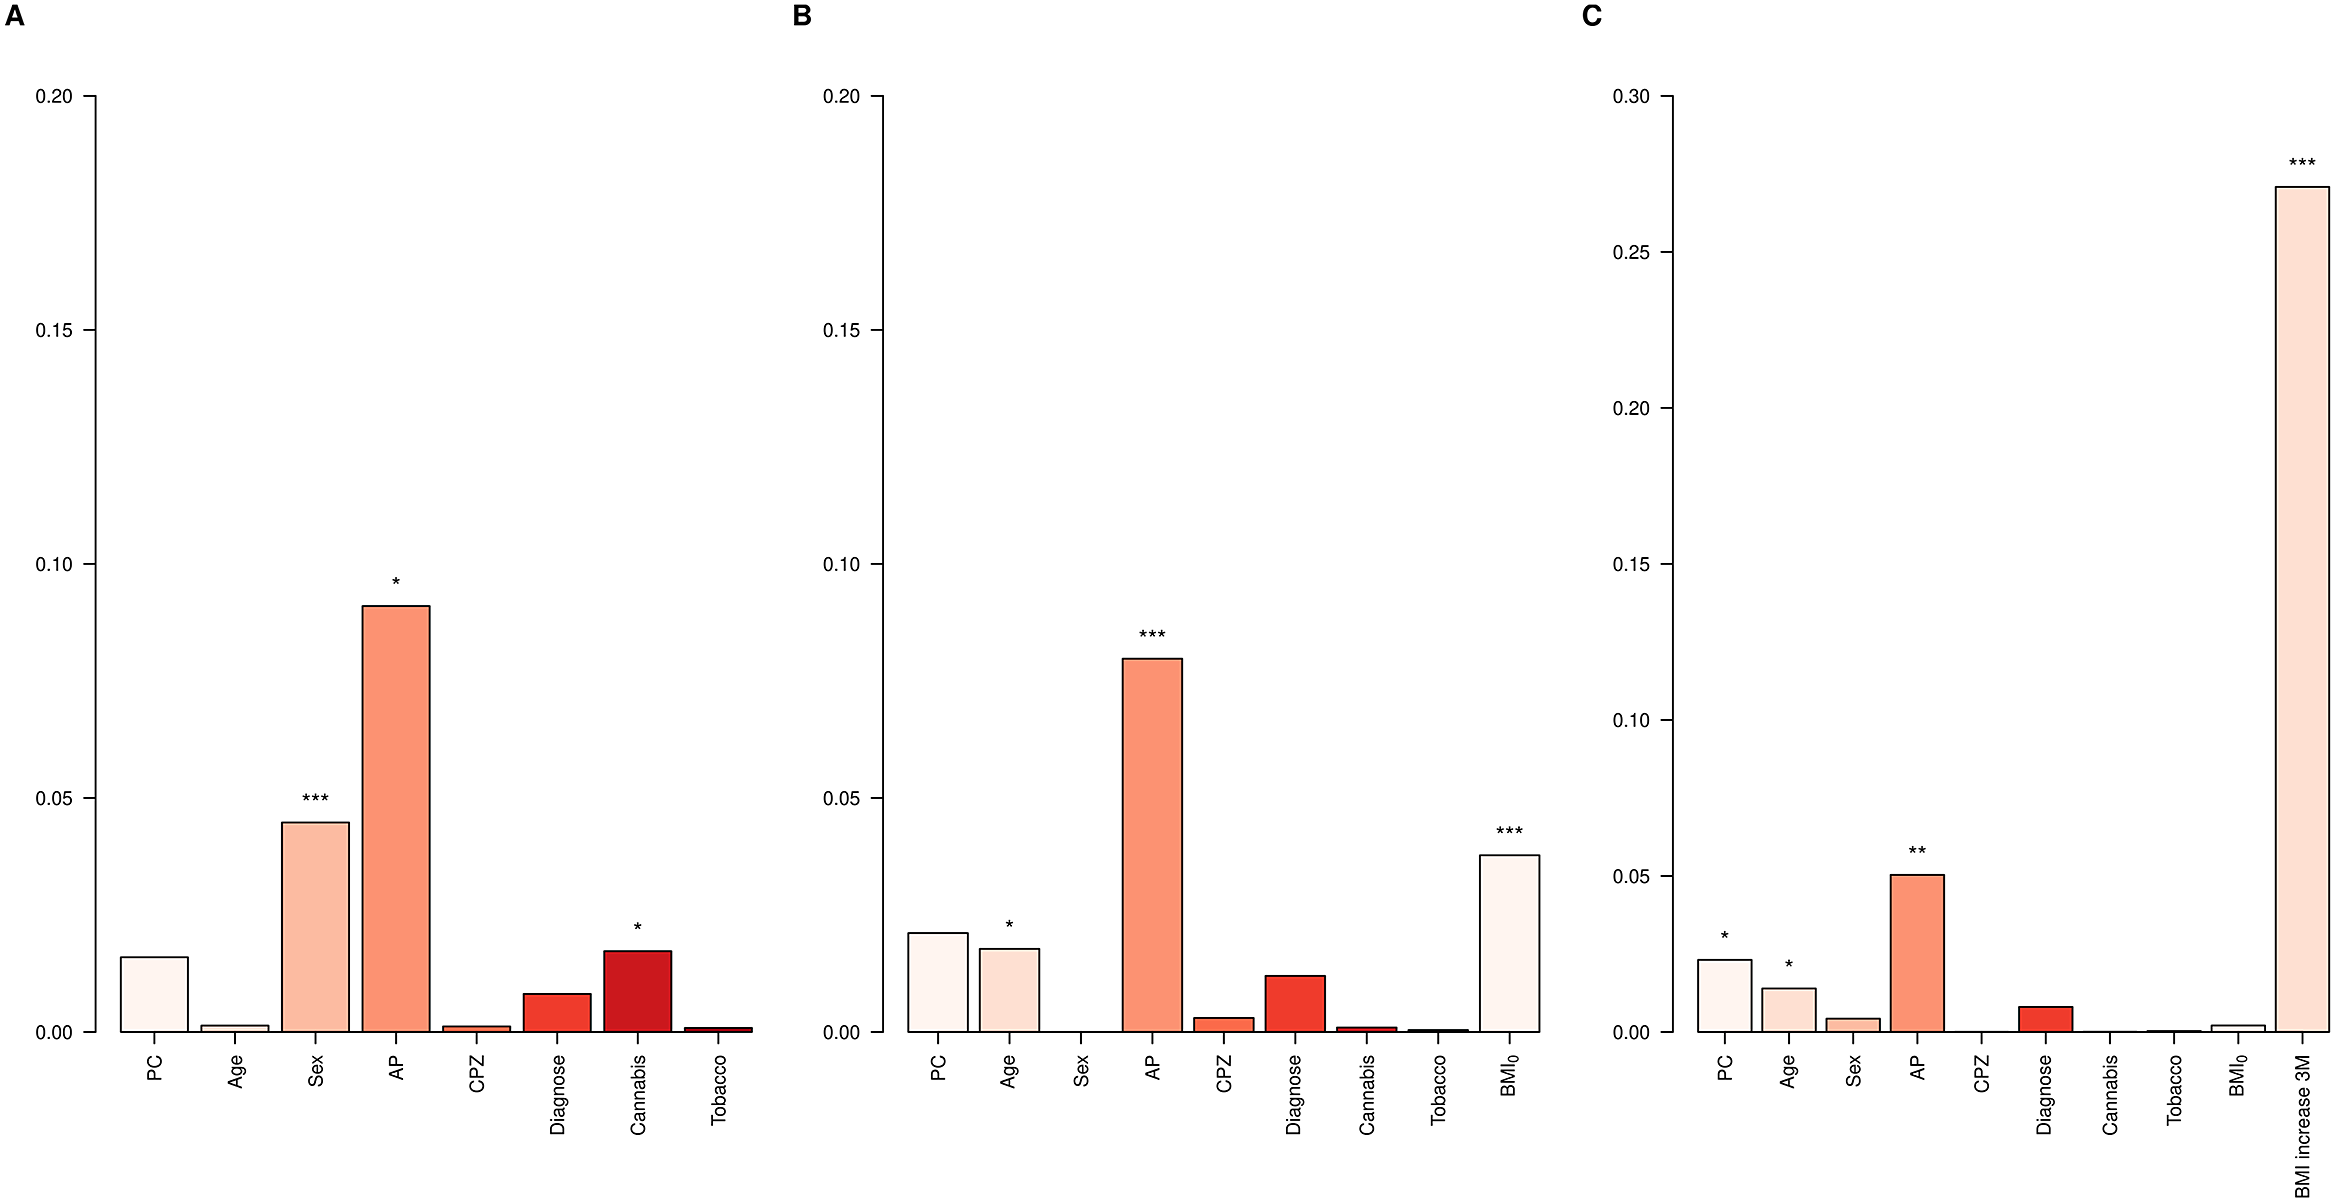
Figure 2. ∆BMI variance explained in the whole dataset. Bar plots showing the variance explained by each covariate in the Clinical models for (A) BMI12, (B) ∆BMI12, and (C) ∆BMI12 including ∆BMI3 in the model. AP, antipsychotic drug; CPZ, equivalent doses of chlorpromazine. *p-value < 0.05; **p-value < 0.01; ***p–value < 0.001.
To assess the performance of adding PRS in predicting BMI, the whole dataset was split into a Training set and a Validation set. The p optimal was brought forward to calculate PRSBMI in the Validation set and the scores were included into the PRS models for comparison against the Clinical models. For BMI12 the p optimal was established at 0.15 (Supplementary Table S8). The inclusion of the PRSBMI improved the Clinical model for BMI12 by 76% (p = 7.7e-04, Adj. R 2CLIN = 0.10, Adj. R 2PRS = 0.18, Figure 3 and Supplementary Table S9).
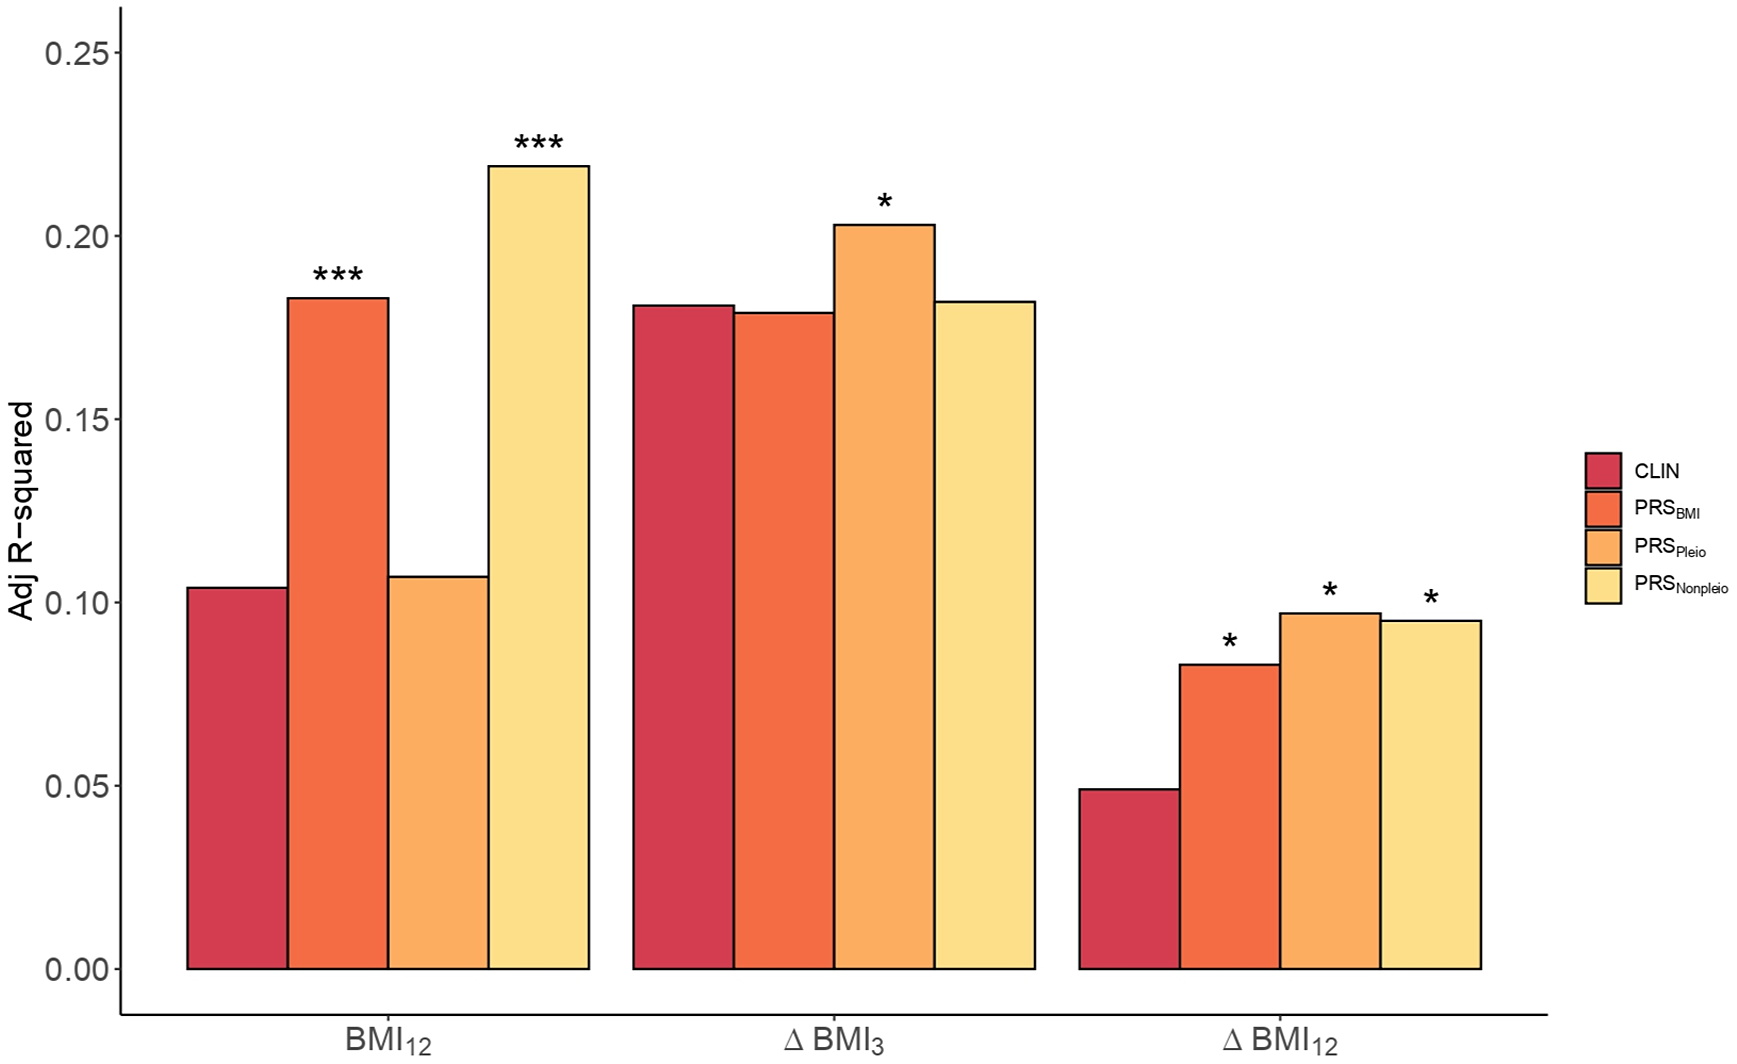
Figure 3. Clinical versus PRS models in BMI. Barplots showing the Adj. R 2 in BMI by the Clinical model (CLIN) and the PRS models computed using all SNPs from BMI GWAS (PRSBMI), pleiotropic SNPs (PRSPleio), and nonpleiotropic SNPs (PRSNonpleio) in the Validation dataset (n = 157). The barplot shows predictions of BMI12, ΔBMI3, and ΔBMI12 in the x-axis. Covariates included in the Clinical model were the first 10 PC, age, sex, AP drug prescribed, chlorpromazine equivalent doses, diagnose, tobacco smoking, and cannabis use. Each PRS model was compared to the performance of the corresponding Clinical model. Asterisks represent significantly improved models compared to the Clinical models (ANOVA). *p-value < 0.05; ***p–value < 0.001.
Next, we studied the inclusion of PRSBMI for predicting ∆BMI3 and ∆BMI12. The p optimal thresholds in the Training set were estimated at 2.2e-03 and 0.13, respectively (Supplementary Table S8). The percentage increase in the PRS models was 69.4% in ∆BMI12 (p = 0.02, Adj. R 2CLIN = 0.05; Adj. R 2PRS = 0.08), but not significant in ∆BMI3 (p = 0.39, Adj. R 2CLIN = 0.18; Adj. R 2PRS = 0.18, Supplementary Table S10).
Given the large extent of genetic pleiotropy between SCZ and BMI, we investigated whether these variants played a specific role in determining BMI and ∆BMI in our cohort. We obtained two PRSs based on pleiotropic (PRSpleio) and nonpleiotropic SNPs (PRSnonpleio, Supplementary Figure S9). The PRSpleio was not a significant predictor in determining absolute BMI12 (p = 0.26), as confirmed by the comparison of the PRS model including the PRSpleio (Adj. R 2Pleio = 0.11) compared to the Clinical model (Adj. R 2CLIN = 0.10, Figure 3). Instead, the PRSnonpleio showed an improvement in BMI12 higher than that of PRSBMI: 110.6% (Adj. R 2Nonpleio = 0.22, p = 5.3e-05). In contrast, including PRSpleio improved the ∆BMI12 model by 98% (p = 0.01, Adj. R 2CLIN = 0.05, Adj. R 2Pleio = 0.10, Figure 3), as well as the ∆BMI3 model by 12.2% (p = 0.04, Adj. R 2CLIN = 0.18, Adj. R 2Pleio = 0.20), indicating the role of the pleiotropic variants in weight increase. PRSnonpleio was not relevant for predicting ∆BMI3 (p = 0.28); however, it significantly improved ∆BMI12 by 93.9% (p = 0.01, Adj. R 2Nonpleio = 0.10). Finally, we classified the pleiotropic variants into agonistic and antagonistic to construct both agonistic PRSs (PRSago) and antagonistic PRSs (PRSantag). In predicting both ∆BMI3 and ∆BMI12, the PRSantag outperformed the PRSago (Supplementary Figure S10).
Discussion
Understanding the genetic vulnerability associated with increased BMI can be used to predict the risk of ∆BMI prior to treatment initiation so that personalized risk-based treatments can be implemented. In this study, we demonstrate for the first time, the replicable effects of a PRSBMI in predicting ∆BMI in FEP, with a prominent role of variants shared between SCZ and BMI.
In our study, BMI0 was inversely associated with ∆BMI3 and ∆BMI12, indicating that individuals with lower BMI0 were more likely to have higher ∆BMI during the first year of treatment [Reference Manu, Dima, Shulman, Vancampfort, De Hert and Correll47], which is in line with a previous study on an extended FEP cohort [Reference Canal-Rivero, Ruiz-Veguilla, Labad, Ayesa-Arriola, Vázquez-Bourgon and Mayoral-van Son48]. In the analyses of patients who did not switch AP, greater BMI gain was observed in patients treated with atypical AP, in accordance with previous studies [Reference Hugenholtz, Heerdink, Meijer, Stolker, Egberts and Nolen49, Reference Lieberman, Tollefson, Tohen, Green, Gur and Kahn50]. However, the effects varied greatly within medications, and interactions with underlying individual characteristics and genetic factors may be relevant [Reference Lett, Wallace, Chowdhury, Tiwari, Kennedy and Müller51].
Previous studies have proposed that the weight gain in psychosis is associated with the altered expression of genes related to both obesity and BMI [Reference Crespo-Facorro, Prieto and Sainz52], which suggests that there is a genetic overlap between these two medical conditions. Here, we confirm and extend with further data the shared genetic architecture between BMI and SCZ, involving pathways such as alcoholism (alcohol use disorder), DNA damage, DNA methylation, insulin resistance, and dopaminergic and glutamatergic synapses [Reference Bahrami, Steen, Shadrin, O’Connell, Frei and Bettella28], which are promising mechanisms for understanding weight gain in FEP. Alcohol intake can be a contributing factor to weight gain, probably by effects on central neurotransmitter systems to increase appetite [Reference Traversy and Chaput53], however, it has to be highlighted that alcohol use disorder was among the exclusion criteria for entering the PAFIP program. Specific DNA methylation signatures have been widely described to play a role in obesity and weight loss in humans [Reference Dick, Nelson, Tsaprouni, Sandling, Aïssi and Wahl54–Reference Tobi, Slieker, Luijk, Dekkers, Stein and Xu56]. There is also evidence pointing to the relevance of the glutamatergic system as a promising strategy to treat obesity [Reference Oliveira, Gonçalves, Oliveira, de Oliveira, Reis and Ferreira57]. In addition, weight gain associated with clozapine may be linked to antagonism of the histaminergic H1 receptors, increasing the risk of insulin resistance and type 2 diabetes [Reference Guest and Guest58]. The pleiotropic variants between the two traits belong to genes that are up-regulated in the frontal and anterior cingulate cortices, the putamen, amygdala, nucleus accumbens, and hippocampus, which suggests that these areas play a relevant role in weight increase associated with SCZ. For instance, dopamine has been considered to be the target responsible for the efficacy of AP and also to be involved in feeding behavior, and the accumbens is considered to be the brain area with an increased release of dopamine [Reference Panariello, De Luca and de Bartolomeis59]. In fact, nucleus accumbens microstructure can be used to predict weight increase in children [Reference Rapuano, Laurent, Hagler, Hatton, Thompson and Jernigan60]. Similarly, hippocampus size has been discovered to be a predictor for change in BMI in FEP [Reference Luckhoff, du Plessis, Kilian, Asmal, Scheffler and Phahladira61].
A recent study in FEP found no association between psychopathological PRS with metabolic progression, including BMI [Reference Segura, Martínez-Pinteño, Gassó, Rodríguez, Bioque and Cuesta62]. However, in the present study, we demonstrate the role of underlying genetics in both BMI and ∆BMI in FEP patients. Including PRSBMI ostensibly improved the prediction of BMI at 12 months of treatment. This is not surprising, as the role of genetics in BMI in the general population is already known [Reference Khera, Chaffin, Wade, Zahid, Brancale and Xia31]; however, this is the first time it is also validated in FEP individuals under AP treatment. Notably, we report for the first time, that the inclusion of PRSBMI also improved the prediction of mid-term ∆BMI, which may have important consequences in identifying FEP patients at high risk for weight gain. Strikingly, including PRSpleio improved both risk models of ∆BMI12 and ∆BMI3, although containing a much lower number of SNPs. Remarkably, ∆BMI12 was strongly predicted by ∆BMI3 (explaining almost 30% of its variance). This result emphasizes that clinicians should focus on the early weeks of treatment to prevent long-term weight gain [Reference Kinon, Kaiser, Ahmed, Rotelli and Kollack-Walker63], also reinforcing the benefits of including pleiotropy information for early detection of BMI increase in FEP. In contrast, the genetic architecture of BMI not shared with SCZ (PRSnopleio) played a pivotal role in controlling BMI. Our results are in line with recent data showing that incorporating pleiotropic information improves prediction by capturing biological mechanisms shared between traits [Reference Loika, Irincheeva, Culminskaya, Nazarian and Kulminski64, Reference van der Meer, Shadrin, O’Connell, Bettella, Djurovic and Wolfers65]. Moreover, opening the door to applying it to the study of comorbidity between a priori independent traits. Our results also indicate that antagonistic variants (those that have opposite directions between BMI and SCZ) play a greater role in ∆BMI. However, it could be simply a matter of statistical power as more SNPs were recovered in this category.
This study has one main strength: it is based on independent longitudinal and prospective cohorts of well-characterized drug-naïve FEP patients in which different types of AP medication were considered. However, our work has some limitations; first, we could not control for well-known factors that contribute to BMI changes, such as diet and physical activity [Reference Firth, Stubbs, Teasdale, Ward, Veronese and Shivappa66, Reference Vancampfort, Firth, Schuch, Rosenbaum, Mugisha and Hallgren67]. Secondly, the interpretation of the results could also be skewed by the fact that FEP patients often switch AP treatment during follow-up, and are sometimes treated with a secondary AP, which have a possible impact on BMI [Reference Correll, Rummel-Kluge, Corves, Kane and Leucht68]. It is noteworthy that the two datasets do not have the same distribution of AP treatments. Although this may imply a bias when the results between AP drugs are compared, it also reinforces the role of genetics in ∆BMI given its replicability in sets of individuals with different treatments. Also, the fact that GWAS of SCZ contained a 20% non-European sample may have slightly biased the calculation of pleiotropic regions and, in turn, the pleiotropic PRS. Finally, the predictive power we obtain with a small population (N < 200) is relatively low (Adj. R 2 ~ 0.1–0.2), but is fully comparable to that of other studies with much larger cohorts [Reference Krapohl, Patel, Newhouse, Curtis, von Stumm and Dale32, Reference Hüls, Wright, Bogl, Kaprio, Lissner and Molnár69–Reference Murthy, Xia, Baldridge, Carnethon, Sidney and Bouchard71]. Further research with larger cohorts and including populations of non-European ancestry is needed to better understand this relationship and to develop effective interventions to address the issue of weight gain in people with FEP.
In summary, our findings highlight that genetics is an important factor in determining the BMI trajectory in patients with FEP, paving the way for its inclusion in the clinical routine in order to identify individuals at higher risk, and to optimize individualized prevention programs to improve patients’ quality of life. In turn, our results lay the groundwork for addressing the prediction of comorbid trajectories in other diseases using a similar approach.
Supplementary Materials
To view supplementary material for this article, please visit http://doi.org/10.1192/j.eurpsy.2023.9.
Data Availability Statement
The datasets used in the current study are available from the authors upon request.
Author Contribution
GM conceived and designed the study. GM and JV-B collected the data. GM conducted the analyses with support from ES and JV-B. GM drafted the manuscript and all co-authors provided critical suggestions. All authors contributed to the interpretation of the findings, read and accepted the final version of the manuscript for submission.
Financial Support
This work was supported by the Catalan Agency of Research and Universities (AGAUR, 2017SGR-00444, PI: E.V.). G.M. is supported by Instituto de Salud Carlos III (PI18/00514 and PI21/00612). The Santander (PAFIP) cohort was funded by the following grants: Instituto de Salud Carlos III (FIS00/3095, PI020499, PI050427, PI060507), Plan Nacional de Drogas Research (2005-Orden sco/3246/2004), SENY Fundatio Research (2005-0308007), Fundacion Marques de Valdecilla (A/02/07, API07/011), and MINECO/FEDER (SAF2016-76046-R, SAF2013-46292-R). J.V.-B. is supported by funding from Instituto de Investigación Valdecilla (INT/A21/10, INT/A20/04). A.N. is supported by funding from AEI-PGC2018-BI00 (FEDER/UE) (MINECO/FEDER, UE), “Unidad de Excelencia María de Maeztu,” funded by the AEI (CEX2018-000792-M), Secretaria d’Universitats i Recerca, and the CERCA Program of the Departament d’Economia i Coneixement de la Generalitat de Catalunya (GRC 2017 SGR 880).
Conflict of Interest
B.C.-F. has received honoraria (advisory board and educational lectures) and travel expenses from Takeda, Menarini, Angelini, Teva, Otsuka, Lundbeck, and Johnson & Johnson. He has also received unrestricted research grants from Lundbeck. J.V.-B. has received honoraria for his participation as a consultant and/or a speaker at educational events from Janssen-Cilag and Lundbeck. The rest of the authors report no biomedical financial interests or potential conflicts of interest.


 Open access
Comments
No Comments have been published for this article.