

Several extinct South American native ungulate lineages evolved within the geographical context of isolation during most of the Cenozoic. Amongst them, Notoungulata constitutes the most abundant and diverse clade, both taxonomically and morphologically (Simpson Reference Simpson1936; Patterson & Pascual Reference Patterson, Pascual, Keast, Erk and Glass1972; Bond Reference Bond1986; Cifelli Reference Cifelli, Szalay, Novacek and Mckenna1993; Croft Reference Croft and Singer1999). Following Billet (Reference Billet2010), the clade comprises two main monophyletic groups, Toxodontia and Typotheria, plus some basal notoungulate families. During the Santacrucian Age (Santa Cruz Formation, Early Miocene of Patagonia), the notoungulates were very diverse (Fig. 1), with three genera of Toxodontia (Nesodon and Adinotherium (Toxodontidae, Nesodontinae) and Homalodotherium (Homalodotheriidae)) and four genera of Typotheria (Interatherium and Protypotherium (Interatheriidae) and Hegetotherium and Pachyrukhos (Hegetotheriidae)). Cassini et al. (Reference Cassini, Cerceño, Villafañe, Muñoz, Vizcaíno, Kay and Bargo2012a) provided an extensive description of the diversity of all Santacrucian native ungulates in a bounded geographic and stratigraphic context. Their remains are particularly interesting for palaeobiological studies, due to their richness and the availability of specimens with fine quality preservation. In the past decade, there have been several studies trying to shed light on the palaeobiology of South American ungulates. They dealt with body mass estimations (Croft Reference Croft2001; Scarano et al. Reference Scarano, Carlini and Illius2011; Cassini et al. Reference Cassini, Vizcaíno and Bargo2012b; Elissamburu Reference Elissamburu2012); ecomorphological characterisations (Elissamburu Reference Elissamburu2004, Reference Elissamburu2010; Croft & Anderson Reference Croft and Anderson2008; Cassini et al. Reference Cassini, Mendoza, Vizcaíno and Bargo2011, Reference Cassini, Cerceño, Villafañe, Muñoz, Vizcaíno, Kay and Bargo2012a; Cassini Reference Cassini2013; Giannini & García-López Reference Giannini and García-López2014); teeth wear and durability (Townsend & Croft Reference Townsend and Croft2008; Billet et al. Reference Billet, Blondel and de Muizon2009; Reguero et al. Reference Reguero, Candela, Cassini, Madden, Carlini, Vucetich and Kay2010); biomechanical performance of the masticatory apparatus (Cassini & Vizcaíno Reference Cassini and Vizcaíno2012); and digestion physiology (Scarano et al. Reference Scarano, Carlini and Illius2011; Cassini et al. Reference Cassini, Cerceño, Villafañe, Muñoz, Vizcaíno, Kay and Bargo2012a).
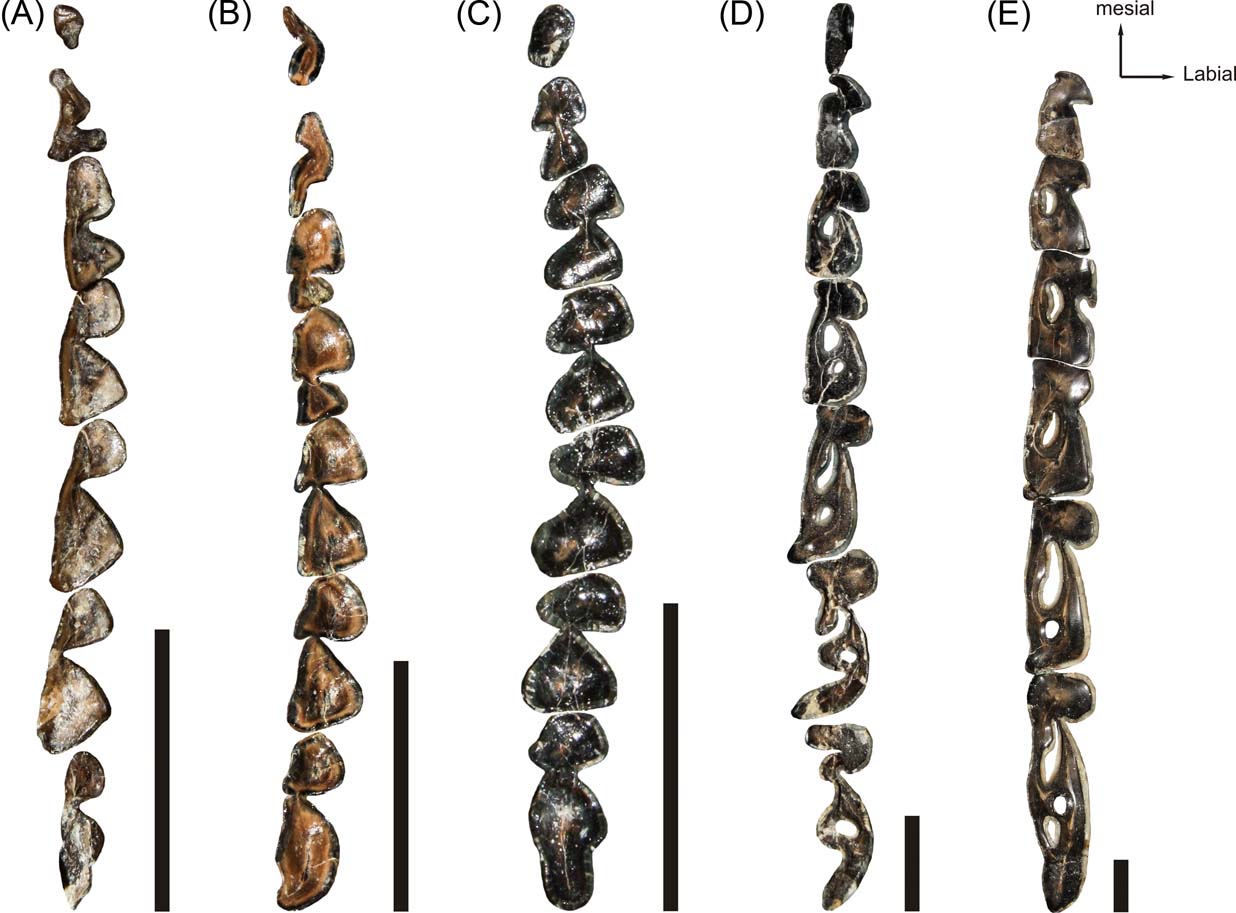
Figure 1 Santacrucian notoungulate, right side lower tooth rows (except where indicated): (A) Hegetotherium mirabile, MPM-PV 3481; (B) Protypotherium praerutilum, MPM-PV 3530 (left side reversed); (C) Interatherium robustum MPM-PV 3528; (D) Adinotherium ovinum, MPM-PV 3667; (E) Nesodon imbricatus, MPM-PV 3659. Scale bars = 10 mm.
Much research has focused on the relationship between mammalian dental morphology (i.e., size, shape and wear) and habitat and trophic characterisations (Ungar & Williamson Reference Ungar and Williamson2000). In herbivorous forms particularly, this was achieved by the study of tooth crown height (hypsodonty), tooth occlusal surface area and complexity, and body mass.
The height of the tooth crown is one of the morphological features that has been of most interest for palaeobiologists, and the South American fauna is the oldest one in the world dominated by hypsodont herbivores (Flynn & Wyss Reference Flynn and Wyss1998; Flynn et al. Reference Flynn, Wyss, Croft and Charrier2003). Hypsodonty has been frequently considered as indicative of grass consumption in ungulates, and correlated with the spread of grass land habitats (see Patterson & Pascual Reference Patterson and Pascual1968 and Madden Reference Madden2015 for South America; and Janis Reference Janis and Thomason1995, MacFadden Reference MacFadden2000, Strömberg Reference Strömberg2006 and Strömberg et al. Reference Strömberg, Werdelin, Friis and Saraç2007 for central North America and western Eurasia). Van Valen (Reference Van Valen1960) provided the first quantitative approach to these relationships, defining a hypsodonty index (HI); but it was not until the late 1980s that a comparative study by Janis (Reference Janis, Russell, Santoro and Sigogneau-Russell1988) tested the relation to grass consumption in living ungulates, hyraxes and the African elephant. Although she found a positive correlation between HI and percentage of grass in diet, further research (Janis Reference Janis and Thomason1995) led this author to conclude that HI better indicates open-habitat environmental preference rather than grass consumption in extinct ungulates. Williams & Kay (Reference Williams and Kay2001) found that tooth crown height in rodents and ungulates was positively correlated with the proportion of monocots (primarily grass) in the diet, and negatively correlated with foraging height preferences. Mendoza & Palmqvist (Reference Mendoza and Palmqvist2008) indicated that, in extant ungulates, there is no direct relationship between the degree of hypsodonty and the amount of grass consumed, except for the correspondence between grazing and dwelling in open habitats. The significance of hypsodonty in this context is that it prolongs the life of teeth in herbivores which deal with abundant abrasives, such as silica-rich grasses and wind-blown dust, in these open, arid habitats.
The appearance of a large number of hypsodont notoungulates occurred sometime between 36 Ma and 32 Ma (Late Eocene–Early Oligocene) (Kay et al. Reference Kay, Madden, Vucetich, Carlini, Mazzoni, Re, Heizler and Sandeman1999). Hypsodonty developed in six notoungulate families – notohippids, toxodontids, interatheriids, mesotheriids, archaeohyracids and hegetotheriids – and may correspond to three or more independent acquisitions (Croft & Weinstein Reference Croft and Weinstein2008). Strömberg et al. (Reference Strömberg, Dunn, Madden, Kohn and Carlini2013) found that the earliest grass-dominated habitat was established in Patagonia sometime after 18.5 Ma, and not at 40 Ma as proposed by Zucol et al. (Reference Zucol, Brea, Bellosi, Madden, Carlini, Madden, Carlini, Vucetich and Kay2010). Consequently, Strömberg et al. (Reference Strömberg, Dunn, Madden, Kohn and Carlini2013) rejected the hypothesis that the early evolution of hypsodonty in southern South America was driven by the spread of grasslands, and concluded that grass dominance and openness of vegetation are not necessary pre-conditions for favouring high-crowned dentition. However, they stated that it is still likely that environmental abrasiveness was the ultimate trigger for the evolution of hypsodonty.
Cassini et al. (Reference Cassini, Mendoza, Vizcaíno and Bargo2011) generated inferences about habitat and feeding preferences in an assemblage of Santacrucian notoungulates (Early Miocene, 16–17 Ma), using classic morphometrics and novel computer techniques of knowledge discovery. Although these authors warn about the shape differences amongst lineages, their results are mostly driven by the hypsodonty index. The results suggest that all Santacrucian notoungulates have morphologies characteristic of ‘open habitat’ extant ungulates, in agreement with classical ideas (Scott Reference Scott1937; Patterson & Pascual Reference Patterson and Pascual1968; Tauber Reference Tauber1996; Madden Reference Madden, Kay, Madden, Cifelli and Flynn1997). More recently, using 3D morphometrics, Cassini (Reference Cassini2013) found parallel mandibular shape characteristics related to HI between those herbivorous forms with incisor-like canines and those with well-developed canines or incisors. Extant brachyodont ungulates from closed habitats show a more elongated and narrower mandibular symphysis, with a lower mandibular corpus, than that of hypsodont, open habitat species. Therefore, in addition to extending the tooth life functionality, a high crown seems to be related to mandibular shape.
Several authors have found that amongst ungulates and kangaroos, grazers have a cheek teeth occlusal surface area (OSA; Pérez-Barbería & Gordon Reference Pérez-Barbería and Gordon1998a) larger than that of browsers, using as a proxy a simple product of tooth length multiplied by width (Janis Reference Janis, Turner and Thulborn1990, Reference Janis and Thomason1995; Janis & Constable Reference Janis and Constable1993; Pérez-Barbería & Gordon Reference Pérez-Barbería and Gordon2001; Mendoza et al. Reference Mendoza, Janis and Palmqvist2002). In addition, Janis (Reference Janis, Russell, Santoro and Sigogneau-Russell1988) stated that perissodactyls (monogastric forms) have longer molarised premolar rows than artiodactyls (ruminant). Later, Janis & Constable (Reference Janis and Constable1993) and Janis (Reference Janis and Thomason1995) proposed that these differences are related to different alimentary strategies in relation to the physiology of digestion. For example, horses spend more time chewing, and also chew more than cows (ruminants) when they eat high-fibre-content food. In addition, OSA was assumed to be directly correlated with the quantity of food trapped between tooth rows and, therefore, a large OSA will also increase the amount of food fragments cut or ground per chewing cycle (Pérez-Barbería & Gordon Reference Pérez-Barbería and Gordon1998b and references therein).
Following these ideas, Vizcaíno et al. (Reference Vizcaíno, Bargo and Cassini2006, Reference Vizcaíno, Cassini, Fernicola and Bargo2011) refined the methodology to measure the occlusal surface area, taking into account the tooth infolding instead of using a rectangular box as a proxy. They evaluated this dental feature in a reference sample of herbivorous mammals and the extinct hypsodont xenarthrans. These authors agreed with Janis' statements mentioned above (Janis & Constable Reference Janis and Constable1993; Janis Reference Janis and Thomason1995) and concluded that OSA is strongly correlated with body mass (but is also a useful measure of the capacity to process food in the oral cavity) and, indirectly, is correlated with some aspects of feeding physiology and metabolism. Later, Cassini et al. (Reference Cassini, Cerceño, Villafañe, Muñoz, Vizcaíno, Kay and Bargo2012a) applied the same approach to the Santacrucian ungulates and proposed that Litopterna and Notoungulata parallel the relationships between the perissodactyls and artiodactyls (i.e., litopterns have a relatively larger OSA than that of notoungulates and, consequently, more efficient intraoral food processing and perhaps not as good digestive capabilities). Amongst Notoungulata, Toxodontia tend to have greater OSA than that predicted for an herbivorous mammal of the same body mass, whilst Typotheria tend to have lower values. Recently, applying the same method as Vizcaíno et al. (Reference Vizcaíno, Bargo and Cassini2006) and Cassini et al. (Reference Cassini, Cerceño, Villafañe, Muñoz, Vizcaíno, Kay and Bargo2012a), Famoso et al. (Reference Famoso, Feranec and Davis2013) evaluated each tooth separately (the “true occlusal tooth area”) in a broader extant ungulate sample and in a phylogenetic context, and arrived at similar conclusions.
More recently, there has been some interest in the study of enamel crest length and complexity, its relation with the HI, and its value for the inference of diet and feeding behaviour in extinct ungulates. Using fractal dimension, Candela et al. (Reference Candela, Cassini and Nasif2013) quantified the enamel crest complexity (ECC) of a gigantic hypsodont dynomid rodent to evaluate chewing efficiency. Famoso et al. (Reference Famoso, Feranec and Davis2013) measured the occlusal enamel length (OEL) in ungulate teeth, finding that it was constrained by the occlusal tooth area and diet. They also proposed an occlusal enamel index (OEI), defined as the ratio between enamel length and the square root of occlusal area, to evaluate the component of enamel length determined by abrasiveness of ingested material reducing the effect of body mass.
Some authors have attempted to evaluate how tooth crown height (HI), occlusal surface area (OSA) and enamel crest complexity (ECC) relate to each other. For example, Vizcaíno et al. (Reference Vizcaíno, Bargo and Cassini2006) analysed xenarthran cingulates (pampatheres vs. glyptodonts), and suggested that the less complex tooth lobation, but larger OSA, in pampatheres could be a consequence of a balance in which a reduction in one feature is compensated by an increase in the other. Reguero et al. (Reference Reguero, Candela, Cassini, Madden, Carlini, Vucetich and Kay2010) suggested that in typotheres, the occlusal design plays an important role in the relationship between hypsodonty and body mass (BM), and that these three factors form a complex of characters. Candela et al. (Reference Candela, Cassini and Nasif2013) proposed that chewing efficiency of the dynomid rodent could be functionally more related to ECC than hypsodonty. These authors remarked that the relationship of ECC and hypsodonty with factors such as teeth effectiveness, food physical attributes and the ingestion of soil particles, remains elusive. Famoso et al. (Reference Famoso, Feranec and Davis2013) found that OEL alone was useless for determining feeding strategies. They also proposed that a further examination of the fractal dimension would remove the effects of body size from studies of tooth complexity. Later, Famoso et al. (Reference Famoso, Davis, Feranec, Hopkins and Price2016) tested the value of OEI, HI and phylogeny combined, to characterise feeding behaviour in extant ungulates. They found that although diets of extant ungulates are significantly related to each of these traits independently, there is no clear evolutionary connection between HI and OEI.
The goal of this work is to further explore the relationships between HI, OSA, ECC (as a fractal dimension) and BM, by studying a set of specimens of South American native notoungulates that lived in Patagonia at the same time as the earliest grass-dominated habitats were already established.
1. Materials and methods
1.1. Specimens
The following samples, housed at the Museo Regional Provincial Padre M. J. Molina, Paleontología Vertebrados (MPM-PV), Río Gallegos, Argentina, represent the notoungulates recorded in a constrained set of localities in the lower part of the Santa Cruz Formation in the Atlantic coast of the Santa Cruz Province (Argentina). In particular, we analysed the taxa recorded by Kay et al. (Reference Kay, Vizcaíno, Bargo, Vizcaíno, Kay and Bargo2012) in the Fossiliferous Levels 1–7 of Tauber (Reference Tauber1997); excluding Homalodotherium, for which there are no mandibles recovered from those levels. These taxa represent a narrow temporal window (∼17.4–17.5 Ma; Fleagle et al. Reference Fleagle, Perkins, Heizler, Nash, Bown, Tauber, Dozo, Tejedor, Vizcaíno, Kay and Bargo2012; Perkins et al. Reference Perkins, Fleagle, Heizler, Nash, Bown, Tauber, Dozo, Vizcaíno, Kay and Bargo2012), which allows palaeoecological integration. See Vizcaíno et al. (Reference Vizcaíno, Kay, Bargo, Vizcaíno, Kay and Bargo2012) for a detailed description of the localities mentioned.
1.1.1. Toxodontia
Adinotherium ovinum: MPM-PV 3660, mandible. Locality: Puesto Estancia La Costa (=Corriguen Aike); MPM-PV 3666, cranium and mandible (sub-adult specimen; see Cassini et al. Reference Cassini, Flores and Vizcaíno2012c). Locality: Campo Barranca; MPM-PV 3667, complete cranium and mandible, ulna. Locality: Campo Barranca; MPM-PV 3668, complete cranium and mandible. Locality: Puesto Estancia La Costa (=Corriguen Aike).
Nesodon imbricatus: MPM-PV 3446, mandible (sub-adult specimen; see Cassini et al. Reference Cassini, Flores and Vizcaíno2012c). Locality: Campo Barranca; MPM-PV 3659, complete cranium and mandible; atlas. Locality: Puesto Estancia La Costa (=Corriguen Aike).
1.1.2. Typotheria. Interatheriidae
Protypotherium australe: MPM-PV 3531, mandible. Locality: Campo Barranca.
Protypotherium attenuatum: MPM-PV 3470, cranium and mandible. Locality: Puesto Estancia La Costa (=Corriguen Aike); MPM-PV 3482, mandibular rami with p3–m3. Locality: Puesto Estancia La Costa (=Corriguen Aike); MPM-PV 3661, mandible. Locality: Campo Barranca.
Protypotherium praerutilum: MPM-PV 3530, mandible vertebrae, femur and fibulae. Locality: Puesto Estancia La Costa (=Corriguen Aike).
Interatherium robustum: MPM-PV 3469, cranium and mandible, vertebrae and ulna. Locality: Estancia La Costa; MPM-PV 3471, cranium and mandible and humerus. Locality: Anfiteatro; MPM-PV 3479, complete mandible. Locality: Estancia La Costa; MPM-PV 3480, mandible. Locality: Puesto Estancia La Costa (=Corriguen Aike); MPM-PV 3528, mandible. Locality: Anfiteatro.
Hegetotheriidae. Hegetotherium mirabile: MPM-PV 3481, mandible (sub-adult specimen). Locality: Puesto Estancia La Costa (=Corriguen Aike).
1.2. Tooth measurements
X-ray images of mandibles were taken from the lateral norm. The occlusal surfaces of the mandibular cheek teeth, including molar (m) and premolar (p) rows, and the X-ray images, were photographed with a ten-megapixel digital camera. The variables defined below were measured in millimetres on the digital photographs, using the public domain NIH image program ImageJ (Rasband Reference Rasband1997–2007).
1.2.1. Hypsodonty index (HI)
The HI of notoungulates was obtained following Janis (Reference Janis, Russell, Santoro and Sigogneau-Russell1988): the crown height ratio of m3 was calculated as the crown height (taken from X-ray images) divided by the labio–lingual width of the tooth. In addition, we measured the crown height of the three molar pieces (Fig. 2A, B).
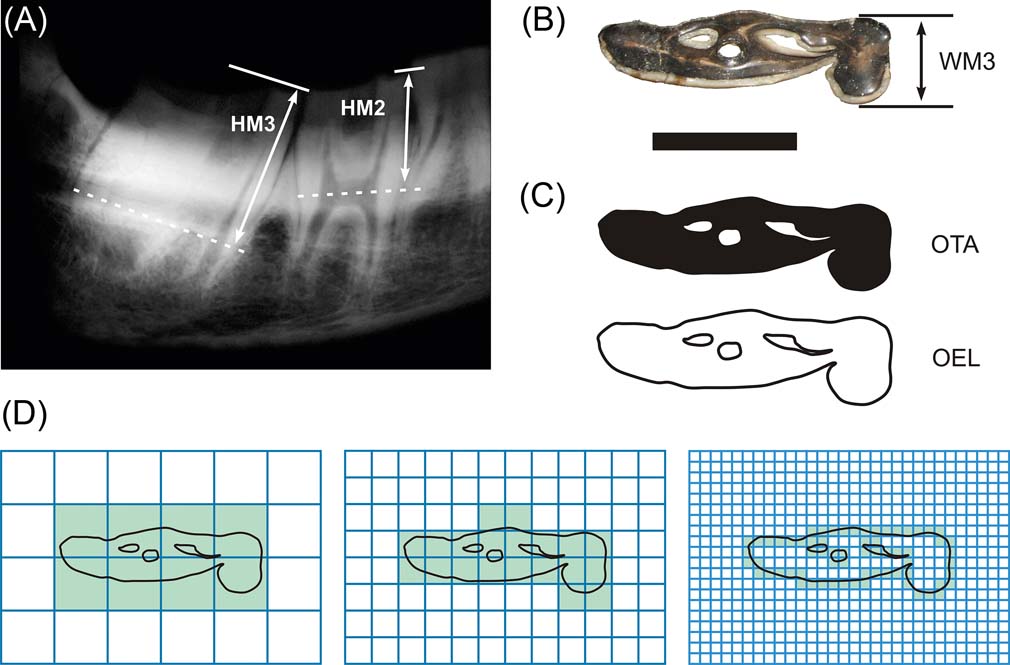
Figure 2 Tooth measurements exemplified in Nesodon imbricatus: (A) RX- Radiography of the right mandible, showing the molar height measurements; (B) occlusal view of m3 with the third molar width length (WM3), following Janis (Reference Janis, Turner and Thulborn1990); (C) tiff images for measuring the occlusal tooth area (OTA) and occlusal enamel length (OEL), following Famoso et al. (Reference Famoso, Feranec and Davis2013); (D) box counting method for obtaining the Minkowski–Bouligand fractal dimension, following Candela et al. (Reference Candela, Cassini and Nasif2013). Scale bar = 22.5 mm.
1.2.2. Occlusal surface area (OSA)
Occlusal surface area is defined, as in Vizcaíno et al. (Reference Vizcaíno, Bargo and Cassini2006; Reference Vizcaíno, Cassini, Fernicola and Bargo2011), as the functional cheek tooth occlusal surface area (without p1, see results), taking into consideration the infolding contour of the tooth (Fig. 2C). We evaluated OSA as the two-dimensional projection of a three-dimensional structure, using digital photos of the occlusal surfaces of the lower cheek tooth (instead of the upper as in Vizcaíno et al. Reference Vizcaíno, Bargo and Cassini2006 and Cassini et al. Reference Cassini, Cerceño, Villafañe, Muñoz, Vizcaíno, Kay and Bargo2012a). In addition, we calculated the occlusal tooth area (OTA) in each piece, following Famoso et al. (Reference Famoso, Feranec and Davis2013), who applied the same method as Vizcaíno et al. (Reference Vizcaíno, Bargo and Cassini2006) and Cassini et al. (Reference Cassini, Cerceño, Villafañe, Muñoz, Vizcaíno, Kay and Bargo2012a), but to each tooth separately.
1.2.3. Tooth complexity. We followed two procedures to quantify tooth complexity, by means of occlusal enamel length (OEL) as the perimeter of enamel infolding of the tooth (Famoso et al. Reference Famoso, Feranec and Davis2013; Fig. 2C), and the enamel crests complexity (ECC) as the fractal dimension (D) of enamel infolding (Candela et al. Reference Candela, Cassini and Nasif2013). These authors use D, defined as the identification and quantification of self-similarity in invariant scale, to evaluate how an object (enamel edges) fills the available space (tooth occlusal surface area), as in Stone & Telford (Reference Stone and Telford2005).
Following Candela et al. (Reference Candela, Cassini and Nasif2013), fractal dimension was calculated as a mean of twelve repetitions using random box positions by box counting method (Fig. 2D), implemented in FracLac 2.5 Release 1d–ImageJ Plugin, using four pixels as a minor box unit, and a series of a power formula of base two with 1028 pixels as a major box unit. In addition, six Tiff images of an Euclidean line (D = 1) and five theoretical known fractals of dimensions nearest one (Gosper's isle edge, D = 1.0689; Koch curve, D = 1.2619), middle range (Viscek, D = 1.4649; Sierpinski triangle, D = 1.585) and nearest two (Sierpinski carpet, D = 1.l8928) were included in the same batch process to assess the accuracy and correct for biases on the D calculated.
1.3. Body mass (BM)
Body masses of Santacrucian notoungulate specimens were estimated using cranio-dental interspecific allometric equations of extant ungulates (Artiodactyla and Perissodactyla) proposed by Janis (Reference Janis, Turner and Thulborn1990). We selected the equation derived from the lower molar row length (LMRL) for “all ungulates”, based on the value of the percentage of variance explained (R2), the percent predictive error (% PE), and availability of the variable involved in the equation amongst the fossil specimens.
1.4. Analyses
For the purposes of this study, only specimens from which all variables could be taken were included in the analyses. The genus was chosen as the working taxonomic level, rather than species, because they are more stable taxonomic units accepted by most palaeontologists (see Cassini et al. Reference Cassini, Cerceño, Villafañe, Muñoz, Vizcaíno, Kay and Bargo2012a and references therein). Descriptive statistics were calculated using R software. Variable normality was analysed with a Shapiro–Wilk test (Shapiro & Wilk Reference Shapiro and Wilk1965). Differences between teeth heights were contrasted by means of non-parametrical Wilcoxon signed rank test. Following Cassini et al. (Reference Cassini, Vizcaíno and Bargo2012b), we assessed the extent and significance of the association between variables via Spearman rank non-parametric correlations. This procedure tests how monotonically the variables are related, even if their relationship is not linear (Zar Reference Zar1999); therefore, we used the original non-transformed data.
The OSA grows at square rate, whereas BM does so at cube rates, because they are measurements of surface vs. volume. So, the two variables were log (base 10) transformed, converting the relationship of these variables from a power formula (OSA = aBMb) to a straight line: log(OSA) = log(a) + b log(BM). The allometric relationship (scaling) of OSA with BM was assessed by the standardised major axis (SMA; reduced major axis) method, as this is more appropriate for dealing with allometric approaches (see Warton et al. Reference Warton, Wright, Falster and Westoby2006). Deviations from isometry were assessed by comparing the allometric coefficient with the value of 0.67 (2/3) expected under geometric similarity by means of F-tests (Warton & Weber Reference Warton and Weber2002).
Theoretical and mean values of known fractals were compared by two-tailed Student's t-test. Differences on means of teeth and individual crest D were analysed by ANOVA procedures and post-hoc Tukey's t-test.
Two principal component (PC) analyses were made, the first on log (base 10) transformed Euclidean variables (lengths and surfaces). The second was made on size independent variables, HI and ECC; given the different nature of the variables, the correlation matrix was used.
2. Results
2.1. Lower tooth morphology
All Santacrucian notoungulates studied here have complete dentition, with the general dental formula for placental mammals (I3/3 C1/1 P4/4 M3/3). In the lower dentition of typotheres, the incisors are procumbent, inserted following the direction of the anterior face of the symphysis, and the root heights are about the same as those of the crown. The i1 and i2 have a cylindrical section shape, except in Hegetotherium, in which they are bilaterally compressed. In Protypotherium, the i3, canine and p1 are bilaterally compressed and similar in size; whilst in Hegetotherium and Interatherium, the i3, canine and p1 are incisor-like and reduced in size. Although the crown morphology of cheek teeth is quite different between the three taxa, all show p2 to m2 as bilobated and m3 tending to be trilobated. In Hegetotherium (Fig. 1A), p3 and p4 are molarised and bear a well-developed labial sulcus, differentiating trigonid from talonid; tooth size increases from p3 to m3, the trigonid remains subequal and rounded, and the talonid increases in size and is triangular in section. In Protypotherium (Fig. 1B), there are two opposite sulci on the cheek teeth, with the labial sulcus deeper than the lingual groove, giving it an asymmetrical occlusal appearance. In addition, the talonid is smaller than the trigonid in the premolars, whilst the opposite is observed in the molars. In Interatherium, both sulci are very deep along the tooth row, and the labial sulcus is the most excavated in the molars (Fig. 1C). In the three genera of typotheres, the talonid of p2 has a smaller surface than the trigonid, and this relationship is reversed towards the molars, resulting in an m3 with trilobated aspect.
Besides the differences in crown morphology, in all studied typotheres p3 to m3 are rootless at advanced ontogenetic stages and develop immediately above the mandibular canal, being all of approximately the same height (Fig. 3). They are almost parallel, except for the m3, which is anteriorly directed, leaving more bone near the growing line between two adjacent teeth. The pulpar cavity never extends up from the alveolar margin. Unlike the other notoungulates, Interatherium has a well-developed process of the mandibular corpus, below the mandibular canal, formed by trabecular bone (Fig. 3A).
Figure 3 X-ray images of typothere, left hemi-mandibles: (A) Interatherium robustum, MPM-PV 3471; (B) Protypotherium praerutilum, MPM-PV 3530. Scale bar = 50 mm.
In both nesodontines, Adinotherium and Nesodon, the incisors are inserted in the same direction as the anterior face of the symphysis, with the crown mesially oriented. The third incisor became hypertrophied during ontogeny, with its root reaching the p3 level. It has a half-round cane transverse section, and wears against I2. The canine and p1 are simple and reduced in size. In the remaining cheek teeth, the trigonids have almost the same dimensions, while the talonids increase in size from p2 to m3 (Fig. 1D–E). The trigonid of unworn molars has a lingually-oriented pike shape (better marked in Adinotherium than in Nesodon), due to the orientation of the mesiolingual paraconid, distolingual metaconid, and labial protoconid (Fig. 1D). The trigonid is separated from the talonid by labial and lingual sulci. In advanced wear stages, the metaconid and entoconid folds lingually fuse, forming a trigonid–talonid fossetid, whilst the trigonid acquires a rounded quadrangular shape. In addition, the entolophid fossetid remains invariable with advanced wear (Fig. 1E). Therefore, the crown morphology became altered by wear and the complexity of the occlusal morphology increases from premolar to molars due to the presence of different dental structures, such as folds and fossetids. Unlike in typotheres, m1 and m2 eventually develop roots in advanced ontogenetic stages, whilst m3 remains rootless (Fig. 4A). However, by the time the third molar is developed but not yet erupted, the roots of m1 and m2 remain open, with the tooth crown occupying all the mandibular ramus height (Fig. 4B).
Figure 4 X-ray images of hemi-mandibles of Adinotherium ovinum at different ontogenetic stages: (A) MPM-PV 3660; (B) MPM-PV 3666; (C) MPM-PV 3544. Scale bar = 100 mm.
2.2. Tooth measurements
Amongst typotheres, crown heights of the two first molars are quite similar (Table 1) and there is no significant differences after a paired Wilcoxon signed rank test (Interatherium: V = 9, p-value = 0.8125; Protypotherium: V = 8, p-value = 0.375). In Hegetotherium, the third molar tends to be higher than the other molars, whilst in interatheriids the opposite trend is observed (Table 1). In both toxodontids, the crown height increases from m1 to m3. Both Interatherium and Nesodon show the lowest HI (∼3.3); whereas Protypotherium and Adinotherium have intermediate HI (∼4 and ∼4.7 respectively) and Hegetotherium is the most hypsodont taxon (HI∼7.8). The hypsodonty index (Table 1) is not correlated with body mass (n = 15, rS = 0.186, p-value = 0.5067).
Table 1 Summary statistics [mean ± one standard deviation; (n)] of teeth measurements (HI dimensionless units; Hm in mm; OTAs and OSA in mm2) and estimated body masses in kg.

The occlusal tooth area (OTA) shows a general pattern of progressively increasing values from p1 to m1 (Table 1), the highest increase being between p4 and m1 in Adinotherium, Nesodon and Protypotherium. Within molars, there are three cases: a progressive increase from m1 to m3 in Nesodon; similar values between m1 and m2 but lower in m3 in Adinotherium and Hegetotherium; and similar values between m1 and m2 but higher in m3 in Interatherium and Protypotherium. Statistical Wilcoxon-rank tests between consecutive tooth pieces could be applied only to interatheriids, due to sample size (n>4); they resulted in a significant difference between p4 vs. m1 in Protypotherium (W = 1, p-value = 0.02157) and p2 vs. p3 (W = 0, p-value = 0.01219).
The sum of OTAs (excluding p1) is equivalent to the occlusal surface area (OSA). OSA values are significantly correlated with body mass (n = 16, rS = 0.9206, p-value<0.00001). The regression of the log (base 10) values was significant (R 2 = 0.9899, p-value < 0.00001) and the test for isometry of allometric coefficient resulted in a negative allometric tendency (slope = 0.553, F iso(1,14) = 48.98, p-value < 0.00001).
The occlusal enamel length (OEL) in toxodontids increases progressively from p1 to m3. In typotheres, it increases from p1 to p4, but all molars show similar values (Table 2). Amongst interatheriids, the statistical Wilcoxon-rank tests between consecutive tooth pieces were tested in Protypotherium, showing a significant difference between p4 vs. m1 (W = 1, p-value = 0.0216); whilst for Interatherium the tests showed a significant difference between p1 vs. p2 (W = 1, p-value = 0.0373) and p2 vs. p3 (W = 1, p-value = 0.02157).
Table 2 Summary statistics [mean ± one standard deviation; (n)] of teeth complexity measurement OEL in millimetres.
The fractal dimension (D) obtained for known fractals does not differ significantly from their theoretical values (t-test), with a very good accuracy to the second decimal place. For example, for the Gosper's isle edge, we obtained a D = 1.0681 (Dteo = 1.0689) and for the Koch curve, a D = 1.2587 (Dteo = 1.2619). In the middle range, the Viscek fractal resulted in a D = 1.4662 (Dteo = 1.4649), the Sierpinski triangle in a D = 1.5869 (Dteo = 1.585) and the Sierpinski carpet in a D = 1.8918 (Dteo = 1.8928). The tooth enamel crest complexity (ECC) of all genera analysed ranged between 1.05 and 1.2; i.e., between Gosper's isle edge and the Koch curve (Table 3). The higher values are reached by m2 and m3 in toxodontids (∼1.19), whilst premolars of interatheriids and Nesodon show the lowest values (∼1.08; Table 3). The One-Way ANOVA with correction for pseudo-replications was significant only for toxodontids and Hegetotherium (Table 4). The post-hoc Tuckey test indicated differences between each piece along the tooth row. Among toxodontids, Adinotherium shows a progressive change in complexity, being lower in the anterior premolars, intermediate in the premolar–molar transition, and higher in the posterior molars; whilst in Nesodon, m2 and m3 are markedly more complex than the premolars and m1. In typotheres, there are two patterns: one more similar to toxodontids (i.e., progressive increasing values from p1 to m3) in Hegetotherium; and the other with uniform values along the tooth row in both interatheriids (Table 4).
Table 3 Summary statistics [mean ± one standard deviation; (n)] of teeth complexity measurement ECC as fractal dimension.
Table 4 One-way ANOVA, with correction for pseudo-replication and multiple comparisons for differences in D between teeth.
Letters: single letters (starting with a) indicate significant values from the lowest to the highest mean; combined letters (e.g., a, b) indicate no significant differences with referenced values (i.e., a and b). * on Hegetotherium, analysis was performed on the twelve replicates for teeth.
2.3. Principal components analysis
The principal component analysis of OEL and OTA from p3 to m3, plus molar heights, results in almost all variance being explained by PC1 (98.58 %), which correlates negatively with body mass (rp =−0.997, p-value < 0.0001). All the variables have negative values, with OTAs being the highest (∼−0.4) and OELs and molar heights the lowest (∼−0.2). The PC2 accounted for only 0.66 % of the variance, but is negatively correlated with HI (r p =−0.851, p-value < 0.001). The m2 and m3 heights have the most negative values (∼−0.5), whilst the m3 OTA has the most positive one (∼0.5). The morphospace depicted by these two components (Fig. 5A) clusters interatheriids on the first quadrant (low BM and HI), Nesodon on the second (high BM and low HI), Adinotherium on the third (high BM and HI) and Hegetotherium on the fourth (low BM and high HI).
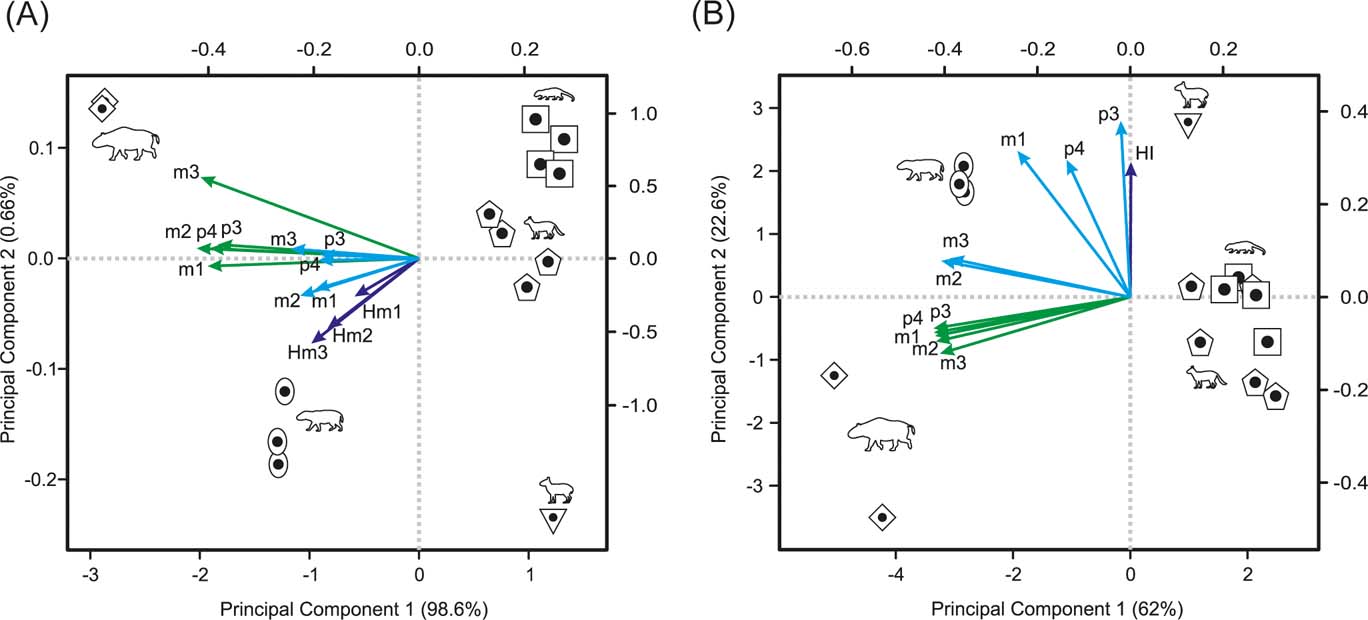
Figure 5 Morpho spaces depicted by the two first principal components: (A) PCA on OTA and OEL from p3 to m3, plus molar heights (Hm1 to Hm3); (B) PCA on OTA, ECC and HI from p3 to m3. Arrows indicate the pc-loadings (green = OTA; cyan = OEL (in A) and ECC (in B); blue = HI). The pc-scores scale at the bottom and left axes. The pc-loadings scale at the upper and right axes. Symbols: square = Interatherium; rhombus = Nesodon; pentagon = Protypotherium; oval = Adinotherium; inverse triangle = Hegetotherium.
The principal component analysis of OTA, ECC from p3 to m3, plus HI, results in the first two components accounting for ∼90 % of the cumulative variance, with the PC1 (∼62 %) correlating negatively with body mass (rp =−0.98, p-value < 0.0001). With the exception of ECC of p3 and p4 and HI, the remaining variables (ECC and OTA) have high negative loadings (mostly ∼−0.36; and ECC of m1 ∼−0.2). On PC2 (22.6 %), which is uncorrelated with BM (rp =−0.17, p-value = 0.548), the ECC of p3 has the highest loading (0.55), followed by the HI and ECC of p4 and m1 (∼0.42), whilst the OTAs have the lowest loading (−0.18). The morphospace depicted by these two components gathers large notoungulates on the negative side of PC1 and small ones on the positive side (Fig. 5B). On PC2, the most hypsodont, with a higher crown complexity pattern of p3 to m1 (Hegetotherium and Adinotherium), lie on the positive side, whereas those less hypsodont and with a more simplified crown pattern, but with greater occlusal surface area (Nesodon and interatheriids), lie on the negative side.
3. Discussion
X-ray images clearly show that premolars and molars of typotheres are high-crowned and ever-growing (euhypsodonty sensu Mones Reference Mones1982). In addition, p3–m3 have a similar crown height, so it should be expected that HI calculated on molars (even when they have suffered wear) will not vary significantly during the life span. The premolars and molars of nesodontines are also high-crowned but all, except m3, have finite growth. X-ray images reveal that at early ontogenetic stages, m1 and m2 are rootless and occupy the complete mandibular ramus height (Fig. 4C). Later, as they develop roots (Fig. 4A), functional hypsodonty is achieved by the crown emerging (not growing) from a high mandibular ramus (protohypsodonty sensu Mones Reference Mones1982). Consequently, HI would vary according to the ontogenetic stage, being higher in a fully formed tooth before emerging than in an emerged one (see Fig. 4). Instead, m3 seems to be ever-growing throughout the life span, or at least until advanced adult stages (as the trigonid eventually starts to develop a root whilst the talonid remains rootless; see also Fig. 2A). Due to these reasons, we focus on m3 to compare results of HI between toxodontids and typotheres. The obtained values of HI are comparable with those of Janis (Reference Janis, Russell, Santoro and Sigogneau-Russell1988) for artiodactyls and perissodactyls, even when calculated on a worn m3 (Cassini et al. Reference Cassini, Mendoza, Vizcaíno and Bargo2011). As it was previously reported by Cassini et al. (Reference Cassini, Mendoza, Vizcaíno and Bargo2011), all Santacrucian notoungulates have an HI comparable with those of extant ungulates dwelling in open or mixed habitats (HI > 2; see Mendoza & Palmqvist Reference Mendoza and Palmqvist2008).
The total occlusal surface area (OSA) is highly correlated with body mass, as has been previously reported for upper cheek teeth of notoungulates (Cassini et al. Reference Cassini, Cerceño, Villafañe, Muñoz, Vizcaíno, Kay and Bargo2012a) and also for other herbivorous mammals (Vizcaíno et al. Reference Vizcaíno, Bargo and Cassini2006, Reference Vizcaíno, Cassini, Fernicola and Bargo2011; Famoso et al. Reference Famoso, Feranec and Davis2013). In the present study, this relationship follows a negative allometric trend, opposed to the positive allometry reported by Cassini et al. (Reference Cassini, Cerceño, Villafañe, Muñoz, Vizcaíno, Kay and Bargo2012a) for upper cheek teeth. This implies that large notoungulates (i.e., Adinotherium, ∼100 kg and Nesodon, ∼1000 kg; Table 1) have OSA proportionally larger on the upper cheek teeth and smaller on the lower cheek teeth than expected for their body size. Certainly, this may have mechanical implications; for instance, to emphasise the lateral component on chewing movements, as lower teeth have to travel against the occlusal surface of the upper teeth more than in typotheres (<10 kg; Table 1).
Instead, the implications on dietary preferences and digestive physiology remain obscure. As mentioned above, it has been suggested that amongst ungulates and other herbivorous mammals, OSA is larger in grazers than in browsers, constitutes a measure of the capacity to process food in the oral cavity and reflects aspects of feeding physiology and metabolism (Janis Reference Janis, Russell, Santoro and Sigogneau-Russell1988, Reference Janis, Turner and Thulborn1990, Reference Janis and Thomason1995; Janis & Constable Reference Janis and Constable1993; Pérez-Barbería & Gordon Reference Pérez-Barbería and Gordon1998b; Mendoza et al. Reference Mendoza, Janis and Palmqvist2002; Vizcaíno et al. Reference Vizcaíno, Bargo and Cassini2006, Reference Vizcaíno, Cassini, Fernicola and Bargo2011). Based on these concepts, Cassini et al. (Reference Cassini, Cerceño, Villafañe, Muñoz, Vizcaíno, Kay and Bargo2012a) proposed that notoungulates had better digestive capabilities than other native South American ungulates (litopterns); amongst them, Toxodontia and Typotheria tend to have greater and lower OSA, respectively, than predicted for an herbivorous mammal of equivalent size. However, several of the mentioned contributions calculated OSA on the upper cheek teeth instead of the lower, as we do here, which stresses the need for further research on this matter.
The occlusal tooth area (OTA) shows a positive correlation with body mass, as was reported for extant ungulates by Famoso et al. (Reference Famoso, Feranec and Davis2013), although following different patterns along the lower tooth row between taxa. In the typotheres Interatherium and Hegetotherium, both with molarised p3 and p4, there is a gradual increase in OTA from p3 to m3. On the contrary, in Protypotherium and toxodontids, in which premolars are not or are less molarised, the premolars have a lower OTA than the molars. As proposed by Famoso et al. (Reference Famoso, Feranec and Davis2013), OTA has a strong correlation with the enamel length (OEL) in extant ungulates. Therefore, the analysis of these two variables, OTA (and their sum OSA) and OEL, leads to the same conclusion. In our analyses, OEL and OTA are strongly correlated and follow a similar pattern, scaling with body mass and increasing in a similar way from p1 to m3. In accordance with Famoso et al. (Reference Famoso, Feranec and Davis2013), OEL seems to be controlled as much by diet preference (grass or browse) as by body size and phylogeny (particularly the constraints on its digestive strategy), and therefore it cannot be used on its own to determine feeding strategy.
The enamel crest complexity (ECC) is indicative of how the enamel edges of cheek teeth fill up the available occlusal surface area. As the enamel edges become more convoluted, they become more complex, and the fractal dimension (D) is expected to be between 1 and 2. The ECC obtained for Santacrucian notoungulates are between 1.05 and 1.20, lower than that of the Late Miocene giant caviomorph rodent Eumegamys paranensis (Candela et al. Reference Candela, Cassini and Nasif2013) (∼1.5) and the Proboscidea Elephas maximus (D = 1.21) and Mammuthus columbi (D = 1.36) (Stone & Telford Reference Stone and Telford2005). Within notoungulates, cheek teeth of typotheres are less complex than those of toxodontids. In interatheriids, tooth complexity is similar along the tooth row, whilst in Hegetotherium and toxodontids, complexity increases from premolars to molars. As proposed by Candela et al. (Reference Candela, Cassini and Nasif2013), the dissimilar degree of complexity along the cheek tooth row probably reflects different capacities for breaking food in each masticatory cycle. Whilst in interatheriids this capacity must have been nearly equally distributed along the cheek tooth row, in Hegetotherium and the toxodontids it must have been emphasised in the last molars. As also proposed for Eumegamys (∼140 kg), it is expected that larger animals require higher tooth complexity to process large amounts of food daily.
The relationship with other dental variables such as OTA (and consequently body mass) and HI was summarised by the PCA. The ECC of p3 to m1 (anterior to middle tooth row) and HI do not correlate with occlusal surface area and, therefore, are size independent. Instead, the ECC of m2 and m3 correlate with occlusal area and body mass. This indicates that the most hypsodont Santacrucian notoungulates (Hegetotherium and Adinotherium) have relatively less occlusal area and more tooth complexity on the anterior to middle parts of the tooth row than other genera. Amongst the less hypsodont taxa, Nesodon and Protypotherium have relatively larger occlusal areas, but less tooth complexity, in the anterior to middle parts of the tooth row than do Interatherium.
Among typotheres, all being euhypsodont, Interatherium has the lower HI but may compensate that with more molarised p3 and p4 (with OTA and ECC similar to those of molars) than Protypotherium. Hegetotherium has less occlusal area, but seems to compensate this with more hypsodont cheek teeth, molarised p3 and p4, and more complex molars. Within toxodontids, Nesodon has lower HI that Adinotherium, but both tend to simplify the occlusal pattern of m1 and m2 as they wear, maybe as a result of a protohypsodonty. In contrast, the m3, which is an ever-growing tooth, has a greater complexity crown pattern, being relatively higher in Nesodon.
Cassini (Reference Cassini2013), based on ecomorphological analyses of 3D landmarks, proposed that all Santacrucian notoungulates inhabited open habitats, with Nesodon more likely dwelling in a mixed habitat (but see Townsend & Croft Reference Townsend and Croft2008). Whilst the interatheriids must have fed mainly on grasses, the others would have consumed grasses and leaves, depending on their availability. Madden (Reference Madden, Kay, Madden, Cifelli and Flynn1997) proposed that the most complex molar crowns in toxodontids would have provided great shearing ability to break down the grasses. The present results seem to be coherent with these previous hypotheses. The hypsodont teeth of Santacrucian notoungulates indicate high rates of tooth wear, perhaps in response to an increase of abrasives consumed with the food (Billet et al. Reference Billet, Blondel and de Muizon2009) in open or mixed environments. According to Evans et al. (Reference Evans, Wilson, Fortelius and Jernvall2007), functional design traits, such as tooth occlusal area and complexity, depend on the required degree of mechanical processing, which in turn depends on the difficulty with which mechanical and chemical breakdown of different kinds of food can be achieved (as well as metabolic requirements). Therefore, the chewing effort (e.g., grinding) depends on the toughness of the plant consumed; for example, a given particle size of tough food (such as grasses or other fibrous plants) can be obtained by investing less chewing energy when processed by a more complex tooth.
As a working hypothesis, we propose that these three traits (i.e., tooth occlusal surface area and complexity, and tooth crown height) are integrated as a complex in which a reduction in one feature is compensated by an increase in one or two of the others (partially in Vizcaíno et al. Reference Vizcaíno, Bargo and Cassini2006; and Reguero et al. Reference Reguero, Candela, Cassini, Madden, Carlini, Vucetich and Kay2010). As a consequence, although the hypsodonty index has been considered a powerful tool for palaeoecological reconstructions, it should not be evaluated alone, as it is also true for the other two.
4. Conclusions
On the available evidence, the tooth occlusal complexity, occlusal surface area and hypsodonty in the Santacrucian notoungulates could have been adaptations towards durability of teeth and increased functional efficiency for grinding food processing. Whilst occlusal surface area is strongly influenced by body mass (and perhaps digestive capabilities), tooth complexity and hypsodonty are size independent. Occlusal complexity, occlusal area and hypsodonty seem to compensate each other in order to process relatively large amounts of demanding food (grass), or even a variety of diets (as those of the mixed feeders) that include great quantities of environmental abrasives, as in open and mixed habitats.
5. Acknowledgments
The authors wish to thank following people and institutions: the Editors of this Special Issue on Form, Function and Palaeobiology, for inviting us to participate; the Dirección de Patrimonio Cultural and Museo Regional Provincial Padre M. J. Molina (Río Gallegos, Argentina), for granting access to the vertebrate palaeontological collections; and the reviewers M. Reguero and E. Cerdeño, for valuable suggestions and corrections that greatly enhanced this manuscript.
This is a contribution to the following projects: PICT 2013-0389 (ANPCyT) and UNLP N750 (to SFV); the National Science Foundation (to R. F. Kay); and the National Geographic Society (to SFV and R. F. Kay). GHC dedicates this paper to the memory of M. Cristina Escobar García, for her unconditional support through the toughest times.


