


1. Introduction
No one was surprised on October 21, 2019, after the polls had closed in Canada's 43rd federal election, at the news that Gudie Hutchings, incumbent Liberal MP in the district of Long Range Mountains, Newfoundland, had been safely re-elected to office. Western Newfoundland was a Liberal stronghold in the days of Joey Smallwood, and it remains a Liberal stronghold today. But one thing about Hutchings’ victory was unusual, something that made the re-elected MP stand out clearly from most of her Liberal colleagues: her riding was rural. Unlike in earlier decades, when many Liberals were elected in rural districts, the 2019 Liberal caucus was thoroughly urban, its members drawn by the dozen from Canada's biggest cities. By land area, fully 84 per cent of ridings won by the Liberals in 2019 could fit comfortably within the borders of Hutchings’ Switzerland-sized constituency. Liberal support in western Newfoundland may have changed little over the decades, but the Liberal Party to which it remained so loyal had been profoundly transformed.
This urban-rural divide in recent Canadian elections is hardly unique. In the United States, electoral polarization between urban and rural areas is clearer than ever, so much so that Rodden (Reference Rodden2019: 106) has described recent American elections as “battles between a party that represents the downtown core and inner suburbs . . . and a party that represents the sprawling exurbs and rural periphery of such cities.” In Britain, many have noted the divide between a firmly “remain” metropolitan London and the Brexit-friendly English countryside. Similar patterns are visible on election maps in countries as diverse as France, Switzerland and Hungary: tiny urban concentrations of party support dotted across the landscape, marooned in a vast ocean of rural political opposition (Rodrígues-Pose, Reference Rodríguez-Pose2018). In many advanced democracies, electoral division between urban and rural areas is among the most striking features of contemporary politics.
In Canada, despite evidence of a clear divide in recent elections, the urban-rural cleavage has been sorely neglected by political scientists. In part, this is simply because Canadian scholars’ attention has been elsewhere, focused on the religious, linguistic and regional cleavages that animate so much of Canadian political development. It may also originate in a lack of consistent data with which to observe the evolution of the urban-rural divide over time. Whatever the cause, we currently know almost nothing about the historical development, political-geographic dynamics or predictive power of the urban-rural cleavage in the long-term history of Canadian electoral politics.
In this article, we initiate a new research agenda on the development of the urban-rural cleavage in Canadian federal elections. Using a new measure of the urban or rural character of every federal electoral district in Canadian history, we focus on three aspects key to any analysis of durable electoral cleavages. First, we explain when the urban-rural electoral cleavage has existed in Canada, identifying three periods in which it is especially pronounced: the 1920s, the 1960s and 1993–present. We argue that a durable urban-rural cleavage among the major parties emerged in the early 1960s, reinvigorated in 1993, and deepened after the Conservative Party's consolidation in 2003. Second, we outline where this divide has been present in Canada. Despite some regional variation, we show that the postwar urban-rural cleavage is pan-Canadian in scope. Finally, we assess the importance of the urban or rural character of districts for understanding the elections that take place within them. This analysis clarifies the periods in which urbanity predicts district-level election outcomes. We find that the urban-rural cleavage has been more important in recent elections than at any point in Canada's history.
Our results lay the groundwork for future research on the causes and consequences of the urban-rural cleavage in Canadian elections. However, this article also introduces several important new findings in its own right. We provide new evidence that the political upheavals of the Diefenbaker era produced a durable urban-rural cleavage between the major political parties for the first time in Canadian history. This shift must be understood, we argue, as a crucial element of the federal party system transformation that occurred during the 1950s and 1960s. We also show that it is the Liberal Party, not the New Democratic Party, that enjoys a consistent urban advantage in federal elections; indeed, it is the Liberal Party that benefits most from an increasingly urban Parliament in an increasingly urban Canada. This Liberal urban advantage may help explain why a party whose national support has gradually declined has nevertheless managed to remain dominant in the late twentieth and early twenty-first centuries. We conclude by discussing how future research can build on our findings to explore urban representation in federal political institutions and policy, to understand the relationship between the urban-rural electoral cleavage and public opinion, and to explain how the political controversies and party strategies of the 1950s and 1960s forged a durable urban-rural cleavage whose size and importance has grown steadily larger over the past six decades.
2. The Urban-Rural Divide in Canadian Elections
Electoral divides between urban and rural districts have been a subject of growing attention among political scientists in recent years. This is especially true in the United States, where electoral geography manifests in a stark pattern: oceans of rural Republican red punctuated by urban islands of Democratic blue. In an extended treatment of this divide's historical development, Rodden (Reference Rodden2019) traces the roots of urban Democratic support to the early manufacturing era and New Deal, while also pointing to the party's more recent strength among urban knowledge workers. Similarly, Ogorzalek (Reference Ogorzalek2018) explores the New Deal–era emergence of an urban-rural cleavage in American voting behaviour and congressional coalitions and its consequences for postwar federal politics and policy. Several excellent studies employ diverse methodological approaches to explain how urban and rural contexts affect political attitudes, behaviour and social identities in the contemporary United States (Cramer, Reference Cramer2016; Gimpel et al., Reference Gimpel, Lovin, Moy and Reeves2020). Explicitly or implicitly, these recent studies trace a lineage to foundational research in comparative politics and political sociology that recognized the urban-rural distinction as a formative national political cleavage (Lipset and Rokkan, Reference Lipset, Rokkan, Martin Lipset and Rokkan1967; Weber, Reference Weber1958).
In Canada, despite a rich research tradition on agrarian political movements (for example, Lipset, Reference Lipset1950), attention to long-term urban-rural divides has been limited. In general, existing research falls into two main genres. The first comprises studies of specific elections or time periods, which mention urban-rural cleavages as part of a larger narrative of an election outcome. These passing mentions were common in the 1960s, a period in which, as we will see below, the urban-rural cleavage re-emerged as an important feature of Canadian electoral politics. Many observers in the 1960s noticed this divide, though their interpretation of its sources and significance varied considerably (Alford, Reference Alford and Meisel1964; Irvine, Reference Irvine and Meisel1964; Meisel, Reference Meisel1962; Regenstreif, Reference Regenstreif1965). Political scientists’ attention to urban-rural cleavages faded in Canada through the 1970s and 1980s, as public and scholarly attention turned to regional and linguistic cleavages. By the 1990s, however, interest had re-emerged, especially in the work of Richard Johnston, who consistently emphasized the role of the urban-rural cleavage—particularly agrarian revolt—in Canadian political development (Johnston et al., Reference Johnston, Blais, Brady and Crête1992; Johnston, Reference Johnston2017). Flanagan's (Reference Flanagan2007, Reference Flanagan2009) accounts of the origin and legacies of the Reform, Canadian Alliance and Conservative Parties also emphasize the importance of urban-rural division in Canadian politics. While important and valuable, these treatments are exceptions to the general pattern. Most Canadian political science research, even if it acknowledges urban-rural variation in party support, pays little attention to the evolution, size or importance of this variation for more general understanding of Canadian elections and political development. Even if this minimal attention proves to have been appropriate—that is, even if the urban-rural cleavage is not very important in Canada relative to other countries—this choice can only be adjudicated with systematic empirical evidence. As we will see, the relative absence of attention to urban-rural electoral divisions in Canadian elections becomes increasingly difficult to defend as we move through the postwar era up to the present.
The second genre investigates variation in policy attitudes and political representation in urban and rural areas. For example, McGrane et al. (Reference McGrane, Berdahl and Bell2017) explore variation in policy preferences among urban, suburban and rural Canadians, as do Cutler and Jenkins (Reference Cutler, Jenkins, Telford and Lazar2002: 385), who argue that the urban-rural cleavage in political attitudes “does exist but it is neither as wide or as deep as is often suggested.” Sayers (Reference Sayers2013) investigates the role of urban-rural differences in cabinet selection, arguing that “city ministers” are common in recent cabinets even when controlling for other relevant differences between urban and rural MPs. And in a series of articles that is perhaps closest in spirit to the questions we pursue here, Walks (Reference Walks2004a, Reference Walks2004b) examines spatial divides in political attitudes and representation, focusing primarily on the distinction between the core and postwar suburban zones of large metropolitan areas.
All of these studies offer valuable treatments of urban-rural polarization in specific contexts, and we make use of this work when interpreting our own findings below. Missing, however, are two essential ingredients for any systematic study of the urban-rural divide. First, attention to the measurement challenges involved in analyzing urban-rural cleavages—how to measure a district's urbanity in a way that enables long-term comparative research—has been almost totally absent in Canadian research. As we will see, this absence is partly excused by the underdevelopment of methodological concerns in other countries. Second, and relatedly, we currently know little about the long-term history of urban-rural electoral divides in Canada. Past work has offered clues about where and when we might look for periods of agrarian political mobilization, for example, but we currently lack clear answers to the questions that animate this article: When and where has the urban-rural cleavage been present in Canadian politics, and how important is it for understanding district-level outcomes in Canadian federal elections?
We will undertake more detailed analysis of specific periods in Canadian political development in the future. In this article, we focus on the big picture: urban-rural variation in support for major national political parties. While we discuss several minor parties, we acknowledge that they receive limited treatment here. Urban-rural divides in support for these smaller parties in specific time periods—urban labour parties, Prairie progressives, the Green Party, and so on—deserve serious attention, and our data and measures are well suited to, and lay the groundwork for, these more specific analyses.
3. Measuring the Urban-Rural Divide
Some political scientists have included urban-rural indicators in models of Canadian federal election outcomes and voting behaviour. Unfortunately, however, the theoretical and methodological issues involved in measuring the urbanity of an electoral district have been seriously neglected. To understand our own measurement approach, we begin by surveying the three major strategies that political scientists have employed to measure an electoral district's urban or rural character.
A first approach, which we call “threshold” measures, defines a population threshold above which a community is considered urban. Some American studies define urban communities as those with populations above 500,000 (Gamm and Kousser, Reference Gamm and Kousser2013; Sauerzopf and Swanstrom, Reference Sauerzopf and Swanstrom1999). While effective as a rough proxy for urbanity in short-run analyses, fixed thresholds are inappropriate for longer-term research because the threshold of meaningful urbanization has changed dramatically over time; in Canada, a threshold of 50,000 would exclude all but the very largest cities in the nineteenth century but would include places whose urbanity is questionable today.
A valuable improvement is to define a dynamic threshold that increases as a country grows. For example, Lieberman (Reference Lieberman and Dilworth2009) and Ogorzalek (Reference Ogorzalek2018) define American cities as places with at least 0.1 per cent (one-thousandth) of the national population at each decennial census. This produces a rolling list of American cities with good face validity, allowing these researchers to investigate urban-rural politics over the long term in a manner that is sensitive to evolving baseline levels of urbanization.
A second, “metropolitan” family of approaches defines urban and rural districts in relation to metropolitan areas as defined by statistics agencies. These distinguish urban cores, suburbs and more distant rural areas on the basis of commuting patterns (USDA, 2020). Several American studies use this metropolitan approach (Scala and Johnson, Reference Scala and Johnson2017; Wolman and Marckini, Reference Wolman and Marckini1998), and recent Canadian analyses of urban-rural and urban-suburban divides also depend on a metropolitan conceptualization (Cutler and Jenkins, 2000; McGrane et al., Reference McGrane, Berdahl and Bell2017; Walks, Reference Walks2004a, Reference Walks2004b). While this approach may be useful for cross-sectional research, it breaks down over longer time periods because the methods used by statistics agencies to define metropolitan areas have changed over time, as has the scale of labour and housing markets in relation to changing housing and transportation costs and the economic base. Changes to municipal boundaries through amalgamations and annexations also complicate making distinctions between core, suburban and rural zones on the basis of territorial jurisdiction.
A third family of approaches might be called “indicator” measures. Here researchers choose a particular indicator of a district's urban or rural character, the most common of which is population density. This approach has yielded strong work in the United States, both historical (Rodden, Reference Rodden2019) and contemporary (Gimpel et al., Reference Gimpel, Lovin, Moy and Reeves2020). In Canada, it is employed effectively in Sayers’ (Reference Sayers2013) study of cabinet selection, which includes multiple indicators of district urbanity. Once again, however, the choice of indicators is rarely explicitly theorized, and many studies rely on data and indicators that are unavailable over longer spans of time.
Each of these approaches has yielded useful findings on urban-rural electoral divisions. At present, however, district urbanity measures suffer from three important weaknesses. First, measures of district urbanity remain undertheorized. With very few exceptions (Ogorzalek, Reference Ogorzalek2018; Sayers, Reference Sayers2013; Nemerever and Rogers, Reference Nemerever and Rogers2021), researchers spend little time explaining why a measurement strategy is preferable or how a measure may reliably capture the urban or rural character of districts. Second, with the exception of the dynamic threshold, researchers have not developed measures that enable systematic analysis over long time spans, during which the scale and socio-economic and physical character of urbanization has changed considerably. These weaknesses prevent conventional metropolitan and indicator approaches from being employed in long-term research. Finally, as is common in political science more generally, every study of which we are aware has assumed that a district's urban or rural character can be measured without error. In other political science subfields, such as democratization, methodologists have demonstrated that this false precision can have serious consequences for inference (Treier and Jackman, Reference Treier and Jackman2008). There is every reason to believe that this is equally true of the urban-rural divide.
4. A New Long-Term Measure of District Urbanity
Given these weaknesses, we believe that political scientists have much to gain from adopting a measure of district urbanity that is theoretically grounded, enables long-term analysis and explicitly acknowledges the uncertainty involved in measuring complex social phenomena. We therefore have three priorities for our own measure of district urbanity in Canada. The first is to build a measure that recognizes the latent quality of a district's urban or rural character. As urbanity is a multidimensional construct, a measure of district urbanity that incorporates multiple indicators is likely to generate a more theoretically satisfying and empirically valid summary of electoral districts.
Our second priority is to enable long-term analysis, which requires both theoretical and practical sensitivity. Theoretically, we must be aware that the meaning and importance of a particular measure as an indicator of urbanity might change over time. The most obvious example is population size, whose meaning will evolve as a country's population grows. Another is the economic base; earlier in history, urbanity may be strongly associated with manufacturing employment, while today, services may be more important. More practically, we must be sensitive to the availability of consistent data across a long time span. The earlier the era considered, the less likely that demographic and other data will have been consistently collected. In our study, this required not only careful selection of indicator variables but also major new data collection efforts.
Finally, we believe that the study of the urban-rural cleavage requires explicit acknowledgment that its measurement necessarily involves uncertainty. As we will explain below, our measurement model allows us not only to better understand the uncertainty in our measure but also to propagate this uncertainty through subsequent analyses, producing more robust findings. Following important work in other domains, including democratization (Treier and Jackman, Reference Treier and Jackman2008) and political ideology (Hare et al., Reference Hare, Armstrong II, Bakker, Carroll, Poole, Bakker, Carroll and Poole2015), we conceptualize urbanity as a latent variable and employ Bayesian estimation to measure it with uncertainty.
4.1 Indicators of district urbanity in Canada
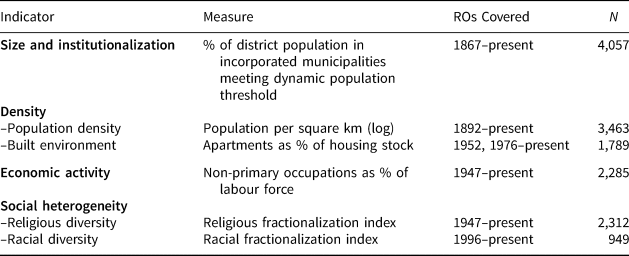
The precise definition of an urban place is a subject of ongoing—and probably irreconcilable—discussion and debate. Nevertheless, many researchers implicitly or explicitly draw from foundational work in sociology, economics, geography and urban history in emphasizing five central features of urban places: size, institutionalization, density, economic activity and social heterogeneity (see Deuskar, Reference Deuskar2015). In our measure, we begin by linking the size and institutionalization of urban settlements to produce a dynamic threshold indicator of urbanity. While the population size of a federal electoral district is not itself a useful measure of its urbanity, the proportion of its population living within large incorporated municipalities is. As the meaning of “large” varies over time, we follow Lieberman (Reference Lieberman and Dilworth2009) and Ogorzalek (Reference Ogorzalek2018) by adopting a dynamic threshold approach. A large municipality is defined as containing at least 0.1 per cent of the national population at each census. Using paper and digital census volumes, we first compiled a list of every incorporated municipality whose population surpasses this threshold in each decennial census between 1871 and 2011 (CCRI 2009). We then used paper and digital census records to record the proportion of each district's population residing within these large municipalities.
Our dynamic threshold indicator implicitly recognizes a second important feature of Canadian urban development: institutionalization. As demands for urban services multiply as rural crossroads expand into more substantial settlements, increasingly sophisticated local government institutions are established to meet them. A key indicator of this process is municipal incorporation, which brings with it democratic representative institutions, local taxation and the fiscal and administrative capacity to provide services and infrastructure (Bloomfield et al., Reference Bloomfield, Bloomfield and McCaskell1983; Wallis, Reference Wallis1994). Our dynamic threshold indicator thus includes only incorporated municipalities. The resulting indicator, which we have calculated for all districts from 1867 to the present, ranges from 0 (no one in the district resides in a large incorporated municipality) to 1 (everyone in the district resides in one).
Our third characteristic is density. Cities are defined by the concentration of human activity and the intensity of the built environment. We capture these aspects as population density and the proportion of the housing stock composed of apartments. To measure a district's density, we require both the district population (the numerator) and its land area (the denominator). Both of these values are readily available in digital form beginning with the 1987 representation order (RO). For earlier years, we transcribed district population counts from printed census volumes from the first national census, which was in 1871, to 1986. To calculate consistent district land areas, we created a spatial dataset of district boundaries spanning the 13 ROs from 1892 to 2013.Footnote 1 We then calculated each district's land area (excluding water features) and population density. To capture the intensity of the built environment, we also extracted housing stock information from the census—apartments as a proportion of total dwellings—which is available for all but one decennial census since 1961.
Our fourth characteristic of urbanity is economic activity. Urbanization as a historical process is related to industrialization (Scott, Reference Scott1986). Urban places are therefore distinguished by their industrial and occupational profile, as it is in cities that value is added to natural resources through manufacturing and that wealth is generated through producer services, while rural hinterlands are defined by primary-sector economic activities: farming, fishing and trapping, forestry, and other forms of natural resource extraction (ILO, 2018; Strange, Reference Strange2016). While rural labour has historically been directed toward primary resource extraction—farming, fishing and trapping, mining, and forestry—urbanites toil in the secondary and tertiary sectors of the economy. We operationalize this aspect of urbanity as the proportion of the labour force working in non-primary industry occupations.
Our final characteristic is social heterogeneity. Sociologists have long viewed social heterogeneity as a defining feature of urban life, permitting encounter, conflict and co-operation across groups (Wirth, Reference Wirth1938; Simmel, [1903] Reference Simmel and Wolff1964). To capture this aspect of district urbanity, we prioritized census variables that have been measured consistently and comparably over time: religious denomination (1951–present) and visible minority status (1996–present).Footnote 2 As society has become more secular—4.3 per cent of Canadians reported as atheists in the 1971 census, compared to 23.8 per cent in 2011—race has become a more salient marker of diversity as immigration has transformed the Canadian population, and particularly in large metropolitan areas. According to the 2016 census, 41 districts are majority non-white, and 84 per cent of visible minority Canadians live in the 120 ridings that correspond to the greater Toronto, Montreal and Vancouver metropolitan regions (Taylor, Reference Taylor2021). We calculate a fractionalization index for each, indicating the relative heterogeneity of the population.
Historical census data come from several sources. Blake (Reference Blake1984) aggregated district-level socio-demographic data for selected elections between 1908 and 1968, and Statistics Canada has disseminated selected census data at the electoral district scale since 1991 (pertaining to RO 1987). However, Blake's datasets did not include all variables and documentation for all years required to construct our measure. To fill this gap, we assembled data from Statistics Canada's basic summary tabulation series for enumeration areas—the smallest geographic unit for which census data were disseminated between 1961 and 1996—and aggregated these data to federal electoral districts.Footnote 3
The result of these data collection efforts, which we summarize in Table 1, is a comprehensive new dataset on each of the more than 4,000 federal electoral districts in Canada's post-Confederation history. Drawing on diverse research traditions, these indicators capture multiple distinct but correlated dimensions of urbanization and urban life.Footnote 4 While we will extend this dataset in future work, it is the most comprehensive aggregate data series on Canadian federal electoral districts ever constructed.
Table 1 Summary of Indicators
4.2 Advantages of a multiple-indicator measure of urbanity
Our multiple-indicator approach to district urbanity, which conceptualizes the urbanity of an electoral district as a latent quality indicated by size, institutionalization, density, economic activity and social heterogeneity, has both theoretical and empirical advantages over a single-indicator approach. Theoretically, as we have noted above, we draw on diverse disciplinary traditions of conceptualizing urbanity. Rather than insist that a single tradition captures the true meaning of urbanity, we believe that a measure incorporating each of these traditions brings greater theoretical richness to political science research on the urban-rural cleavage.
Empirically, the multiple-indicator approach also has the advantage of higher validity and lower measurement error, allowing each indicator to compensate for other indicators’ weaknesses across space and time. A density-only measure, for instance, performs well for most urban districts but falters when a district's population is mostly urban but also includes a large, lightly populated surrounding rural area—a common feature of many Canadian districts, especially in the first half of the twentieth century. In these circumstances, our dynamic threshold indicator helps to compensate for measurement error in the density indicator by recognizing the unevenness of human settlement. Similarly, our dynamic threshold indicator may itself falter in cases when a municipality is relatively small but is nestled within a recognizably urban region—such as the municipality of Westmount on the Island of Montreal—but this circumstance causes no trouble for the density, diversity or economic indicators.Footnote 5 Each indicator thus helps to compensate for edge cases that would trouble a single-indicator approach.
As our indicators are related to one another, each capturing a distinct dimension of urbanity, our measure is not likely to generate markedly different results from those we might achieve from a single-indicator approach; indeed, in the online supplementary material, we show that the results of our main analysis below are substantively identical when using a density-only measure.Footnote 6 That said, measurement exercises such as the one we undertake here have intrinsic value. Not only do they generate a new variable, but they also reveal theoretical complexity and nuance. Measuring urbanity this way allows us to draw from the empirical strengths of multiple empirical indicators and to acknowledge the uncertainty involved in measuring such a complex socio-spatial phenomenon. Even more, it allows us to provide rigorous, empirical corroboration for a long and theoretically rich interdisciplinary body of scholarship.
4.3 Measuring urbanity
We have argued that district urbanity is an unobserved latent variable whose presence is indicated by five core features: population size, institutionalization, density, economic base and social heterogeneity. To measure this latent quantity, we employ the following Bayesian factor analysis model:Footnote 7

Here, i refers to each electoral district for each of the k indicators in each of the t representation orders, and ξ is a latent measure of each district's urban or rural character. Additionally, for all indicators with the exception of the dynamic threshold, we allow the effect of β k to vary by representation order according to a random walk process: β kt ~ N(β kt−1, 10). We set β 1t = 1 for the dynamic population threshold variable for all representation orders, ensuring that higher values of the latent variable indicate higher levels of urbanity. To fix the centre of the latent distribution, we set the electoral district with median values on all indicator variables to zero. We provide more information on the model, including detail on implementation and convergence, in the online supplementary material.
Our measurement model allows us to construct an urbanity measure that satisfies the criteria outlined above: it is built on a theoretically defensible, multiple-indicator conceptualization of urbanity; it enables systematic long-term comparison; and it produces a measure that includes not only a point estimate for each district but also a distribution of plausible urbanity scores. The uncertainty in our urbanity measure depends, appropriately, on the availability of the indicator variables; thus, uncertainty is higher in the earlier period, when fewer indicators are available.
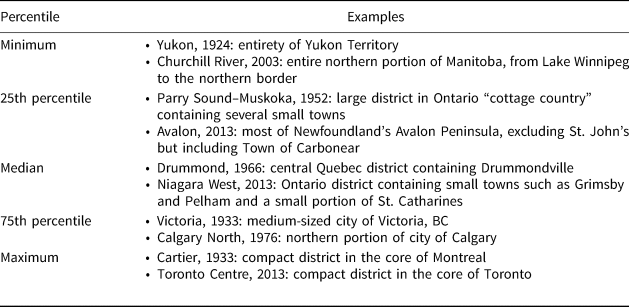
To provide a basic validity check on the results of our measurement model, Table 2 describes characteristic electoral districts at five points in the urbanity distribution. The minimum end of the distribution contains extremely large and sparsely populated northern districts, such as Churchill River, a district that in 2003 encompassed the entire northern portion of the Manitoba. At the 25th percentile, districts remain mostly rural but typically contain one or more small towns within their boundaries, such as the Ontario cottage country district of Parry Sound–Muskoka in 1952. Some settlements may fall below the dynamic population threshold or be unincorporated. At the median, we find geographically large districts containing larger towns (such as Drummondville in 1966) or small portions of cities (such as Niagara West in 2003). At the 75th percentile, districts have become recognizably urban, encompassing medium-sized cities such as Victoria, British Columbia, or the outlying portions of larger cities such as Calgary, Alberta. Finally, at the upper end of the distribution, we find compact districts in the cores of Canada's largest cities. Overall, this continuum from large rural districts through to compact urban districts suggests that our measure successfully captures differences in district urbanity over time and across geographic space. We provide additional detail on the urbanity measure, including overall distributions for each RO, in the online supplementary material.
Table 2 Representative Sample of Districts, by Urbanity Percentile
4.4 Assessing the urban-rural divide
Having constructed our measure of district urbanity for each federal electoral district in Canada, the final step was to join the urbanity measure with federal election results. We use a publicly available database of federal elections containing district-level results for every federal election in Canadian history.Footnote 8 Manually adding our unique federal electoral district identifier codes to the election results dataset enabled us to merge our district urbanity measure with district-level election results.Footnote 9
To assess the relationship between party vote share and district urbanity, we fit separate linear models for each major party and election, regressing district-level vote share on district urbanity; these models include region fixed effects to account for differing overall levels of urbanization across Canadian regions. We use Monte Carlo integration to propagate uncertainty in our district urbanity measure through these regression estimates, allowing for more robust estimates of the relationship between urbanity and electoral outcomes (Treier and Jackman, Reference Treier and Jackman2008).Footnote 10
To assess the relative importance of the urban-rural cleavage across time, we fit two multinomial logistic regression models for each election, with the winning party in each district as our dependent variable: a “base” model containing regional dummies, and an “urbanity” model adding the district urbanity measure. We then compare the models to assess the improvement in model fit provided by district urbanity. In these models, we account for uncertainty in the urbanity variable by fitting each of the multinomial logit models for 1,000 distinct draws from the posterior distribution of our measurement model. This allows us to assess the improvement in model fit across 1,000 plausible urbanity values for each district at each election.
5. Results
5.1 When do we see the urban-rural divide in Canada?
Figure 1 summarizes the relationship between district urbanity and party vote share for six major political parties from the 1896 election (the first held under the 1892 RO) to 2019. Each point in the figure represents a single election; points above the dotted horizontal line indicate a positive relationship between district urbanity and vote share (“urban advantage”), and points below the dotted horizontal line indicate a negative relationship (“rural advantage”). Shaded areas represent 95 per cent confidence regions. As noted above, these estimates are drawn from models that include region fixed effects to account for differing levels of urbanization in Canadian regions. The estimates thus capture an estimate of the expected within-region difference in vote share associated with variation in district urbanity. The results in Figure 2 can be interpreted as the expected change in a party's vote share associated with a one-unit shift in district urbanity; this measure ranges from a minimum value of –1.5 to a maximum value of +1.5, and a one-unit shift can most easily be interpreted as the expected change in vote share associated with a shift from a median district to a 75th percentile district in Table 2.
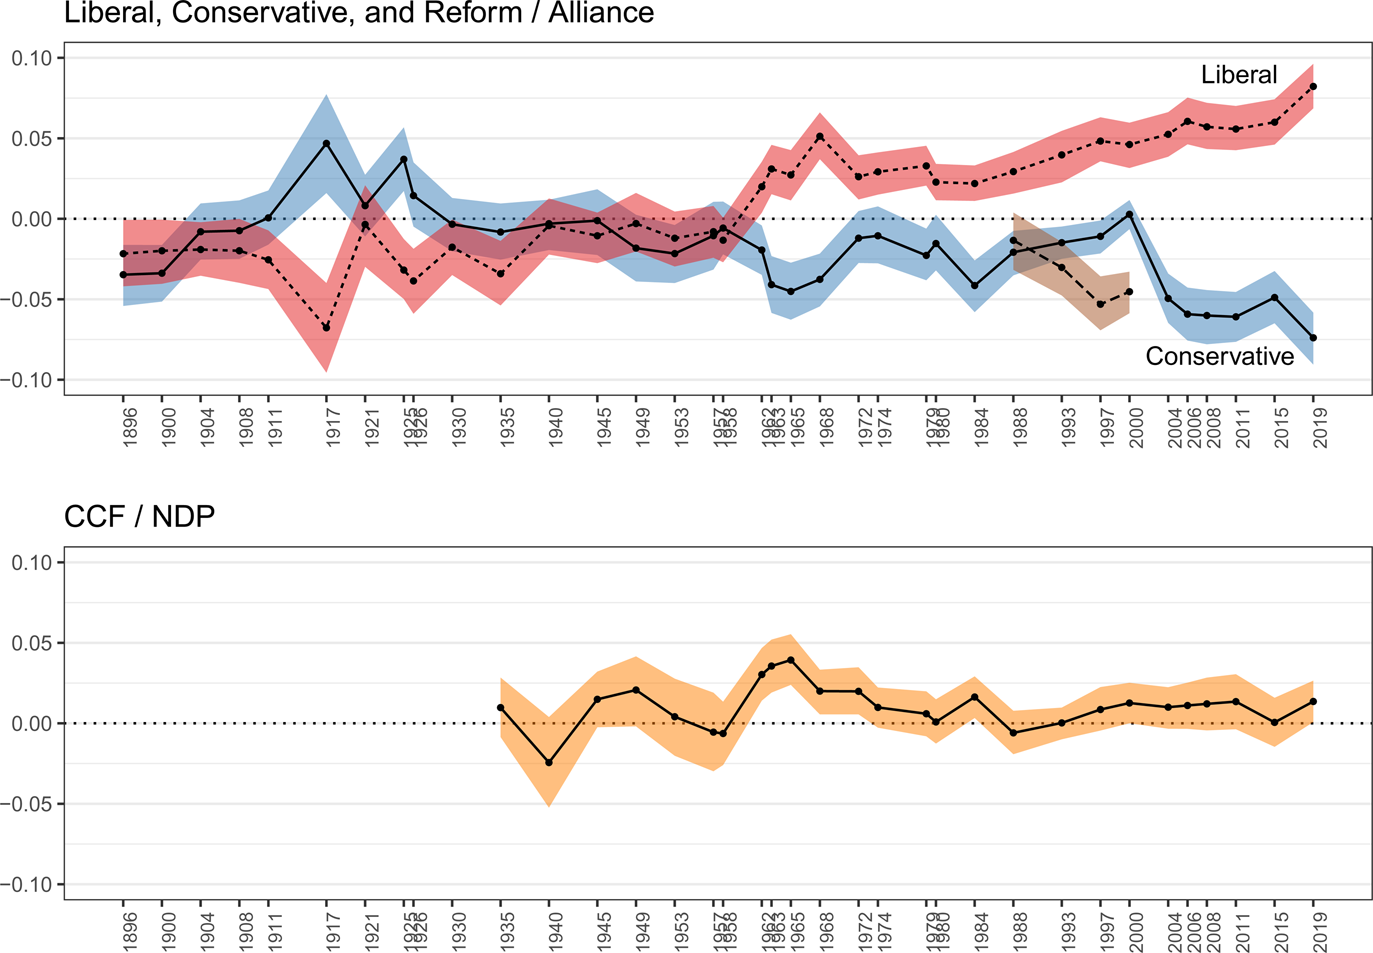
Figure 1 Urban/Rural Vote Share Advantages, by Party. Relationship between district vote share and district urbanity for each party and election. Positive values indicate urban advantage; negative values indicate rural advantage. Each coefficient is drawn from a district party-year regression model. Shaded areas represent 95% confidence regions.
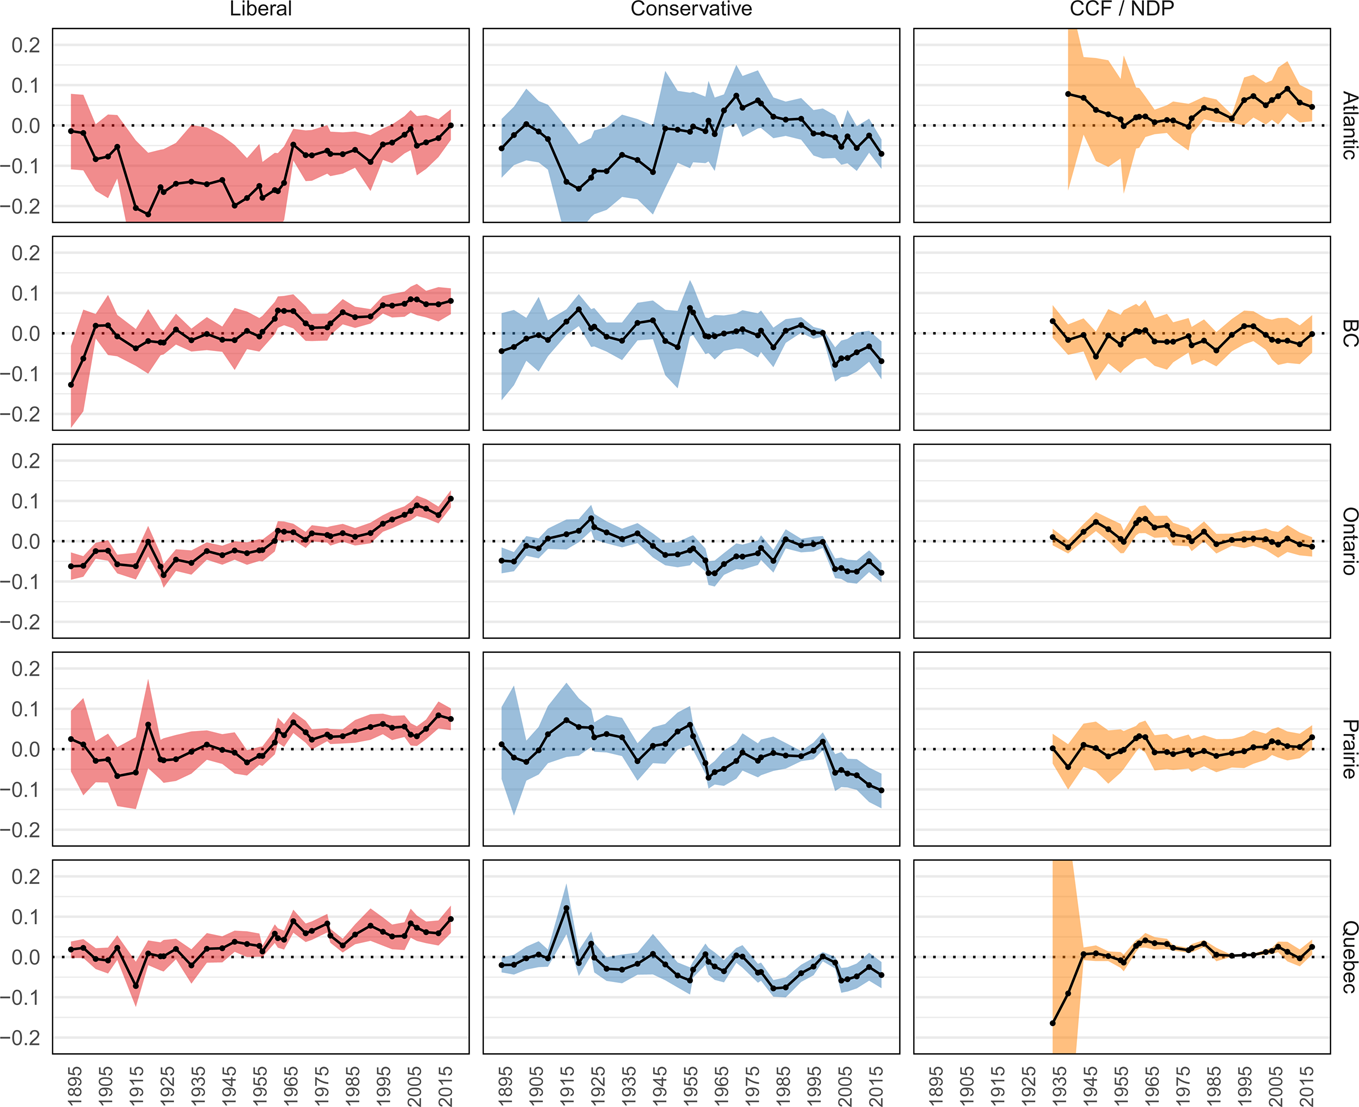
Figure 2 Urban/Rural Vote Share Advantages, by Party and Region. Relationship between district vote share and district urbanity for each party and election in each region. Each coefficient is drawn from a district party-year-region regression model. Shaded areas represent 95% confidence regions.
While there is much to absorb in Figure 1, we focus on a few general highlights. The earliest evidence for an urban-rural divide in support for the major parties emerges in the wartime election of 1917. It persists through the emergence and decline of the Progressive Party in the 1920s before disappearing. After this brief interwar divide, a null pattern persists until 1962, when the Liberal Party develops an enduring and substantively large urban advantage over the Conservative Party. After a particularly dramatic surge in urban support in Pierre Trudeau's first election as Liberal leader in 1968, the Liberal Party's urban advantage has grown steadily from the early 1970s to the present. By 2019, a one-unit shift in a district's urbanity score is associated with an increase of more than eight percentage points in Liberal Party vote share. This is an extraordinary gap between the Liberal Party's expected performance in rural districts and its performance in cities.
The Conservative Party's trajectory after 1962 is somewhat more complex than that of the Liberals, with increases and decreases in rural advantage associated with changes in party leadership and more general patterns of Conservative boom and bust. The Progressive Conservative Party enjoyed a clear rural advantage in the late Diefenbaker years, which faded during the Stanfield and Clark leadership periods. The rural advantage then returned in the 1980s, reflecting Brian Mulroney's success in Quebec's nationalist rural ridings. The rural advantage disappeared again during the Progressive Conservative Party's lean years in the 1990s, as the new Reform Party, Canadian Alliance and Bloc Québécois stole a substantial portion of its rural base. When the Canadian Alliance and Progressive Conservative parties merged before the 2004 election, the rural advantage reappeared in dramatic fashion and has remained very large ever since. Notice also that the trajectory of the Reform/Alliance party from 1988 to 2000—which is included in the top plot in Figure 1—provides the path that connects the Progressive Conservatives of the 1980s to the Conservative Party of the new millennium. In its rural advantage, at least, the figure testifies to the truth of Flanagan's (Reference Flanagan2009: x) remark that “the Conservative Party is the legitimate heir of Reform.”
The results in the bottom plot of Figure 1, which summarize the Co-operative Commonwealth Federation/New Democratic Party (CCF/NDP) trajectory, are equally interesting. For the party's first quarter century, the wide shaded orange region, consistently overlapping the dotted zero line, tells a story of a party whose support was drawn from both urban working-class districts and more rural agrarian and resource hinterlands. The CCF's struggle to break out of this pattern ultimately led to the NDP, which sought to project a new image of a more modern—and urban—labour party (Young, Reference Young1969). At first, this strategy was successful, as the NDP picked up a substantial urban vote share advantage in the 1962 election, its first under the new moniker, and retained that advantage for more than a decade. By 1974, however, the party's urban advantage disappeared, never to return.5.2 Where do we see the urban-rural divide in Canada?
To explore the regional trajectories of the urban-rural divide in Canada, Figure 2 repeats the analysis in Figure 1, but does so within five Canadian regions. The large size of the confidence regions in some parts of the county and time periods means that we must proceed with caution when interpreting these subsample results. Nevertheless, the figure reveals several important and interesting patterns. First, and perhaps most importantly, it suggests that the Liberal Party's increasing urban support from the early 1960s to the present is a pan-Canadian phenomenon. The timing of the Liberal Party's consolidation of an urban advantage varies by region—in Atlantic Canada, for instance, the Liberal Party actually enjoyed a rural advantage until quite recently—but the overall trajectory in each region is steadily upward. Outside Atlantic Canada, the Liberal Party has been favoured in urban districts for several decades.
Once again, the story for the Conservative Party is more complex, volatile and regionalized.Footnote 11 The regional breakdown clarifies the source of the urban-rural divide that briefly emerged in the 1917 election: the effect is most dramatic in Quebec, where Conservative support among Anglo-Montrealers was sufficient to secure the party's only Quebec riding. The Conservative Party's rural surge in Ontario, the Prairie provinces and Quebec during the Diefenbaker years is also visible in the figure, as is Mulroney's base of support in rural Quebec in the 1980s. Despite localized volatility, the regional Conservative Party results display an overall downward tendency since the end of the Second World War, with an especially sharp drop in the early 2000s.
As for the NDP, our results suggest that the overall lack of an urban or rural advantage for the CCF/NDP in Figure 1 above is not a function of different bases of support in different regions; large shaded regions and coefficients close to the zero line are particularly noticeable in British Columbia, the Prairies and Ontario. Only in Atlantic Canada does the NDP enjoy a clear urban advantage, owing to its strength as an urban labour party in cities such as St. John's and Halifax. In Quebec, the NDP's urban advantage through much of the twentieth century is a function of its more general weakness in that province; the party was surely happy to see this “advantage” disappear in 2011 with Jack Layton's breakthrough in many rural Quebec ridings.
5.3 How important is the urban-rural divide?
Thus far we have surveyed the long-term trajectories of urban and rural support for major parties. But how important is district urbanity for understanding which parties win or lose? Figure 3 provides a preliminary answer to this question, summarizing the improvement in model fit provided by the district urbanity variable when added to a model containing nothing but regional intercepts. We construct this figure by carrying out multinomial logistic regression models of the winning party in each district for each general election. Then we calculate the expected proportional reduction in error (ePRE) described by Herron (Reference Herron1999). We consider the two models M R and M R+U, the regional dummy and regional dummy plus urbanity models, respectively. From these two models, we then calculate the predicted probability for each of the j categories of the dependent variable: $p_j^{( R ) }$ and $p_j^{( {R + U} ) }$
 . We can then calculate the probability that y takes on its observed value $p_{[ y_i] }^{( R ) }$
 and $p_{[ y_i] }^{( {R + U} ) }$
 .Footnote 12 We then calculate the ePRE as
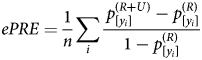
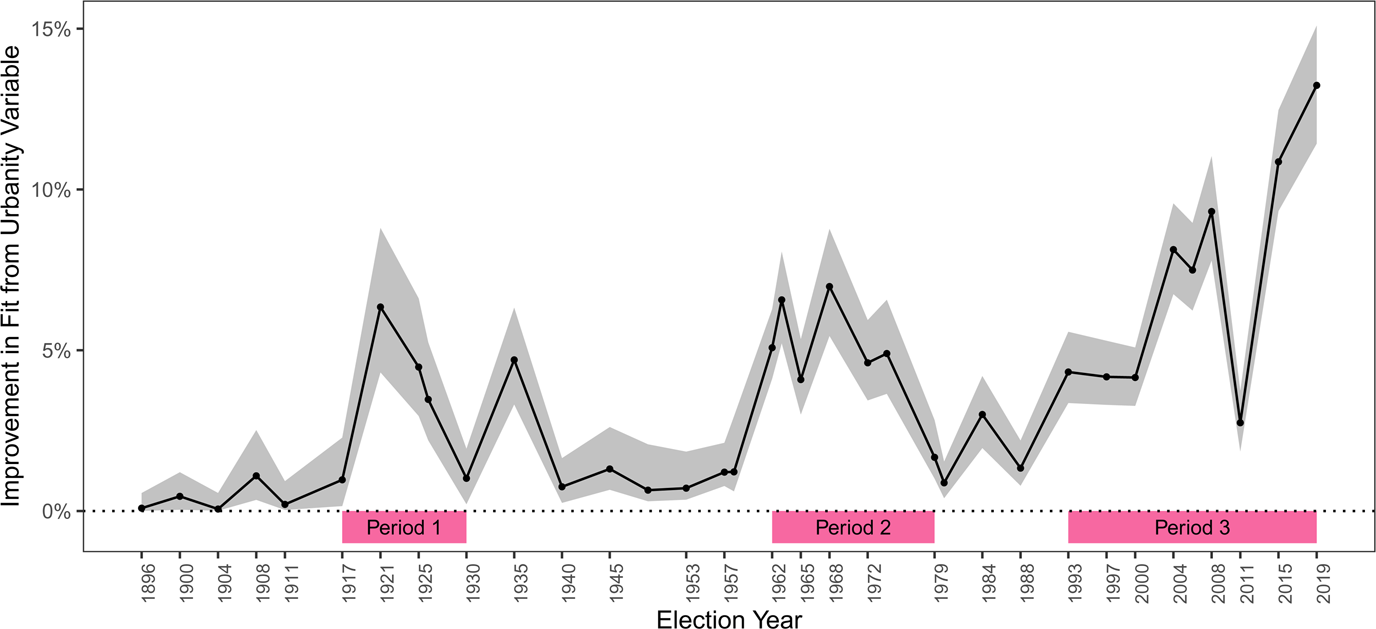
Figure 3 Improvement in Model Fit from Urban Variable, by Year. Improvement in model fit in a model with district urbanity and region indicators when compared with a model containing region indicators alone. Grey-shaded regions represent 95% probability regions.
The y-axis values in the figure give the extent to which predicted probabilities that y takes on its observed value increase as a function of adding urbanity to the model. The figure can be interpreted as follows: if the shaded region is entirely above the horizontal dotted line, we can be confident that we are looking at an election in which a district's urbanity improves the predictive capacity of the model. Small values, such as those indicated between the main periods of urban importance, indicate periods where the change in predicted probabilities is statistically different from zero but substantively very small.
The results in Figure 3 add additional richness and context to our discussion above. The patterns in the figure suggest that when we broaden our focus from major national parties to the larger array of parties elected to Canada's Parliament, the urban-rural divide has been especially important for understanding election outcomes in three distinct periods. The first period, from 1917 to 1926, covers the rise and fall of interwar agrarian political activism, with an additional surge in 1935 due to Social Credit's popularity in rural Canada. This urban-rural divide is at its peak during the period of the Progressive Party's success and its initial reabsorption into the Liberal Party in the early to mid 1920s.
The second period, as we have discussed above, represents the second half of the Diefenbaker era, beginning in 1962, when both the Liberal Party and the NDP enjoyed an urban advantage and the Conservative Party performed especially well in rural districts. This second period peaked quickly in 1963 and then declined gradually to the end of the 1970s—a decline that is generated by the disappearance of Social Credit, the diminishing urban advantage of the NDP, and the less rural character of Conservative support during the Robert Stanfield and Joe Clark years.
The third period, which begins in 1993 and continues up to today, follows the opposite trajectory. The period begins with the Reform and Bloc Québécois breakthroughs in 1993 and then surges upward with the consolidation of the Conservative Party prior to the 2004 election, after which the significance of the urban-rural divide has dramatically increased. With the exception of 2011 (in which the importance of the urbanity variable is moderated by two factors: the NDP's temporary sweep of rural Quebec and Conservative success in Ontario's suburban regions and smaller cities), the urban-rural divide has over the past 15 years been more valuable for understanding Canadian election outcomes than in any other period in Canadian history.Footnote 13
6. Discussion
The urban-rural divide, long recognized by comparative scholars as one of the core cleavages of modern democratic politics, is playing an increasingly important role in Canadian federal elections. Using novel data on Canadian federal electoral districts from 1867 to the present, we have developed a new measure of district urbanity for each of Canada's federal electoral districts, which we employ in this article to assess the long-term development of urban-rural cleavages in Canadian federal election outcomes. In general, our analysis points to the rise and fall of urban-rural divides over three distinct periods: a wave of agrarian politics and urban labour activism in the immediate aftermath of the First World War; a period of substantial electoral reconfiguration in the second half of the Diefenbaker era; and, most recently, a sharp increase in the urban-rural divide following the consolidation of the Conservative Party in 2004.
Several lessons—and many new questions—emerge from our results. For the moment, we wish to emphasize three particularly important findings for scholars of Canadian federal electoral politics. The first is the significance of the Diefenbaker era in general, and the elections of the early 1960s in particular, in setting a foundation for a postwar urban-rural cleavage that has persisted up to the present day. Political scientists in the early 1960s noticed the emerging urban-rural divide in the elections they were studying, and they occasionally speculated on how durable that divide would be in future elections (Alford, Reference Alford and Meisel1964; Irvine, Reference Irvine and Meisel1964; Meisel, Reference Meisel1962; Regenstreif, Reference Regenstreif1965). The answer, from a distance of nearly 60 years, is that the cleavage has proved to be very durable indeed: the Liberal Party has enjoyed a significant advantage in urban districts in every general election since 1962, and while Conservative rural support has been more variable, the urban-rural vote share divide between the two major parties has consistently been large and significant. Scholars of Canadian political development already recognize the importance of the Diefenbaker era in shaping the character of future Canadian federal elections (Johnston, Reference Johnston2017). The emergence of a durable urban-rural divide in this period must be recognized as a crucial dimension of this important reconfiguration.
Why did the elections of the early 1960s prove to be so important for the emergence of a persistent urban-rural cleavage? We hope to provide a more detailed answer to this question in future research; however, a preliminary survey of existing scholarship suggests that both “push” and “pull” factors were involved. On one side, Prime Minister Diefenbaker's identity as a small-town Prairie lawyer and his bitter criticism of business and media elites in Canada's big cities may have pushed professionals and wealthy voters in urban areas away from their traditional loyalties (Regenstreif, Reference Regenstreif1965). At the same time, a profound transformation inside the Liberal Party, in which a group of highly educated urban professionals came to play a leading role both as strategists and political candidates, appears to have increased the Liberal Party's appeal in the urban context (Meisel, Reference Meisel and Meisel1964; Regenstreif, Reference Regenstreif1965). These sociological shifts, combined with more immediate concerns among middle-class and wealthy voters about the Diefenbaker government's fiscal prudence, may help to explain the dramatic emergence of the urban-rural divide in the early 1960s. If correct, this explanation resembles arguments by Rodden (Reference Rodden2019) regarding the urbanization of postwar support for the Democratic Party, which he links to the rise of urban, well-educated “knowledge workers” with fiscally conservative and socially progressive attitudes.
A second important lesson we draw from our results in this article, which is closely related to the first, is that it is the Liberal Party that has consistently enjoyed an urban advantage in the postwar period. This seems to us a crucially important but overlooked aspect of the Liberal Party's dominance of the federal electoral landscape in the twentieth century. As Richard Johnston has astutely noted, each time the Liberal Party returned to power after a period of Conservative government, it returned weaker than it had been before (Johnston et al., Reference Johnston, Blais, Brady and Crête1992). Given this secular decline, how is it that the Liberal Party has continued to dominate federal electoral politics? The answer is undeniably complex and involves the national question, party divisions on the ideological right, and other factors, but our findings suggest that the Liberal Party's steady urban advantage after 1962 is an important ingredient in Liberal success.Footnote 14
To appreciate this point, consider the trend in Figure 4, which plots the distribution of district urbanity scores at each RO from 1952 to present (the grey density regions) as well as the average urbanity of the Canadian Parliament (the vertical black lines). The steady rightward shift of the vertical black lines tells a story of an increasingly urban legislature, and the increasing density at the rightward end of the distributions, combined with the emptying out of the leftward portion of the distributions, illustrates the increasing weight of urban districts in Parliament's overall composition. Enhanced urban representation is not simply the result of urbanization as a generalized national process. It is also produced by periodic parliamentary redistributions, which have allocated new seats almost entirely to growing urban areas, and to large metropolitan centres in particular. It may be no accident that the urbanization of parliamentary representation appears to have increased since Canada adopted independent electoral boundary commissions in the late 1960s. While variation in the population size of districts has favoured rural districts and small provinces, a party with a strong and growing vote share advantage in urban districts is in a strong position to win elections.
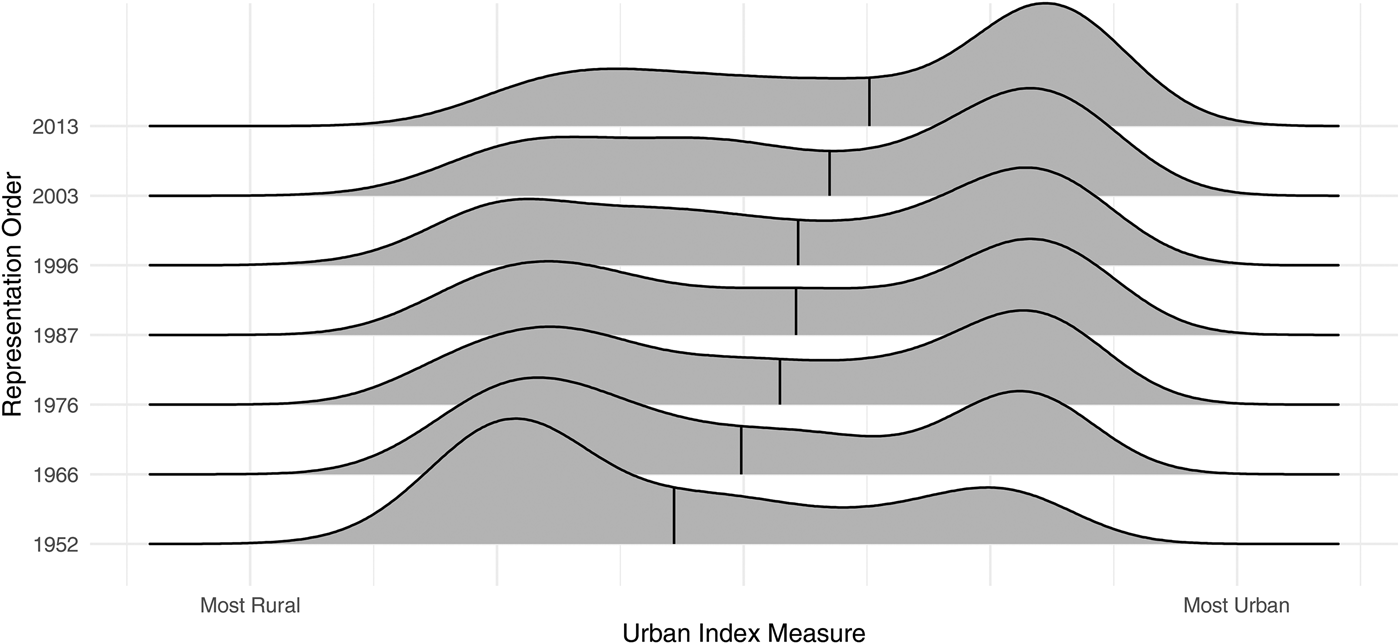
Figure 4 District Urbanity, 1952–2019. Distribution of district urbanity at each representation order (RO) from 1952 to the present. Vertical black lines within the distributions mark average district urbanity at each RO.
Our findings also shed light on the regional basis of the historical development of the NDP and its precursor. Today, the NDP is sometimes viewed as an urban party—the party of the latte and laptop crowd in city cores—that has lost touch with (rural) farmers and resource workers and (urban) organized labour that constituted its original coalition. Our analysis shows, however, that the NDP has not possessed a statistically significant advantage one way or the other nationally since the 1970s, and that this is true everywhere except Atlantic Canada, where the NDP has become a distinctly urban party. In light of Canada's single member plurality electoral system, the NDP appears to face a double disadvantage: not only is its support relatively diffuse across Canadian regions, it is also relatively diffuse across urban and rural ridings within regions, with support as likely in remote resource communities as in the heart of major cities.
Finally, and perhaps most obviously, our findings offer clear evidence that Canadians are currently experiencing the most profound urban-rural divide in support for the major political parties in the country's history. In no prior era has district urbanity been more clearly associated with election outcomes; nor has it ever been more firmly entrenched in the competition between the country's two historical governing parties, the Liberals and the Conservatives. The gap in party support between urban and rural districts is among the most important features of the contemporary Canadian political landscape.
7. Conclusion
Our purpose in this article has been to provide a descriptive foundation for a new research agenda on the role of urban-rural divides in the long-term development of Canadian federal electoral politics. By building a theoretically grounded measure of the urbanity of federal electoral districts spanning the entirety of post-Confederation history, we offer a novel historical portrait of the urban-rural divide in Canadian elections. We see substantial opportunity for future research to clarify and explain the findings outlined in this article.
Above all, political scientists should extend our big-picture findings by undertaking more focused studies of specific periods of Canadian political development, in order to better understand how and why urban-rural cleavages emerge and recede in Canadian federal politics. In the 1960s, for instance, did the urban-rural divide first emerge in party caucuses, reflecting a “caucus-first” process recently described in another context by Godbout (Reference Godbout2020), or do we see it first emerge in public attitudes and preferences, to which political parties then responded? For example, each of the three spikes in urbanity's importance to election outcomes correspond to periods of rapid urban growth and rising urban housing prices.Footnote 15 In-depth quantitative and qualitative studies of the 1950–1970 and 1990–2010 periods have the potential to enrich both our empirical and theoretical understanding of the development of political cleavages and of political institutions in Canada.
We must also investigate the representational consequences of the urban-rural divide in Canadian political institutions. For instance, our long-term measure of district urbanity enables an extension of Sayers’ (Reference Sayers2013) “city ministers” hypothesis to the full sweep of Canadian federal politics, reinvigorating earlier investigations of geographical representation in cabinet (Bakvis, Reference Bakvis1988). It will also allow us to assess the electoral consequences of widely differing levels of voting strength for urban and rural residents in Canada due to variation in district population, as well as assess how the adoption of nonpartisan boundary commissions has shaped the representation of urban areas in Canada's Parliament.
Further, our analysis enables investigation of the policy effects of the urbanization of representation in national institutions. If the relative urbanity of party caucuses and cabinets is consequential to Canadian political life, it should be detectable in political discourse and policy agendas. Employing our district urbanity indicator in analyses of policy documents, party platforms and parliamentary speech may unlock new understandings of the linkage between representation and governing agendas.
Finally, our analysis opens the door to investigation of other, interacting processes, such as the political salience of suburbanism. It is common in Canada and elsewhere to portray suburbanites as swing voters whose alliance with urban and rural blocs determines elections (Ibbitson, Reference Ibbitson2021). Walks (Reference Walks2013) usefully casts suburbanism as a way of life that is independent of the spaces with which it is often identified; that is, “suburban” lifestyles may be found in locations with both urban and rural objective characteristics. Further analysis would illuminate the political implications of the changing relationship between signifiers of suburbanity—home-ownership and automobile dependency, for example—and the urban-rural continuum.
Supplementary Material
To view supplementary material for this article, please visit https://doi.org/10.1017/S0008423921000792.
Acknowledgments
The authors are grateful to the following research assistants for their work on different aspects of this project: Moira Benedict, Tyler Girard, Christopher Hewitt, Amanda Miknev and Kandys Paterson. We are also grateful to Richard Johnston, Jean-François Godbout, Quinn Albaugh, and Daniel Sherwin for helpful comments on earlier versions of the manuscript.
Conflicts of Interest
To avoid a conflict of interest, the review process for this article was handled by Dr. David Peterson. The editors of the Canadian Journal of Political Science thank him for assisting us in this guest editor role.


 Open access