


Children with coordination difficulties are encountered relatively commonly in pediatrics. Incoordination of the limbs, poor balance, and unstable stance not caused by decreased level of consciousness, spasticity, muscle weakness, extrapyramidal movement disorder, skeletal disease, or psychogenic disorder constitute ataxia.Reference Poretti, Benson, Huisman and Boltshauser 1 Ataxia is caused by many disorders affecting the central or peripheral nervous system or both.Reference Salman, Lee, Tjahjadi and Chodirker 2 , Reference Brunberg 3
When a brain magnetic resonance image (MRI) is not available on urgent basis, a head computed tomography (CT) scan is useful in the assessment of acute and subacute ataxia, especially for excluding brain hemorrhage, hydrocephalus or brain tumours. However, a brain MRI is considered to be the most appropriate imaging modality in such patients.Reference Brunberg 3 - Reference Vedolin, Gonzalez, Souza, Lourenço and Barkovich 5
Several neuroimaging patterns have been described in disorders that cause ataxia.Reference Poretti, Benson, Huisman and Boltshauser 1 , Reference Mascalchi and Vella 4 - Reference Boddaert, Desguerre and Bahi-Buisson 6 Abnormal neuroimaging findings may be isolated to the cerebellum, involve supra- and infratentorial structures e.g. infantile neuronal ceroid lipofuscinosis or may affect the spinal cord e.g. Friedreich ataxia.Reference Brunberg 3 Infratentorial abnormalities usually affect the vermis with or without the cerebellar hemispheres. Brainstem abnormalities may be seen, especially in the pons e.g. congenital disorder of glycosylation type 1a.Reference Boddaert, Desguerre and Bahi-Buisson 6 Several types of neuroimaging abnormalities can be detected depending on the disease process including atrophy, hypoplasia, both atrophy and hypoplasia, infarct, hemorrhage, and dysplasia (disorganized development of infratentorial and sometimes supratentorial structures).Reference Boddaert, Desguerre and Bahi-Buisson 6 In some disorders, abnormal signal intensity within the cerebellum may add further clues to the diagnosis e.g. infantile neuroaxonal dystrophy.Reference Boddaert, Desguerre and Bahi-Buisson 6 Contrast enhancement may be noted in infective and inflammatory disorders e.g. multiple sclerosis.Reference Poretti, Benson, Huisman and Boltshauser 1 Calcification, best detected on head CT, may also aid in the diagnosis e.g. Cockayne syndrome.Reference Mascalchi and Vella 4
The neuroimaging findings in pediatric ataxia have mostly been described in reviews,Reference Poretti, Benson, Huisman and Boltshauser 1 , Reference Brunberg 3 , Reference Mascalchi and Vella 4 single case reports, or small case series rather than on a large cohort of pediatric patients. One study focused on posterior fossa imaging in children with ataxia.Reference Boddaert, Desguerre and Bahi-Buisson 6 No studies have systematically and comprehensively described neuroimaging findings in a large cohort of pediatric patients with chronic ataxia in Canada. Furthermore, there is minimal information on the value of repeat neuroimaging. The aims of this study were to systematically describe the spectrum of neuroimaging findings in a large cohort of pediatric patients with chronic ataxia to investigate their contribution in the assessment of these patients and to ascertain if any specific features (or lack of) can aid the assessment, diagnosis, or prioritize the list of diagnostic possibilities. In addition, the value of repeat neuroimaging was investigated. We hypothesized that normal or abnormal neuroimaging findings are valuable in the assessment of pediatric chronic ataxia and that repeat imaging may contribute important information for the diagnosis and management in some patients.
Methods
Previously, we identified patients who developed ataxia when they were less than 17 years old between 1991-2008, from several hospital resources and databases. We then selected patients with chronic ataxia only, which we defined as ataxia lasting longer than two months or if it was recurrent.Reference Salman, Lee, Tjahjadi and Chodirker 2 All patients attended Winnipeg Children’s Hospital for an assessment of their ataxia. Patients from neighboring provinces who attended Winnipeg Children’s Hospital were also included. Further information on the ascertainment of the patients is described in detail elsewhere.Reference Salman, Lee, Tjahjadi and Chodirker 2 We excluded patients whose ataxia was not clinically prominent and did not affect their daily life. Patients with ataxia caused by primary brain tumours, disorders of the peripheral nerves and vestibular system only were excluded, as were patients with developmental coordination disorder or clumsiness. Details on the epidemiology, ethnicity, and geographic distribution of the cohort have been published.Reference Salman, Lee, Tjahjadi and Chodirker 2 , Reference Salman, Masood, Azad and Chodirker 7
Ethical approval for the study was given by the Research Ethics Board of the University of Manitoba. Demographic information, diagnostic data, and neuroimaging reports were retrieved from the patients’ hospital medical charts as described previously.Reference Salman, Lee, Tjahjadi and Chodirker 2 In addition, neuroimaging studies including head CT and, where available, brain and spinal MRI, were also retrieved and systematically reviewed by a pediatric radiologist with expertise in pediatric neuroimaging (MB). Clinical details were concealed from the radiologist. Brain MRI was acquired on 1.5- or 3-Tesla MRI scanner (GE) using standardized protocol with sagittal T1-weighted, axial/coronal T2-weighted, and coronal fluid-attenuated inversion recovery (FLAIR) images. Supplemental imaging sequences were performed as needed including T2*, DWI, ADC maps, fast spoiled gradient echo (FSPGR) images, and MRA (magnetic resonance angiography). Contrast with gadolinium was given at the discretion of the radiologist. The presence of cerebellar hypoplasia (small size but normal shape), atrophy (shrunken size with prominence of the cerebellar folia), malformation (e.g. Dandy-Walker malformation, molar tooth sign), other structural abnormalities, and signal abnormalities in the cerebellar vermis, cerebellar hemispheres, brainstem, and supratentorial structures including the cortex and white matter, basal ganglia and thalami were recorded.
The frequencies and types of the first and repeat imaging modalities were described for the different disease etiologies. The diagnostic utility of neuroimaging was grouped as follows on retrospective review: A) Extremely helpful because it was diagnostic, B) very helpful in narrowing down the list of diagnostic possibilities but not for making a definitive diagnosis, C) was of limited diagnostic usefulness by revealing important but non-diagnostic abnormalities, and D) not helpful in the diagnosis. Neuroradiological changes on repeat neuroimaging were classified into five categories: Stable (no change), better, worse, fluctuating, or unknown.
Age at first neuroimaging and time period between the first two neuroimaging studies were calculated for each disease etiology. Statistical analyses were conducted using a Statistical Package for the Social Sciences (SPSS) version 22 (IBM, Armonk, NY, USA). Mean and standard deviation were used to describe normally distributed data while median and range were used if the data were skewed.
Results
Basic demographics
The cohort of patients with chronic ataxia who satisfied the inclusion criteria consisted of 184 patients (males=92). The median age (range) at any symptom onset was 1.3 (0-16) years. The median age (range) at the end of the study was 15 (1-34) years. Detailed demographic information has already been published on this cohort.Reference Salman, Lee, Tjahjadi and Chodirker 2 Selected presenting symptoms in some of the more common diseases are displayed in Table 1. Four hundred and forty one neuroimaging studies were performed on 177 patients (MRI=343, CT=98). Nineteen patients had head CT only, 103 brain MRI only, and 55 had both. Neuroimaging studies in 130 of the 177 patients were reviewed by the radiologist (MB). In the other 47, neuroimaging findings were extracted from the neuroimaging reports because their imaging studies were not available. The type of neuroimaging and age at first imaging are reported in Supplementary Table 1, which shows that the median age at first imaging varied within and across the different etiologies. Neuroimaging was performed at an earlier age in patients with Angelman syndrome, mitochondrial disorders, and neuronal ceroid lipofuscinosis types 1-3 at one to three years of age; a few years later in ataxia telangiectasia, Rett syndrome, and leukodystrophy; and towards the end of the first decade in Friedreich ataxia.
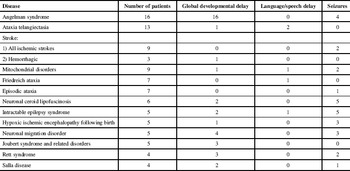
Table 1 Selected presenting symptoms in some of the more common diseases
The disorders encountered were divided into eight categories (Supplementary Table 2) : Metabolic diseases (generally caused by enzyme deficiency or transporter defect) (nine disorders), genetic diseases (fifteen disorders), diseases caused by impaired DNA repair (two disorders), intractable epilepsy (one disorder), stroke (six disorders from different causes), inflammatory diseases (three disorders), other acquired diseases (four disorders), and unknown (five subcategories based on the clinical manifestations).
General neuroimaging findings
Neuroimaging abnormalities in the cerebellum or other brain regions such as the cerebral hemispheres were described in our cohort with chronic ataxia. Neuroimaging findings varied both within and among the various disease etiologies. Brain MRIs of adequate quality for the evaluation of myelin was available in 120 of the 130 patients, whose neuroimaging was reviewed. Myelination was normal in at least 96 patients. Delayed myelination, hypomyelination, or abnormal myelin/ demyelination was seen in the rest and also in some of the patients with normal myelination, due to various disease processes including inflammation, ischemia, neurodegeneration, radiotherapy, and neoplasia. Supplementary Table 2 summarizes the neuroimaging findings of the disorders encountered in our cohort.
Details on the diagnostic utility of neuroimaging is shown in Supplementary Table 3. Neuroimaging was helpful to a varying extent in 73 patients belonging to the first seven disease categories described above (totaling 30 disorders): A) Imaging was extremely helpful because it was diagnostic in nine diseases (four genetic disorders, five different disorders causing acute stroke with sequelae), B) imaging was very helpful in narrowing down the list of diagnostic possibilities but not for making a definitive diagnosis in 14 diseases (four metabolic disorders, three genetic diseases, one type of stroke, two inflammatory diseases, four acquired disorders), C) imaging was of limited diagnostic usefulness by revealing important but non-diagnostic abnormalities in seven diseases (two disorders caused by impaired DNA repair, four genetic diseases, one inflammatory disease).
There were some patients who did not have diagnostic findings on their neuroimaging despite having disorders with previously well-described neuroimaging abnormalities. Indeed, in five of the 30 disorders where neuroimaging was deemed helpful in our study, there were 13 patients whose neuroimaging was either normal or showed abnormalities not contributing to the diagnosis (Supplementary Table 3).
Neuroimaging was not directly helpful in 36 patients with 10 diseases (five metabolic diseases, four genetic diseases, and one in the intractable epilepsy category) (Supplementary Table 3).
In addition, neuroimaging was not helpful (by definition) in 55 patients whose diagnosis was unknown at the end of our study period, despite extensive investigations available at the time of their assessment. Forty of the 55 patients had a non-progressive disease course. The other 15 patients had intermittent ataxia (N=6), progressive ataxia with or without developmental regression (N=7), or self-limiting ataxia that lasted for several months (N=2). The 40 patients with the non-progressive course were divided into six mutually exclusive subgroups depending on the presence or absence of developmental delay, pyramidal tract signs, and epilepsy as described previously.Reference Salman, Masood, Azad and Chodirker 7 Their neuroimaging features were variable overall and also within their respective clinical subgroups. Some had normal imaging, while others had cerebellar hypoplasia, or progressive cerebellar atrophy despite the absence of clinical progression. Similarly, variable neuroimaging features were noted in the 15 patients of 55 patients with unknown diagnosis (Supplementary Table 2).
Neuroimaging review resulted in etiological re-classification of seven patients from our original cohort following the discovery of neuroimaging findings that were not fully appreciated previously,Reference Salman, Lee, Tjahjadi and Chodirker 2 or following the re-evaluation of previously described findings. These seven patients had stroke, neuronal migration abnormalities, leukodystrophy, and Joubert syndrome related disorders (JSRD).
Repeat neuroimaging
Repeat neuroimaging (MRI=288, CT=84) was performed once or more in 108 of 177 (61%) patients based on clinical indication (Supplementary Table 4). The median time between the first two scans was 1.2 years (range: same day-21.4 years). The types of the first two scans were as follows: Fifty three patients had MRI scan first followed by another MRI after a median of 1.9 years (range: 2 days-8.2 years), 39 had CT first followed by MRI after a median of 0.8 years (range: same day-21.4 years), 11 had CT first followed by another CT after a median of 1.5 years (range: 1 day-9 years), and five had MRI first followed by CT after a median of 0.7 years (range: 14 days-7.3 years).
Among disease etiologies with at least five patients who had repeat neuroimaging, all (or almost all) patients with stroke, mitochondrial disorder, neuronal ceroid lipofuscinosis, intractable epilepsy, and hypoxic ischemic encephalopathy at birth had repeat neuroimaging, mostly MRI; while a smaller proportion of patients with Angelman syndrome (6 of 15 who had imaging) and ataxia telangiectasia (6 of 11 who had imaging) had repeat neuroimaging.
The time period between the first two scans varied among the different etiologies (Supplementary Table 5). Patients with stroke and neuronal ceroid lipofuscinosis had repeat neuroimaging sooner (median times of 0.4 and 0.85 years respectively); while patients with mitochondrial disorder, Angelman syndrome, ataxia telangiectasia, and intractable epilepsy had their neuroimaging later (median times ranging between 1.05 and 2.32 years); and finally patients with and hypoxic ischemic encephalopathy at birth had their repeat neuroimaging after a median period of 4.64 years (Supplementary Table 5).
Repeat neuroimaging showed no changes in 41 patients, improvement in nine, worsening in 23, fluctuating changes in eight, and was unknown in 27 (Supplementary Table 4). In patients with progressive disorders e.g. ataxia telangiectasia, repeat neuroimaging showed no changes or worsening; while in neuronal ceroid lipofuscinosis, leukodystrophy, and Friedreich ataxia worsening on repeat neuroimaging was uniformly seen. In patients with stroke and mitochondrial disorders, changes on neuroimaging were more variable with some showing improvement or no changes, while in others worsening was noted. In patients with non-progressive clinical disorders such as JSRD, hypoxic ischemic encephalopathy at birth, neuronal migration disorder, or in patients with Rett syndrome, and several other rare genetic and metabolic disorders, imaging features were generally stable on repeat imaging.
Neuroimaging findings in specific diseases
There were 16 patients with Angelman syndrome. Delayed myelination was described in three. Thirteen patients had ataxia telangiectasia. Three presented with brain tumours and three had cerebellar atrophy. Nine patients had ischemic stroke associated with chronic ataxia from multiple causes (Supplementary Table 2). Typical imaging features consistent with infarcts were found in brain regions supplied by the posterior cerebral circulation (Figure 1). In addition, two other patients had ischemic thrombo-embolic infarcts due to pneumococcal septicemia and cardiomyopathy in association with Friedreich ataxia. One patient with Gaucher disease type 3 had a small hemorrhage (not related to the patient’s ataxia) caused by a small cavernoma in the left caudate head.
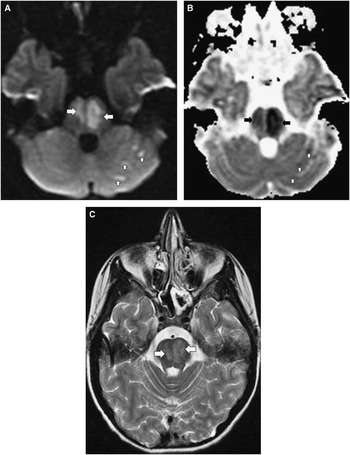
Figure 1 Brain MRI of a 16-year old female with pontine and left cerebellar hemisphere infarction. A) Axial DWI (TR 8000, TE 79, slice thickness 5 mm) and B) Axial ADC map (TR 8000, TE 79, slice thickness 5 mm) show hyperintense signal abnormalities in the pons, left more than right (horizontal arrows) and in few patchy areas in the left cerebellar hemisphere (vertical arrows) in (A) with matching abnormalities in (B). The findings represent restricted diffusion due to cytotoxic edema and are consistent with ischemic arterial infarction in the distribution of the perforating pontine branches of the basilar artery and left posterior inferior cerebellar artery territories. C) Axial T2WI (TR 2317, TE 13, slice thickness 6 mm) shows hyperintense signal abnormality in the pons (arrows).
The nine patients with mitochondrial disorders had abnormalities in respiratory chain enzyme complexes I (one), IV (one), or both I and IV (two), pyruvate carboxylase deficiency (one), MELAS (mitochondrial encephalomyopathy, lactic acidosis and stroke-like episodes) (one), Leigh syndrome (one), Alpers disease (one) (Figure 2), and an uncharacterized mitochondrial disorder (one). MRI was normal in one and abnormal in the rest with hyperintense signal abnormalities in several brain regions including cerebral white matter and cortical and deep grey matter on T2-weighted images (Supplementary Table 2).
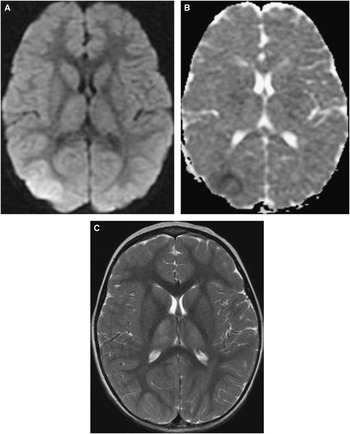
Figure 2 Brain MRI in a 30-months old girl with Alpers disease (progressive neuronal degeneration of childhood). A) Axial DWI (TR 8000, TE 79.9, slice thickness 5 mm) and B) Axial ADC map (TR 8000, TE 79.9, slice thickness 5 mm) show hyperintense signal abnormality in the right parieto-occipital lobe region in (A) with matching abnormality in (B). The findings represent restricted diffusion and are consistent with stroke-like lesion. C) Axial T2WI (TR 2350, TE 111.4, slice thickness 6 mm) shows hyperintense signal abnormality in the thalami. Atrophy of the thalami was seen on subsequent scans (not shown).
Seven patients had Friedreich ataxia, three of whom had spinal cord atrophy (Figure 3). Six patients had neuronal ceroid lipofuscinosis types 1-3 (Supplementary Figure 1, Supplementary Table 2). Diffuse brain atrophy and progressive imaging changes were seen in five patients. There were five patients with neuronal migration disorders causing diffuse or focal e.g. parietal-occipital lobes pachygyria or polymicrogyria (Supplementary figure 2). Neuroimaging was not diagnostically helpful in the five patients with intractable epilepsy. Abnormalities in signal intensity, restricted diffusion, and atrophy were seen in the cerebral white and grey matter, suggestive of cytotoxic edema with or without vasogenic edema.
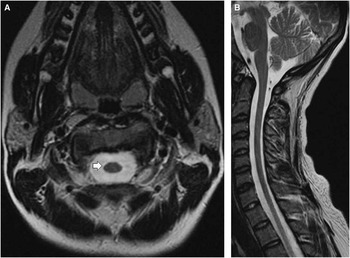
Figure 3 Spinal cord MRI of a 16-year old female with Friedreich ataxia. A) Axial T2WI of the cervical spinal cord (TR 5967, TE 114.2, slice thickness 5.5 mm) and B) Midsagittal T2WI of the cervical and upper thoracic spinal cord (TR 3617, TE 112, slice thickness 4 mm) show thinning of the spinal cord consistent with atrophy, which is more easily appreciated on the axial image (arrow) in (A).
Four patients had Salla disease and all showed hypomyelination (Supplementary figure 3). Five patients had a JSRD. All had the molar tooth sign on MRI (Supplementary figure 4).
Table 2 shows important MRI features that may give the clinician clues in the diagnosis of patients with chronic ataxia. The list is not comprehensive and is based on the various diseases encountered in our cohort. Of interest is that hypointense signal abnormalities in the thalami and globi pallidi were seen in patients with neuronal ceroid lipofuscinosis, while hypointense signal abnormality in the thalami associated with hyperintense signal abnormality in the basal ganglia were seen in the single patient with post-radiation ataxia.
Table 2 Diagnostic MRI clues in diseases associated with pediatric chronic ataxia
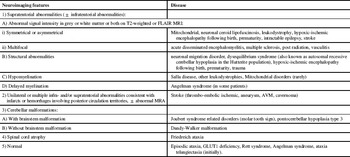
FLAIR=fluid-attenuated inversion recovery; MRI=Magnetic resonance imaging, MRA=magnetic resonance angiography, AVM=arteriovenous malformation
Discussion
Following a detailed clinical assessment of patients with ataxia, the next step is usually neuroimaging. Neuroimaging is essential in excluding diseases amenable to treatment that may present with ataxia such as posterior fossa tumour, hemorrhage, abscess, or hydrocephalus.
The neuroimaging abnormalities seen in our cohort revealed that pediatric chronic ataxia is associated not only with abnormalities in the cerebellum but also with abnormalities in several other brain regions such as the cerebral hemispheres. This could reflect the widespread connectivity of cerebellar neural networks. Neuroimaging review resulted in few etiological re-classification of the original diagnoses; specifically strokes, neuronal migration disorders, leukodystrophy, and cerebellar malformations. This is not surprising since significant advances in neuroimaging techniques and medical knowledge has taken place since 1991, the start date of the current investigation.
Normal or non-specific abnormalities on initial neuroimaging
Having a normal MRI can be helpful since it excludes disorders belonging to several disease categories that are associated with ataxia e.g. brain malformations, demyelination, or hemorrhages. In addition, a normal conventional MRI (or one with non-specific findings) is useful, especially when it remains normal on repeat imaging, since it is mostly associated with certain genetic diseases that cause chronic ataxia e.g. Rett syndrome, Angelman syndrome, Glut1 deficiency, and episodic ataxia type 2. This is consistent with findings reported in other studies.Reference Poretti, Benson, Huisman and Boltshauser 1 , Reference Poretti, Wolf and Boltshauser 8 - Reference Dunn and MacLeod 10 In episodic ataxia type 2 cerebellar atrophy may develop in some patients, usually beyond the pediatric age group.
It is worth noting that delayed myelination and increased ventricular size on brain MRI in children with Angelman syndrome, the commonest etiology in our cohort, has been reported previously.Reference Harting, Seitz and Rating 9 A few of our patients with Angelman syndrome had these so-called ‘non-specific findings’. Some patients with Rett syndrome have been reported to show cerebral atrophy or mild cerebellar tissue loss on conventional MRI, which was confirmed on volumetric MRI studies.Reference Dunn and MacLeod 10 This was not seen in our two patients with Rett syndrome with repeat brain MRI.
A normal MRI was seen in the early course of some patients with ataxia telangiectasia. This should be kept in mind when assessing young children presenting with ataxia or dystonia, who in their early disease course may not have developed telangiectasia or abnormalities in saccade initiation that usually give away their ataxia telangiectasia diagnosis. Cerebellar atrophy is documented to appear later in the course of the disease,Reference Poretti, Wolf and Boltshauser 8 as we observed on repeat imaging in some of our patients.
In addition, normal or non-specific abnormalities on initial neuroimaging may be seen in diseases that are usually known to have helpful diagnostic neuroimaging features, e.g. in mitochondrial disorders. This may be due to the variable nature of disease manifestation or severity among patients or may occur when neuroimaging is done early in the course of the disease. A repeat MRI is warranted when the index of suspicion is high.
Microscopic lesions are beyond conventional MRI resolution. Hence, extensive Purkinje cell dropout may not result in cerebellar abnormalities on MRI.
Neuroimaging abnormalities in pediatric chronic ataxia
A Swedish study published in 1996 on 78 children with non-progressive ataxia,Reference Esscher, Flodmark, Hagberg and Hagberg 11 revealed that 61% of 70 children with adequate neuroimaging had normal scans. However, twenty-nine patients had CT scan only. The authors stated that MRI added new information only when the CT showed an abnormality. However, we are aware of many instances, where a CT scan missed abnormalities that were only seen on an MRI performed within hours of the CT, such as demyelinating lesions or cerebellar vermis hypoplasia. The abnormalities reported in the Swedish study and few other studies,Reference Boddaert, Desguerre and Bahi-Buisson 6 , Reference Gleeson, Keeler and Parisi 12 - Reference Kanekar and Gent 15 revealed similar neuroimaging abnormalities seen in our patients with non-progressive ataxia including neuronal migration disorders, JSRD, Dandy-Walker malformation, cerebellar hypoplasia, and nonspecific findings such as arachnoid cysts and mega cisterna magna.
The neuroimaging pattern in patients with ataxia telangiectasia,Reference Mascalchi and Vella 4 , Reference Poretti, Wolf and Boltshauser 8 , Reference Al-Maawali, Blaser and Yoon 14 , Reference Anheim, Fleury and Monga 16 Friedreich ataxia,Reference Vedolin, Gonzalez, Souza, Lourenço and Barkovich 5 , Reference Poretti, Wolf and Boltshauser 8 , Reference Anheim, Fleury and Monga 16 and the various subtypes of mitochondrial diseases,Reference Vedolin, Gonzalez, Souza, Lourenço and Barkovich 5 , Reference Boddaert, Desguerre and Bahi-Buisson 6 , Reference Poretti, Wolf and Boltshauser 8 , Reference Al-Maawali, Blaser and Yoon 14 , Reference Rasalkar and Chu 17 stroke,Reference Rasalkar and Chu 17 especially those involving posterior fossa structures,Reference Poretti, Benson, Huisman and Boltshauser 1 , Reference Mascalchi and Vella 4 , Reference Mackay, Prabhu and Coleman 18 , Reference Yock-Corrales, Mackay, Mosley, Maixner and Babl 19 neuronal ceroid lipofuscinosis,Reference Poretti, Wolf and Boltshauser 8 , Reference Al-Maawali, Blaser and Yoon 14 hypoxic ischemic encephalopathy,Reference Rasalkar and Chu 17 Salla disease,Reference Poretti, Wolf and Boltshauser 8 , Reference Steenweg, Vanderver and Blaser 20 adrenoleukodystrophy,Reference Vedolin, Gonzalez, Souza, Lourenço and Barkovich 5 , Reference Poretti, Wolf and Boltshauser 8 prematurity,Reference Rasalkar and Chu 17 , Reference Limperopoulos and du Plessis 21 acute disseminated encephalomyelitis (ADEM),Reference Poretti, Benson, Huisman and Boltshauser 1 multiple sclerosis,Reference Poretti, Benson, Huisman and Boltshauser 1 and uncommon syndromes such as Marinesco-Sjögren syndrome,Reference Vedolin, Gonzalez, Souza, Lourenço and Barkovich 5 , Reference Poretti, Wolf and Boltshauser 8 autosomal recessive cerebellar hypoplasia in the Hutterites population (dysequilibrium syndrome),Reference Boycott, Flavelle and Bureau 22 pontocerebellar hypoplasia type 3,Reference Rajab, Mochida and Hill 23 post infectious ataxia (associated only rarely with cerebellar atrophy),Reference Poretti, Wolf and Boltshauser 8 post traumatic ataxia,Reference Poretti, Wolf and Boltshauser 8 and post radiation ataxia,Reference Poretti, Wolf and Boltshauser 8 have been described previously. Patients in our cohort with these diagnoses displayed similar findings (Supplementary Table 2). In general, abnormal signal intensity on brain MRI involving the supratentorial regions tends to point to a metabolic or an inflammatory etiology, while a normal brain MRI points to genetic or rare metabolic disorders.
Patients with severe intractable epilepsy had no specific diagnosis despite multiple investigations. All had multiple types of seizures that at times occurred on daily basis. All had developmental delay and/ or learning difficulties. Their clinical course was consistent with an epileptic encephalopathy. Their ataxia was present during periods of good seizure control. None had brain malformations or neuronal migration disorders on MRI. Their brain MRI showed non-diagnostic abnormalities that may or may not be related to their frequent seizures or underlying disease. Reversible and irreversible MRI findings similar to those reported in our patients including signal intensity changes, restricted diffusion, atrophy, or structural abnormalities have been described in patients with severe epilepsy and status epilepticus.Reference Cianfoni, Caulo and Cerase 24 - Reference Johnston, Smyth and McKinstry 26
The typical MRI features described in patients with Wernicke encephalopathy, i.e. abnormal signal intensity over the medial thalami, mammillary bodies, tegmentum, periaqueductal and tectal plate,Reference Mascalchi and Vella 4 , Reference Cerase, Rubenni and Rufa 27 are not universally seen in these patients.Reference Cerase, Rubenni and Rufa 27 Our single patient with Wernicke encephalopathy did not have these abnormalities either.
Repeat neuroimaging
Indications for repeat neuroimaging were variable and depended on clinical need. Repeat neuroimaging was helpful in monitoring disease evolution and progression over time by revealing changes in previous findings or showing new findings e.g. cerebral and cerebellar atrophy in neuronal ceroid lipofuscinosis, cerebellar atrophy in ataxia telangiectasia, and demyelinating lesions in multiple sclerosis, which were not necessarily associated with clinical progression. In some instances repeat neuroimaging provided further assurance to the physician and family; for example, by revealing improvement in patients with central nervous system vasculitis following immunosuppressive treatment, resolution of brain hemorrhage in cavernoma, or by confirming a stable neuroimaging course in hypoxic ischemic encephalopathy following birth, Chiari 1 malformation, and some genetic syndromes. The timing of repeat neuroimaging was variable. Repeat neuroimaging should be tailored individually.
Study limitations
Our retrospective study limitations include missing, incomplete and inaccurate information recorded in the hospital charts. Actual neuroimaging studies were not available despite extensive search in 47 of 177 patients. These were mostly from patients who presented in the early 1990’s. In addition, 19 patients from the earlier study period only had CT imaging performed, which is not ideal for imaging the brain because of its inferior spatial resolution, especially for posterior fossa structures in comparison to brain MRI. Additional limitations include the variable MRI sequences used over the study period and the long time range of the study during which many medical advances and discoveries were made, as discussed elsewhere.Reference Salman, Lee, Tjahjadi and Chodirker 2 Although the age range of the cohort at the end of the study period is wide, all patients were in the pediatric age range when they developed ataxia.
Conclusions and future directions
Central nervous system imaging with MRI is very valuable and important investigation in the assessment of pediatric chronic ataxia. Consideration should be given to repeating MRI in patients with chronic ataxia who remain without a diagnosis despite appropriate clinical evaluation and investigations.
Other more advanced neuroimaging modalities have been widely utilized in patients with ataxia and/ or cerebellar disorders, e.g. functional MRI, diffusion tensor imaging (tractography), positron emission tomography and single-photon emission computed tomography.Reference Mascalchi and Vella 4 , Reference Baldarçara, Currie and Hadjivassiliou 28 However, their role has not been fully evaluated and their routine use is not recommended, since their contribution to the management of individual patients with cerebellar disorders remains unclear.Reference Brunberg 3 , Reference Baldarçara, Currie and Hadjivassiliou 28 They may be helpful in certain circumstances, for example inflammatory or paraneoplastic disorders of the cerebellum.Reference Mascalchi and Vella 4 , Reference Baldarçara, Currie and Hadjivassiliou 28 The role of diffusion tensor imaging is currently being evaluated and its future potential appears promising especially in patients with posterior fossa malformations.Reference Chokshi, Poretti, Meoded and Huisman 29
Future studies should investigate patients with non-progressive chronic ataxia, who remain without a diagnosis despite extensive investigations, using whole exome sequencing if their microarray test is negative. Furthermore, more research is needed in ataxic patients with non-progressive disease course but who show progressive cerebellar atrophy pattern on MRI.
Acknowledgements and Grant Support
The authors thank the Health Science Centre Foundation and Branden’s Hope Fund for their financial support; The Children’s Hospital Research Institute of Manitoba and The Children Hospital Foundation of Manitoba for providing the infrastructure needed for the project and for financial support; Dr. S. Masood for performing part of the data collection and Dr. A. Poretti for his critical review of the manuscript.
Disclosures
Michael Salman, Bernard Chodirker, and Martin Bunge do not have anything to disclose.
Supplementary Material
To view supplementary material for this article, please visit http://dx.doi.org/10.1017/cjn.2016.7


