


Introduction
The historic environment is a generic and inclusive term that encapsulates the landscape and all places within it that are considered to be heritage. The historic environment is therefore a palimpsest, constantly evolving through the dual processes of change and creation (Bradley et al. Reference Bradley, Buchli, Fairclough, Hicks, Miller and Schofield2004). As such, this environment carries meaning and plays a crucial role in developing a sense of place, identity and belonging for its occupants (Avrami et al. Reference Avrami, Mason and de la Torre2000; Council of Europe 2000; 2005; Gibson & Pendlebury Reference Gibson, Pendlebury, Gibson and Pendlebury2016; Ireland & Schofield Reference Ireland and Schofield2015; Jones Reference Jones2017; Pearson Reference Pearson1995; Schofield Reference Schofield and Schofield2014; Stephenson Reference Stephenson2008; Tuan Reference Tuan1990; West Reference West and West2010). Furthermore, it is a repository of collective and individually held values. These values create communities (‘heritage communities’, after Council of Europe 2005) of shared perceptions, experiences, life histories, beliefs and traditions. Values are therefore routinely ascribed by people to their familiar landscapes, neighbourhoods and places based on the ontological security of this everyday heritage in daily life and routine (Grenville Reference Grenville2007). People and the landscapes they occupy are thus intimately enmeshed and meaningful places are deeply embedded in people's psyche, as demonstrated in recent research by Gatersleben et al. (Reference Gatersleben, Wyles, Myers and Opitz2020), who used MRI scans to identify the activation of brain areas associated with emotional responses to such meaningful places in ways not found for either meaningful objects or neutral places.
People create a wealth of local knowledge and expertise through their everyday social life. This information is vital for understanding what makes places meaningful and valued. It should also be crucial for the management of those places to acknowledge the varied forms of perception vital for understanding what makes a place important to people. However, these collective and individually held values are diverse and hard to capture, making them difficult to incorporate into heritage management strategies that are historically designed around objective factual data,Footnote 1 typically based on datasets, such as the Historic Environment Records, finds databases and historic maps. The shortcomings we describe in the following section provide the justification for our approach.
Reviewing heritage values
A paradigm shift since the 1960s—the ‘cultural turn’—had far-reaching implications for understanding the importance of values in the heritage sector and their creation through the meaning-making of communities and individuals (Tuan Reference Tuan1980). The nature of values was no longer seen as intrinsic in the fabric of the material world: buildings, landscapes, sites, or things (Pearson Reference Pearson1995, 308), but as a construct and the result of negotiation within democratic societies, communities and individuals, ‘ascribed to heritage by society at large’ (Avrami Reference Avrami, Richmond and Bracker2009, 179; see also Jones Reference Jones2017, 21). Views on the role of heritage professionals and non-experts, and the concept of values in general, changed significantly—the heritage expert no longer had the monopoly of authority in defining heritage significance (Bonnell & Hunt Reference Bonnell, Hunt, Bonnell and Hunt1999; Cosgrove Reference Cosgrove2004, 57; Gibson & Pendlebury Reference Gibson, Pendlebury, Gibson and Pendlebury2016, 1–2).
However, while there is a consensus on the importance of recognizing people's perceptions and local knowledge for a more sustainable way to manage and think about heritage, practical solutions for the integration of people's voices in the decision-making process have been slow to develop and become integrated into heritage management. Heritage values are a particularly good example of these shortcomings. Ascribed values, when identified and determined by heritage specialists, can help to assess and determine the measures of management, inform statutory heritage protection decision making and provide support appropriate for specific parts of the historic environment. However, value categorization has been in dispute ever since the recognition of the benefits of positioning locally held viewpoints on value and significance alongside those of specialists, not least in terms of the tension created between the benefits of such an approach (e.g. its inclusivity) but also the significant challenges it entails (e.g. its practicality).
The suggestion to incorporate locally held values into heritage management systems was first promoted for heritage managers in the Amsterdam Charter (ICOMOS 1975), reinforcing the existing notion of public consultation and inclusion in heritage decision-making. The Burra Charter (ICOMOS 1979) did not mention this point before the 1999 version (now ICOMOS 2013). However, Smith's (Reference Smith2006) analysis of international conventions and charters, such as the Athens and Venice Charters, but also the Burra Charter, showed continued adherence to the principles of the Authorized Heritage Discourse (AHD), defined by Smith (Reference Smith2006) as a dominant concept of heritage management that is ‘reducing the authority of non-experts’ and ‘appeals to the moral authority of expertise’. While the Burra Charter contains some progressive ideas about inclusion, its authoritative language still nonetheless strengthens the position of experts, albeit indirectly.
Public perception and participation was then integrated in the European Landscape or Florence Convention (Council of Europe 2000), the Faro Convention on the Value of Cultural Heritage for Society (Council of Europe 2005), and in Historic England's Conservation Principles document (English Heritage 2008). All these policy or guidance documents called into question the comprehensiveness and inclusivity of using only those objective, scientific value categories which provide the current framework (Supplementary Material 1). They challenged heritage managers to consider how much local knowledge and expertise is included in heritage evaluations and how fluid they are, to take account of the changing social fabric of an area over time, or people's changing opinions. Alongside Historic England, another national agency—Natural England—considers the natural and cultural value of landscapes based on the perception of people, aligning closely with the European Landscape Convention, referred to earlier. However, while current studies use ‘proxies’ or ‘secondary measures’ to identify people's perception (for example, tourist numbers, numbers of footpaths and car parks as ‘opportunities for health walks’, or ‘measures of accessibility’: Natural England 2015, 10), no time-efficient and effective method for the collection of qualitative data has been developed, mirroring the situation for cultural heritage.Footnote 2
With these developments in mind, we ask: is the current value system on which experts assess heritage fit for purpose? And is the valuation framework for conservation, arguably exemplified by that currently offered by Historic England (English Heritage 2008), sufficiently forward-thinking and up to the task in a fast-changing world? This question of changing perceptions aligns with the growing realization that the term ‘heritage’ itself is fluid and dynamic: a social process of creating meaning and memory, communities and identities. Value categories, it was argued, should also be sufficiently flexible to adapt to societal change and environmental pressure (Byrne Reference Byrne, Fairclough, Harrison, Jameson and Schofield2008; Dalglish & Leslie Reference Dalglish and Leslie2016; Harrison Reference Harrison and West2010; Jones Reference Jones2017; Jones & Leech Reference Jones and Leech2015; Smith Reference Smith2006).
Against this background, we explore and critique the current value categories described in Conservation Principles. As a significant departure from current applications, we propose an innovative approach which involves identifying those hard-to-obtain but important values held by local people and their communities. This approach will address the lack of inclusion of people's perceptions and the dynamic quality of social valuesFootnote 3 as an ongoing challenge for heritage and landscape management.Footnote 4 We use Topic Modelling to identify latent or emerging value themes from a public survey, providing the individual stories (the intangible element) of ‘everyday heritage’. This offers an open-minded approach to qualitative data. We propose Natural Language Processing (NLP) and Machine Learning (ML) with a focus on Topic Modelling as a method, following basic principles of Grounded Theory for improving the system of valuation in heritage management (Charmaz Reference Charmaz2006; Creswell Reference Creswell2017, 276). Following Grounded Theory means a first investigation of the data free of the researcher biasFootnote 5—with no predefined codes or assumptions. The themes latent in the data are explored as they emerge and in a later phase of the study are structured into a framework of topics. The results are correlated with the current framework of values as applied by Historic England, suggesting how new categories could help to address the changing expectations, needs and demands of the public, partly developed as a reaction to a changing world after the COVID-19 pandemic and the increasing pressures on natural and cultural landscapes that have emerged as a result (Ginzarly & Srour Reference Ginzarly and Srour2022; Historic England 2022; UNESCO 2021).
Data sources and methodology
Overview of the method
To explore ways to capture social values in a form that can be used within the planning process and in heritage management decision-making requires a method that is efficient and scalable. Here we use Topic Modelling to present place attachment in a format that can be used for categorizing individually held values in cultural landscapes. We will first describe the method before going on to deliver a proof of concept. While this novel methodology is based around two areas in the UK, it is transferable to any context where local authorities have capacity to routinely use survey data or online portals to record people's interactions with or feelings about a place.
The flowchart in Figure 1 details the process applied in this research. Residents of two study areas were asked to provide five favourite places that matter most to them and ‘stories’ about their personal connection to these places. The stories were then fed into a Topic Modelling algorithm to get a first, bias-reduced insight into the latent themes within the data and preliminary topic labels summarizing the topic clusters. Direct observation then allowed evaluation of the modelling result and an assessment of the usefulness of this approach. The annotated data were subsequently categorized based on the value catalogue provided by Historic England's Conservation Principles. Visualization in GIS can be created at two stages of this process: in the form of a ‘story map’ as the basis for communication between local authorities and residents; and in the form of a ‘value map’ following the process of categorization, with the potential to provide background information for planning purposes.
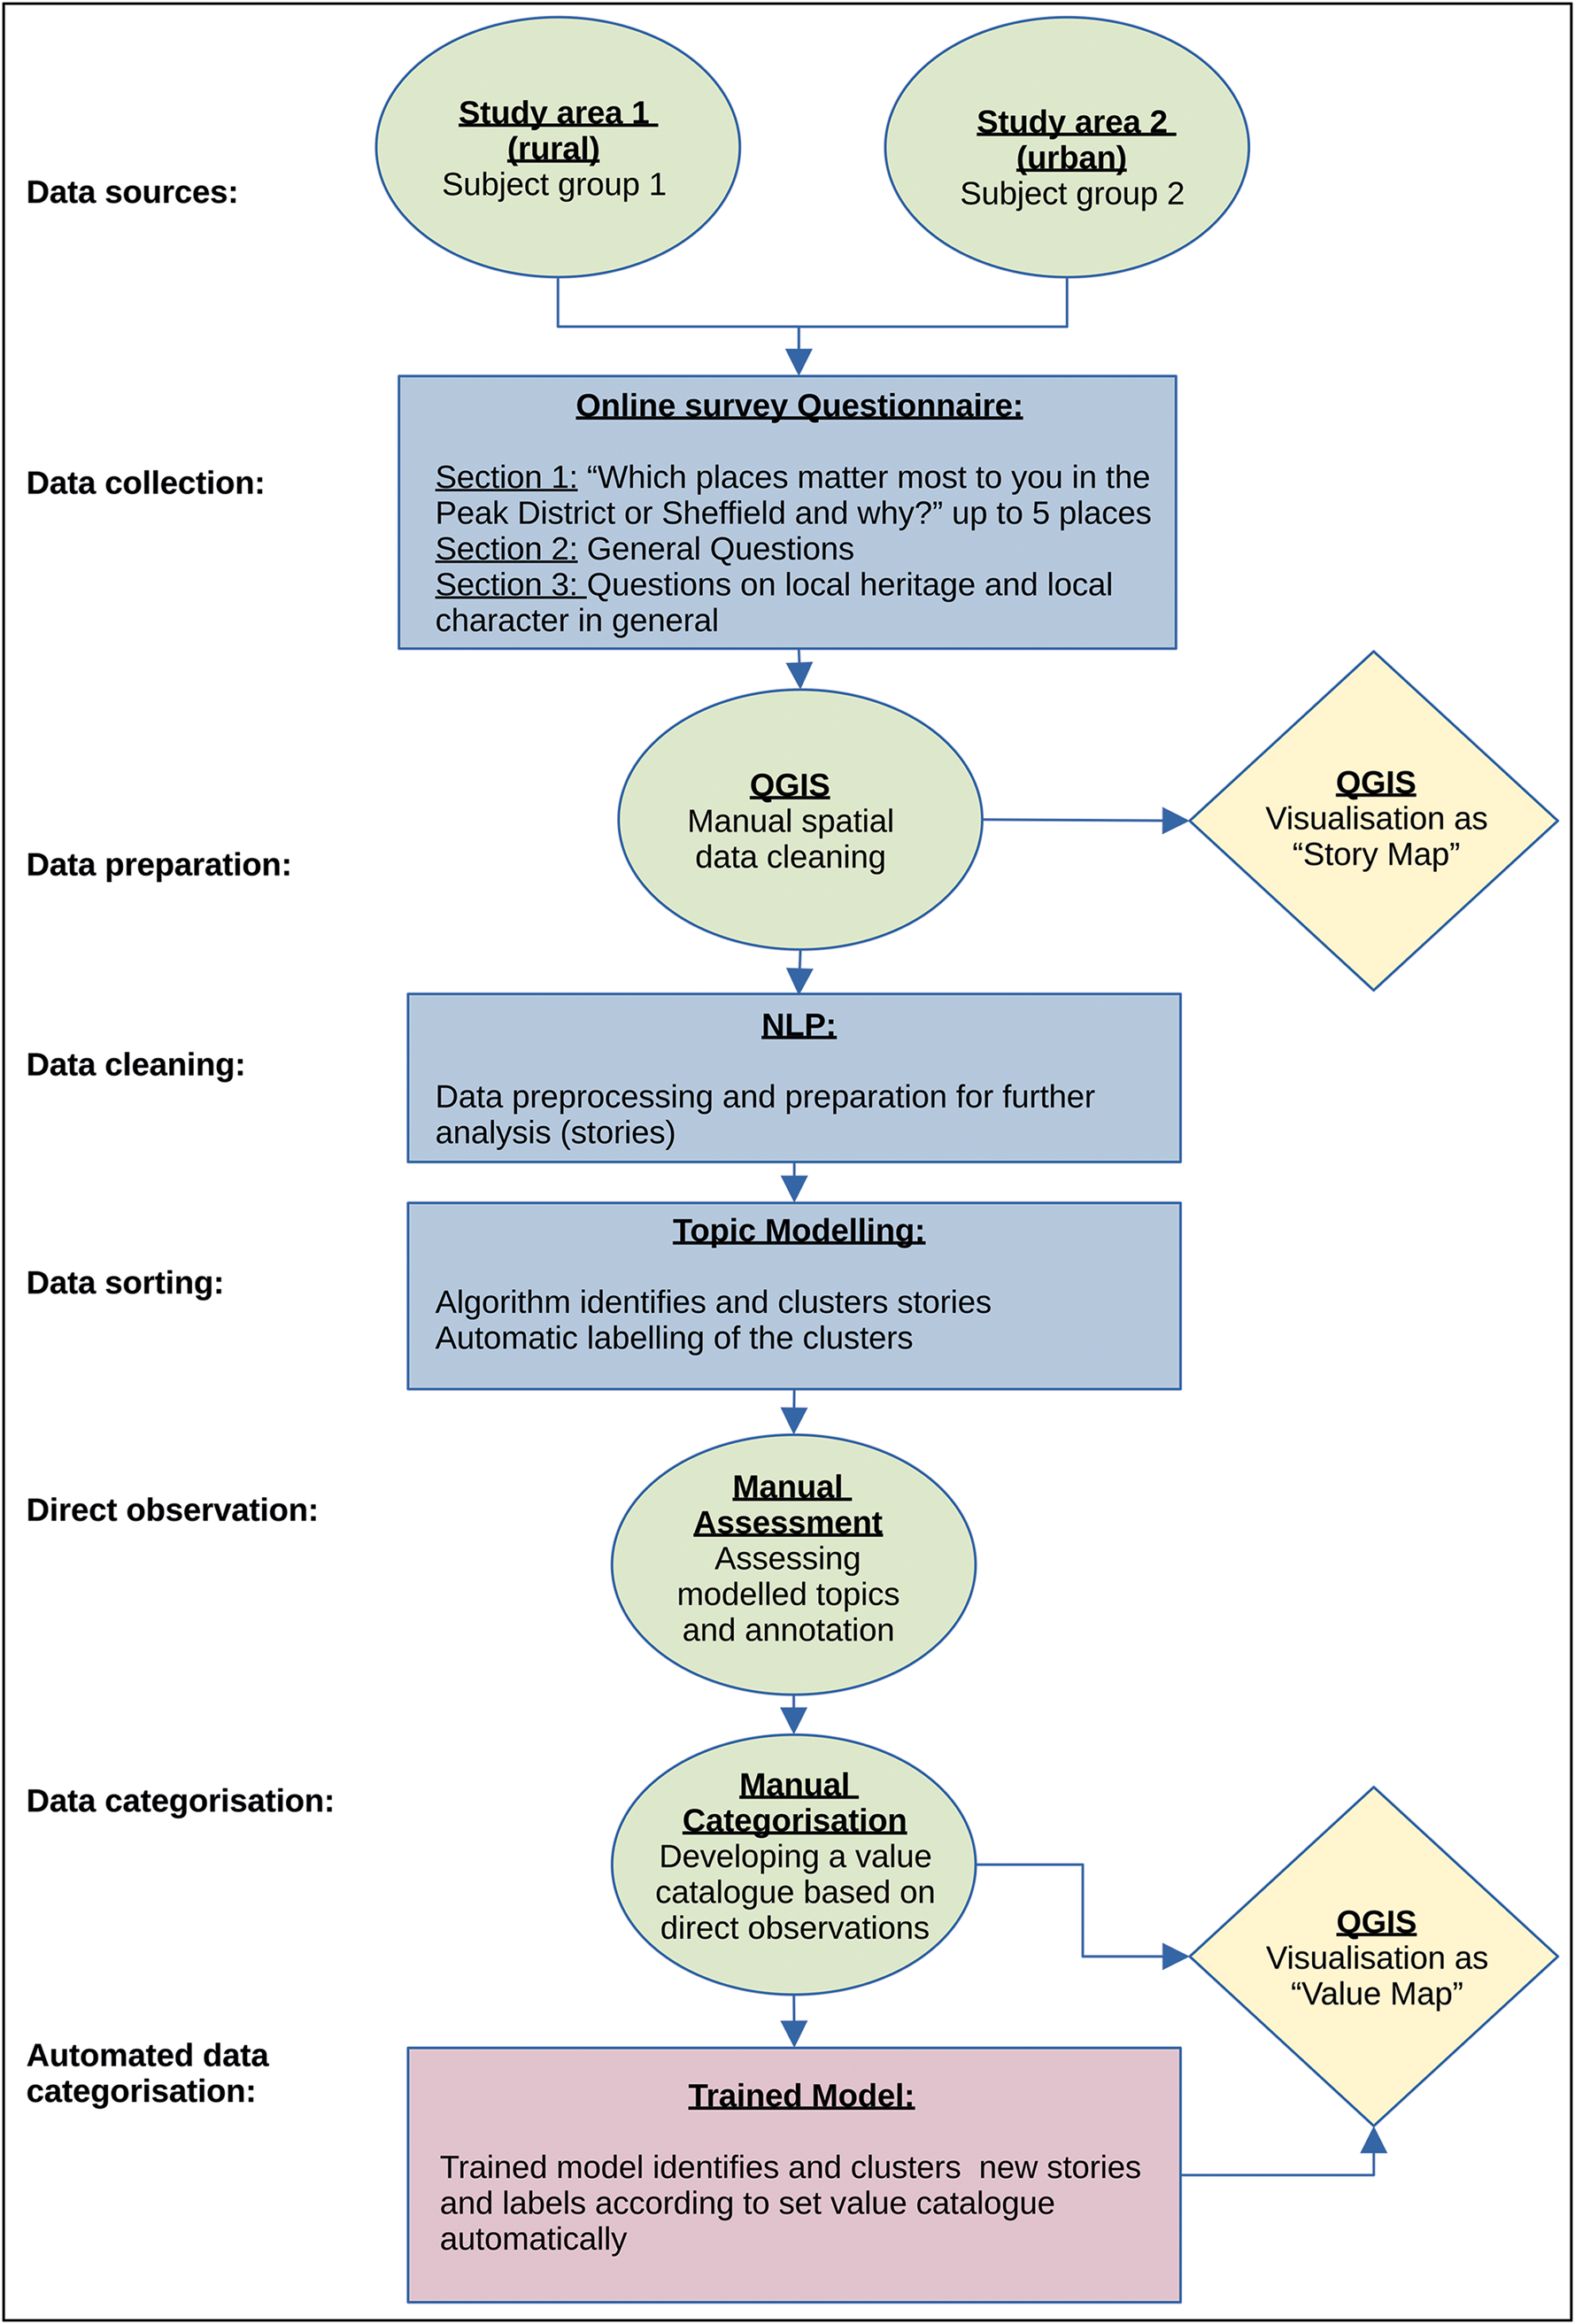
Figure 1. Detailed methodology developed in this research. The aim is to create the topics based on the ‘stories’ of survey participants and correlate these with value categories as set out in Historic England's Conservation Principles (English Heritage 2008), extending the current value catalogue. (Green: manual process; blue: computed process; red: outlook; yellow: visualization.)
Study areas
Two study areas were identified for this project: the City of Sheffield and the Peak District National Park, both located in the north of England (Fig. 2). These locations were chosen to offer insight into the enmeshed relationship between people and places amongst a combination of urban and rural communities. Additional methods include in-depth interviews and a social media analysis (Tenzer Reference Tenzer2022; Tenzer & Schofield Reference Tenzer and Schofieldn.d.). While the district of Sheffield overlaps with the National Park, the two landscapes are in many respects different and distinctive. Residents of both areas are closely connected to the landscapes of both study areas through leisure activities, work and shopping, cultural activities and educational organizations. This integration was considered an advantage when selecting the two study areas.
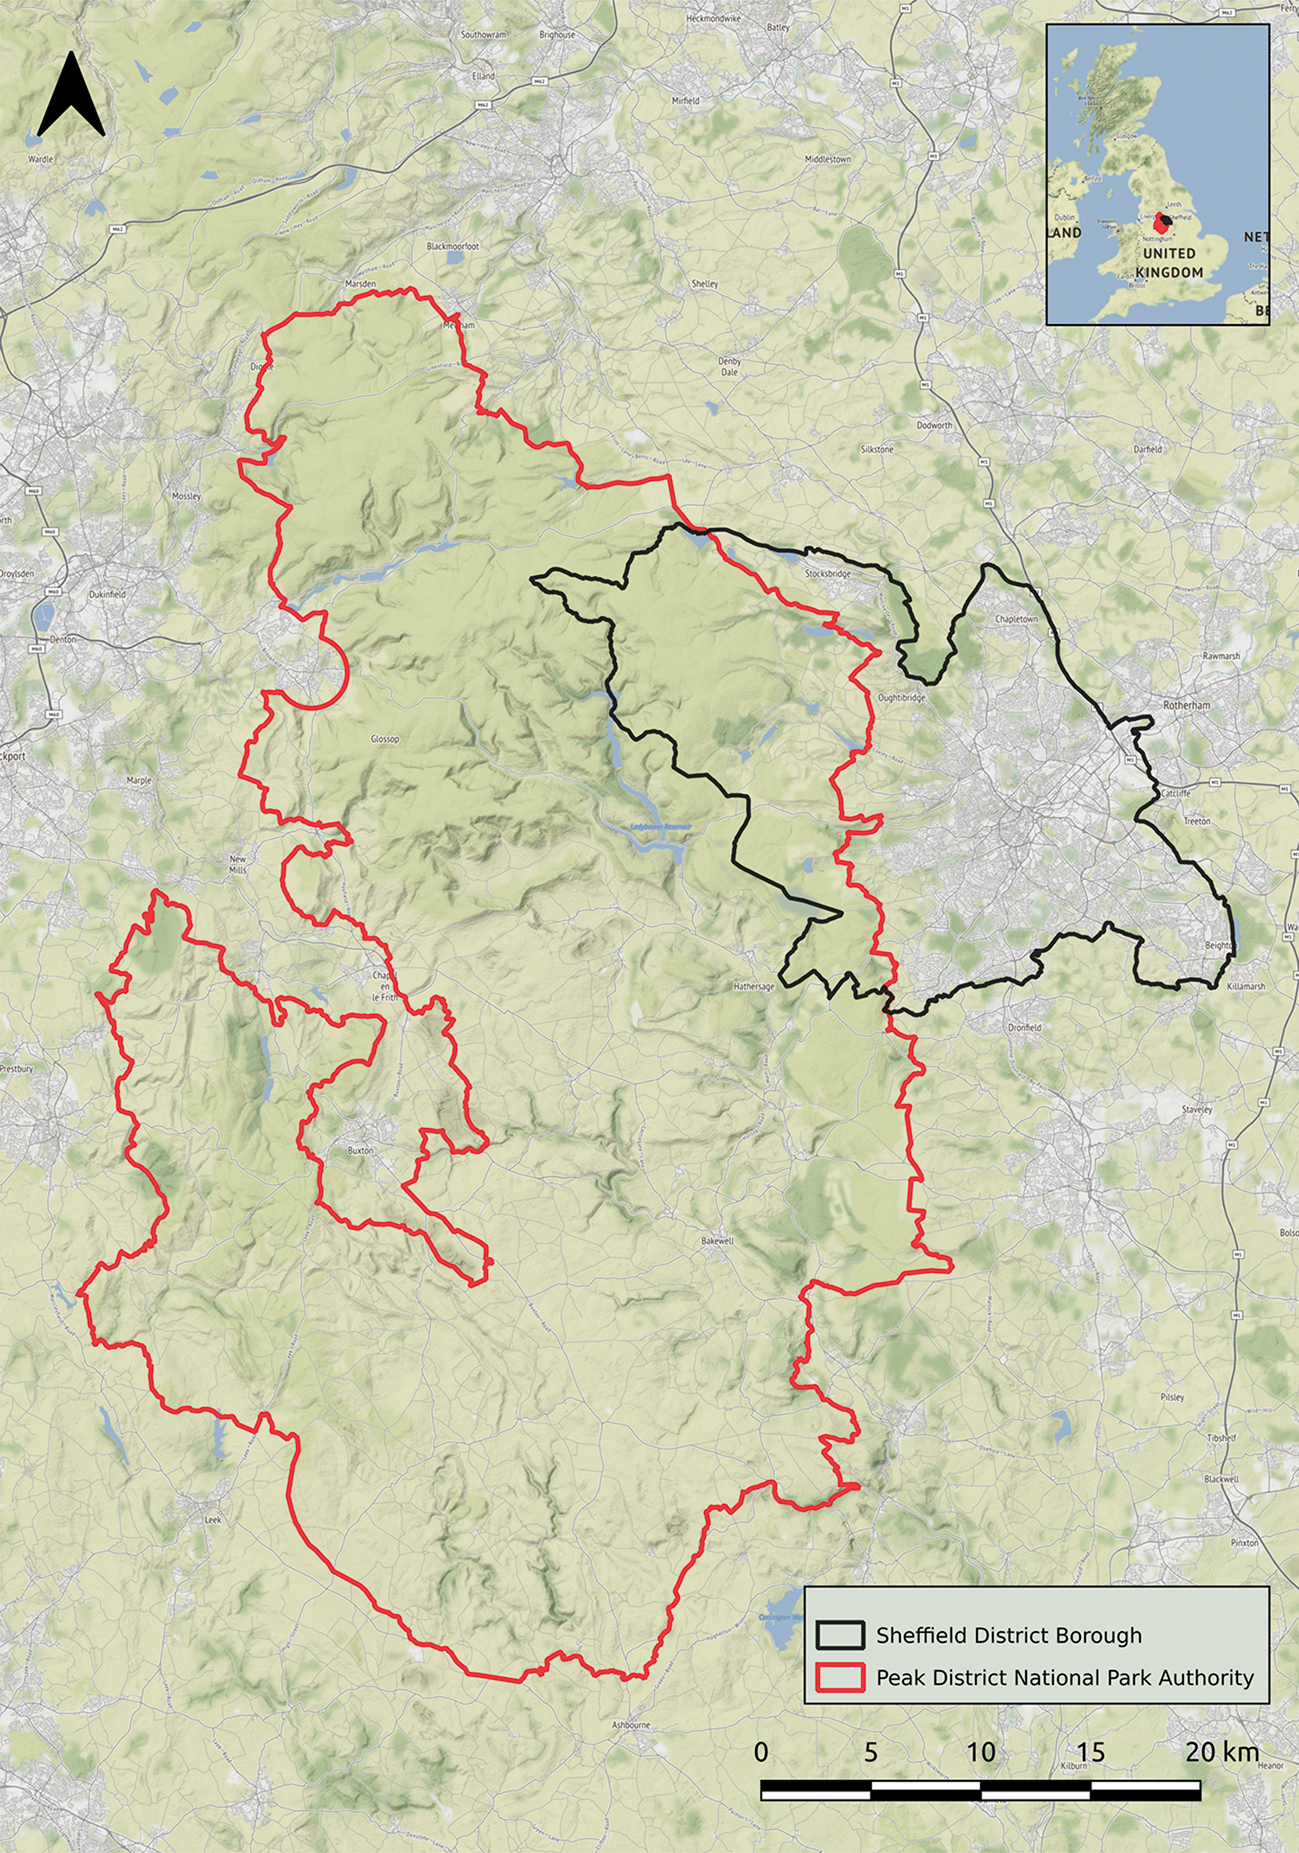
Figure 2. Study areas: Peak District National Park and Sheffield city. Residents of these areas were invited to participate in a survey and provide up to five favourite places within the study areas and their ‘stories’ of personal connection. (Map created in QGIS; data contain OS data © Crown copyright and database right 2022. Map tiles by Stamen Design, under CC BY 3.0. Data by OpenStreetMap, under OdbL.)
The Peak District National Park—the first designated National Park—covers an area of 1438 sq. km. It is a place of residence for approximately 38,000 people at the time of writing (PDNPA n.d.). The Park includes various archaeological and historical sites from the Palaeolithic to recent periods, including prehistoric burial mounds, henges and stone circles, medieval field systems and settlements and post-medieval industrial sites, including stone quarries. At the point of writing, the Peak District National Park has 2900 listed buildings, 109 conservation areas and 450 scheduled monuments, all of which involve various degrees of statutory protection (PDNPA n.d.).
Sheffield lies to the west of the Peak District National Park. It is dominated by seven hills and two universities, covering an area of 367 sq. km with approximately 556,500 residents. It is best known for its industrial heritage. Today, both visitors and residents favour the town for its multicultural character, the wide offer of cultural events and the quality of an outdoor city with its vicinity to the National Park. There are currently 1200 listed buildings, 38 conservation areas and 43 scheduled monuments in the city.Footnote 6
Survey method
Residents of the Peak District National Park (PDNP) and the City of Sheffield were first invited to participate in an online survey. The online questionnaire was published through the channels of both local authorities, the Peak District National Park Authority (PDNPA) and Sheffield City Council, comprising their websites, social media channels (i.e. Facebook, Twitter, Instagram, LinkedIn) and a specific mailing list of over 4500 recipients in Sheffield. Participants therefore included residents of the two study areas exclusively,Footnote 7 who self-identified as residents of either study area. In total 476 responses were received. Forty-eight participants identified themselves as residents of the PDNP and 386 as residents of Sheffield; 42 participants did not answer this question.
The survey questionnaire consisted of three sections: general information (such as place of residence, age, ethnicity, and level of education); the question which places matter most to the respondent, and why; and questions on their perception of the local heritage and landscapes (see Supplementary Material 3). Questions in sections 1 and 3 were multiple-choice. To allow the most flexibility and subjectivity in the second section, respondents were given the opportunity to enter a location on a map and their ‘story’—the personal reason for a connection to the place—as a free-text entry of up to 300 words. To identify more places of individual importance, the respondents were asked to enter up to five places in one questionnaire. Not all respondents provided five places as requested. The average was just over one place/response per respondent, resulting in 547 places, of which 509 provided a story, experience or perception of heritage, landscapes or history relating to one of the two study areas.
The survey responses were downloaded and imported into a Geographic Information System (GIS).Footnote 8 The dataset was then cleaned. This included: eliminating places not located within the study areas and repositioning locations set in the wrong place (determined by written input in the location field). The participants provided 174 favourite places in the PDNP and 298 in Sheffield. The intersection of the study areas included 60 locations. Eleven locations close to but outside the study area limits to the east of the City of Sheffield were included as the locations were close to the boundary, i.e. Buxton (see Figure 3).
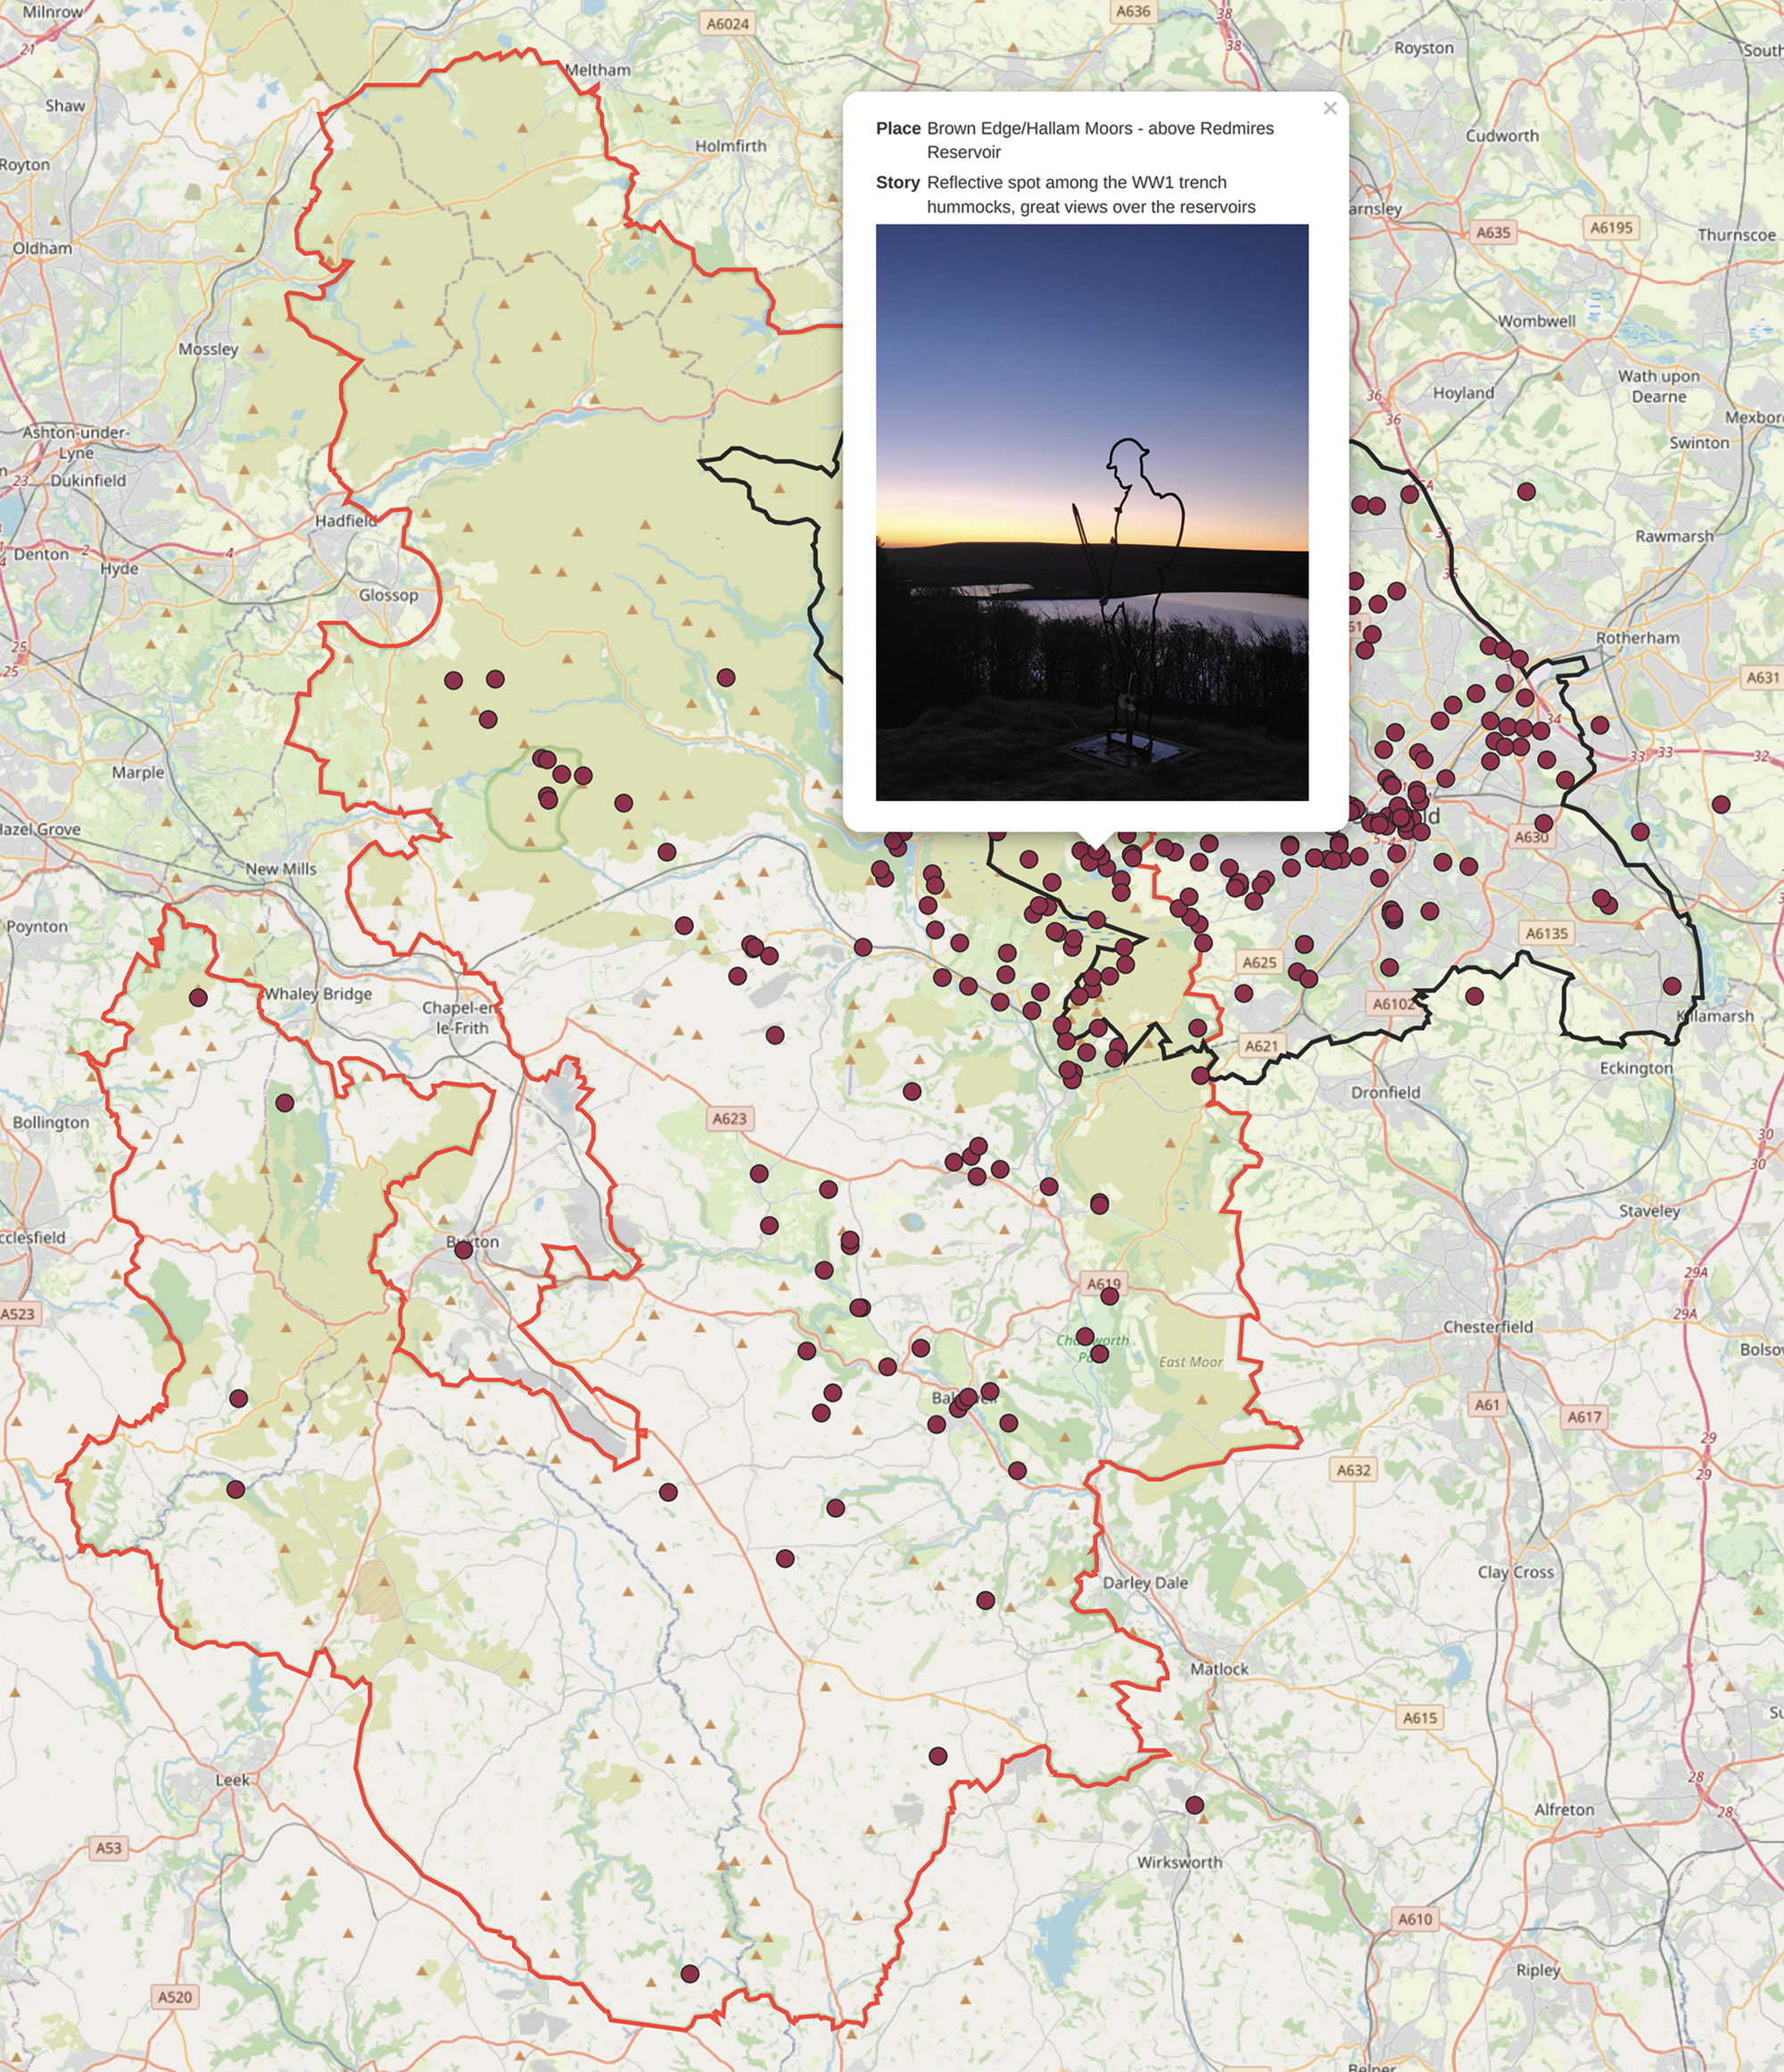
Figure 3. Interactive ‘story map’, showing the favourite places provided by residents of the two study areas who participated in an online survey. The participants were asked to provide up to five places that matter most to them and give an up to 300-word description of the reasons for the connection to these places. (Map created in QGIS/Leaflet, © OpenStreetMap contributors; data contain OS data © Crown copyright and database right 2022.)
The online questionnaire for this research followed the principle of offering a low-cost/cost-free, practical solution for survey design by using the Qualtrics softwareFootnote 9 and an embedded Google Maps map. This questionnaire allowed the participants to use a familiar map interface to locate and pin a location, which automatically provided geospatial coordinates for the GIS map analysis to create georeferenced stories. Where participants were not able to locate the place on the map, they could also enter locations as free text. In this case a Named Entity Recognition process was used as detailed in Tenzer (Reference Tenzer2022). The data were then ready to be preprocessed for analysis with NLP and TM.
Natural Language Processing and Topic Modelling
NLP and TM are emerging methods for data analysis that are particularly relevant to qualitative research. Heritage and landscape studies have yet fully to appreciate and integrate the opportunities offered by these tools (but see Bordoni et al. Reference Bordoni, Mele and Sorgente2016; Condorelli et al. Reference Condorelli, Rinaudo, Salvadore and Tagliaventi2020; Fiorucci et al. Reference Fiorucci, Khoroshiltseva, Pontil, Traviglia, Del Bue and James2020; Matrone et al. Reference Matrone, Grilli, Martini, Paolanti, Pierdicca and Remondino2020; Verschoof-van der Vaart et al. Reference Verschoof-van der Vaart, Lambers, Kowalczyk and Bourgeois2020). The Council of Europe actively encourages the use of Artificial Intelligence (AI) in all sectors, including heritage (Traviglia Reference Traviglia2022), as a result of increasing interest in Text Mining and Machine Learning/Topic Modelling for computational language analysis (Goerz & Scholz Reference Goerz and Scholz2010; Sassolini & Cinini Reference Sassolini, Cinini, Calzolari, Choukri and Maegaard2010; Sporleder Reference Sporleder2010). Our research applies AI in line with these projects, using NLP algorithms, to model categories of values based on perceptions, experiences, concerns and visions of residents of the two study areas, as described in the ‘stories’ provided by the online surveys.
TM is a time-efficient method to analyse qualitative data and has been tested for its capabilities elsewhere (e.g. Abram et al. Reference Abram, Mancini and Parker2020; Cai et al. Reference Cai, Siebert-Evenstone, Eagan, Shaffer, Ruis and Lee2021; Franzosi et al. Reference Franzosi, Dong and Dong2022; Ginzarly & Srour Reference Ginzarly and Srour2022). More importantly, this method of text analysis allows themes and topics emerging from or ‘latent’ within the data to be captured without preconceived codes. This approach aligns with the underpinning elements of Grounded Theory (e.g. Charmaz Reference Charmaz2006; Odacioglu & Zhang Reference Odacioglu and Zhang2022). Grounded Theory is usually applied ‘when little is known about the phenomenon’ (Chun Tie et al. Reference Tie and M2019), or in the case of this research, where traditional thinking dominated by experts (often referred to in the context of an Authorized Heritage Discourse: see Schofield Reference Schofield and Schofield2014; Smith Reference Smith2006; Waterton et al. Reference Waterton, Smith and Campbell2006) is preferably avoided, exploring the connection between people and places, perception and place-making, in a narrow and individual sense, without the bias of preconceived expert knowledge.
The following steps are part of the analysis shown in the flowchart in Figure 1. To undertake this analysis, the survey data were downloaded. Coordinates, place names, stories and photographs were extracted from the survey dataset—separating these from the demographic data—and then cleaned and preprocessed with textmineR, eliminating places not located within the study area and relocating pins set in error. The resulting data set was then fed into the NLP toolchain using R and Python routines in RStudio.
The five steps of the Topic Modelling process are as follows:
1. Data wrangling: cleaning text, lemmatizing, stemming, removing stop words, creating a DocumentTermMatrix.
2. Choosing a model algorithm: the R package textmineR provides an innovative method of topic modelling and labelling (currently under development at George Mason University, USA, by Tommy Jones: see Jones Reference Jones2021; Jones et al. Reference Jones, Doane and Attbom2021). This unsupervised machine-learning model uses unlabelled data and implements the Latent Dirichlet Allocation algorithm and Gibbs Sampling (Blei et al. Reference Blei, Ng and Jordan2003). It creates word clusters and identifies topic labels based on the probabilistic distribution of words over topics and topics over documents. This means that each topic is a combination of keywords which have a specific importance (weight) contributing to the weightage of each topic.
3. Running the model and adjusting parameters: most of the parameters were left to default settings, while the number of topics and iterations was optimized. The model iterates n-times over the data and provides information on the topic coherence level at k topics (Fig. 4). This means that the model in our case attempts 4000 times to make more sense of the relationship between the documents and to create more meaningful clusters where documents relate more closely to each other.
4. Choosing the optimal number of topics: coherence (Fig. 4) measures the degree to which the documents (stories) in a topic show high semantic similarities and support each other in their statements. This gives us the model we want to choose for further analysis. In our study, 40 models were created, and the best coherence is provided at 35 topics (tqx94 2022). After 35 topics, the coherence score flattens out, meaning that a greater subdivision of the data would not provide any more coherent and meaningful topic groups. The coherence is not very high in our case and more data would help to fine-tune the model. Nonetheless, this gives a good starting point for the manual analysis.
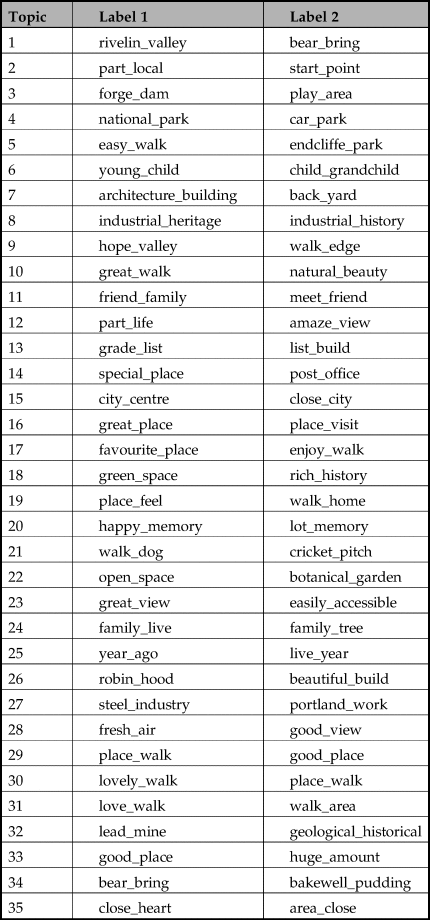
5. Topic labelling: labels are based on the most frequently appearing key terms in the documents/stories of each cluster (bi-grams: two closely associated words in a text) (Fig. 5) (tqx94 2022). Labels created in this process are not meaningful titles, but give a good indication of the dominant theme in each cluster.
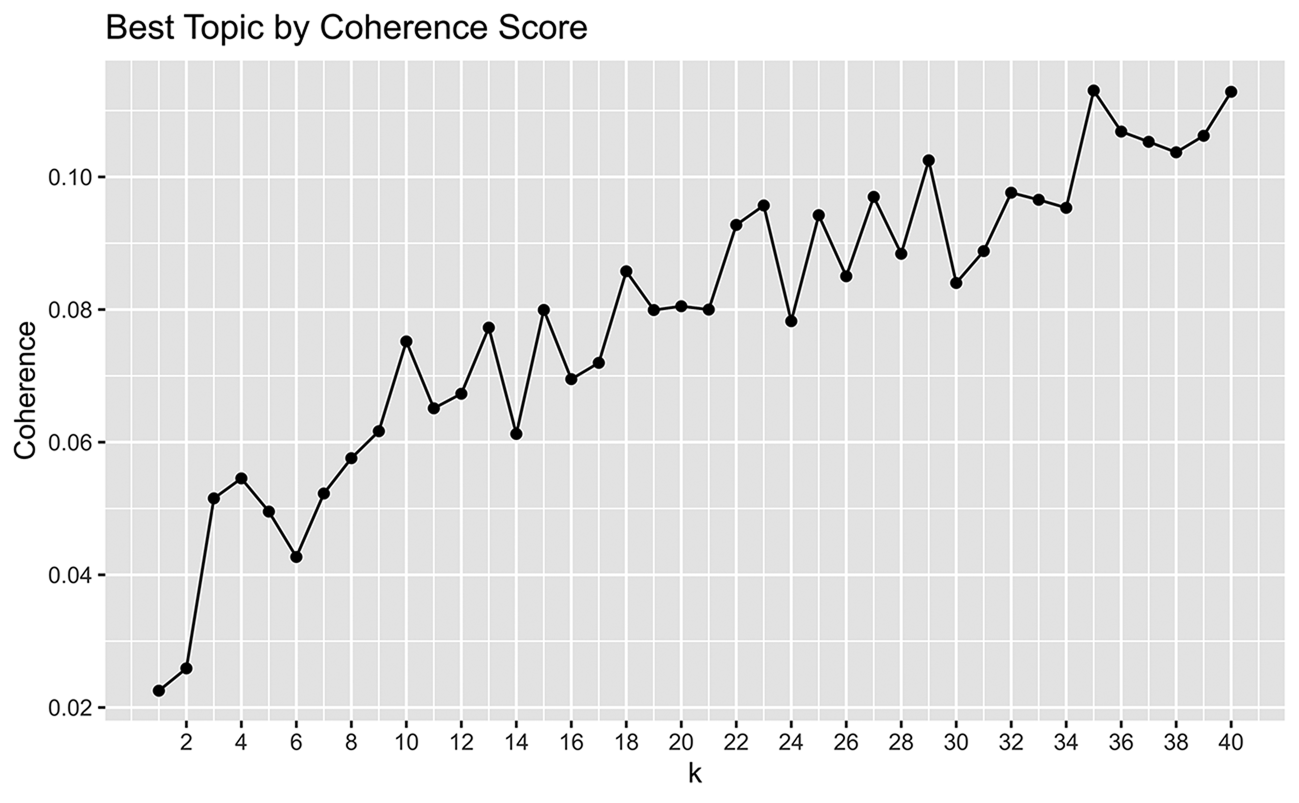
Figure 4. The Topic coherence gives the degree to which documents in one cluster are closely related. This depends on the size of the cluster and the number of topics chosen. For example, if we subdivide the documents into four different topics, the documents have less coherence—similar semantics and supporting the statements of each other—than at the point of 35 clusters, where the number of documents in one cluster is smaller but the relationship between the documents higher. At 35 topics the coherence is highest, flattening out with more subdivisions. Therefore, 35 topics will provide the best first insight into the latent topics within the documents (tqx94 2022).
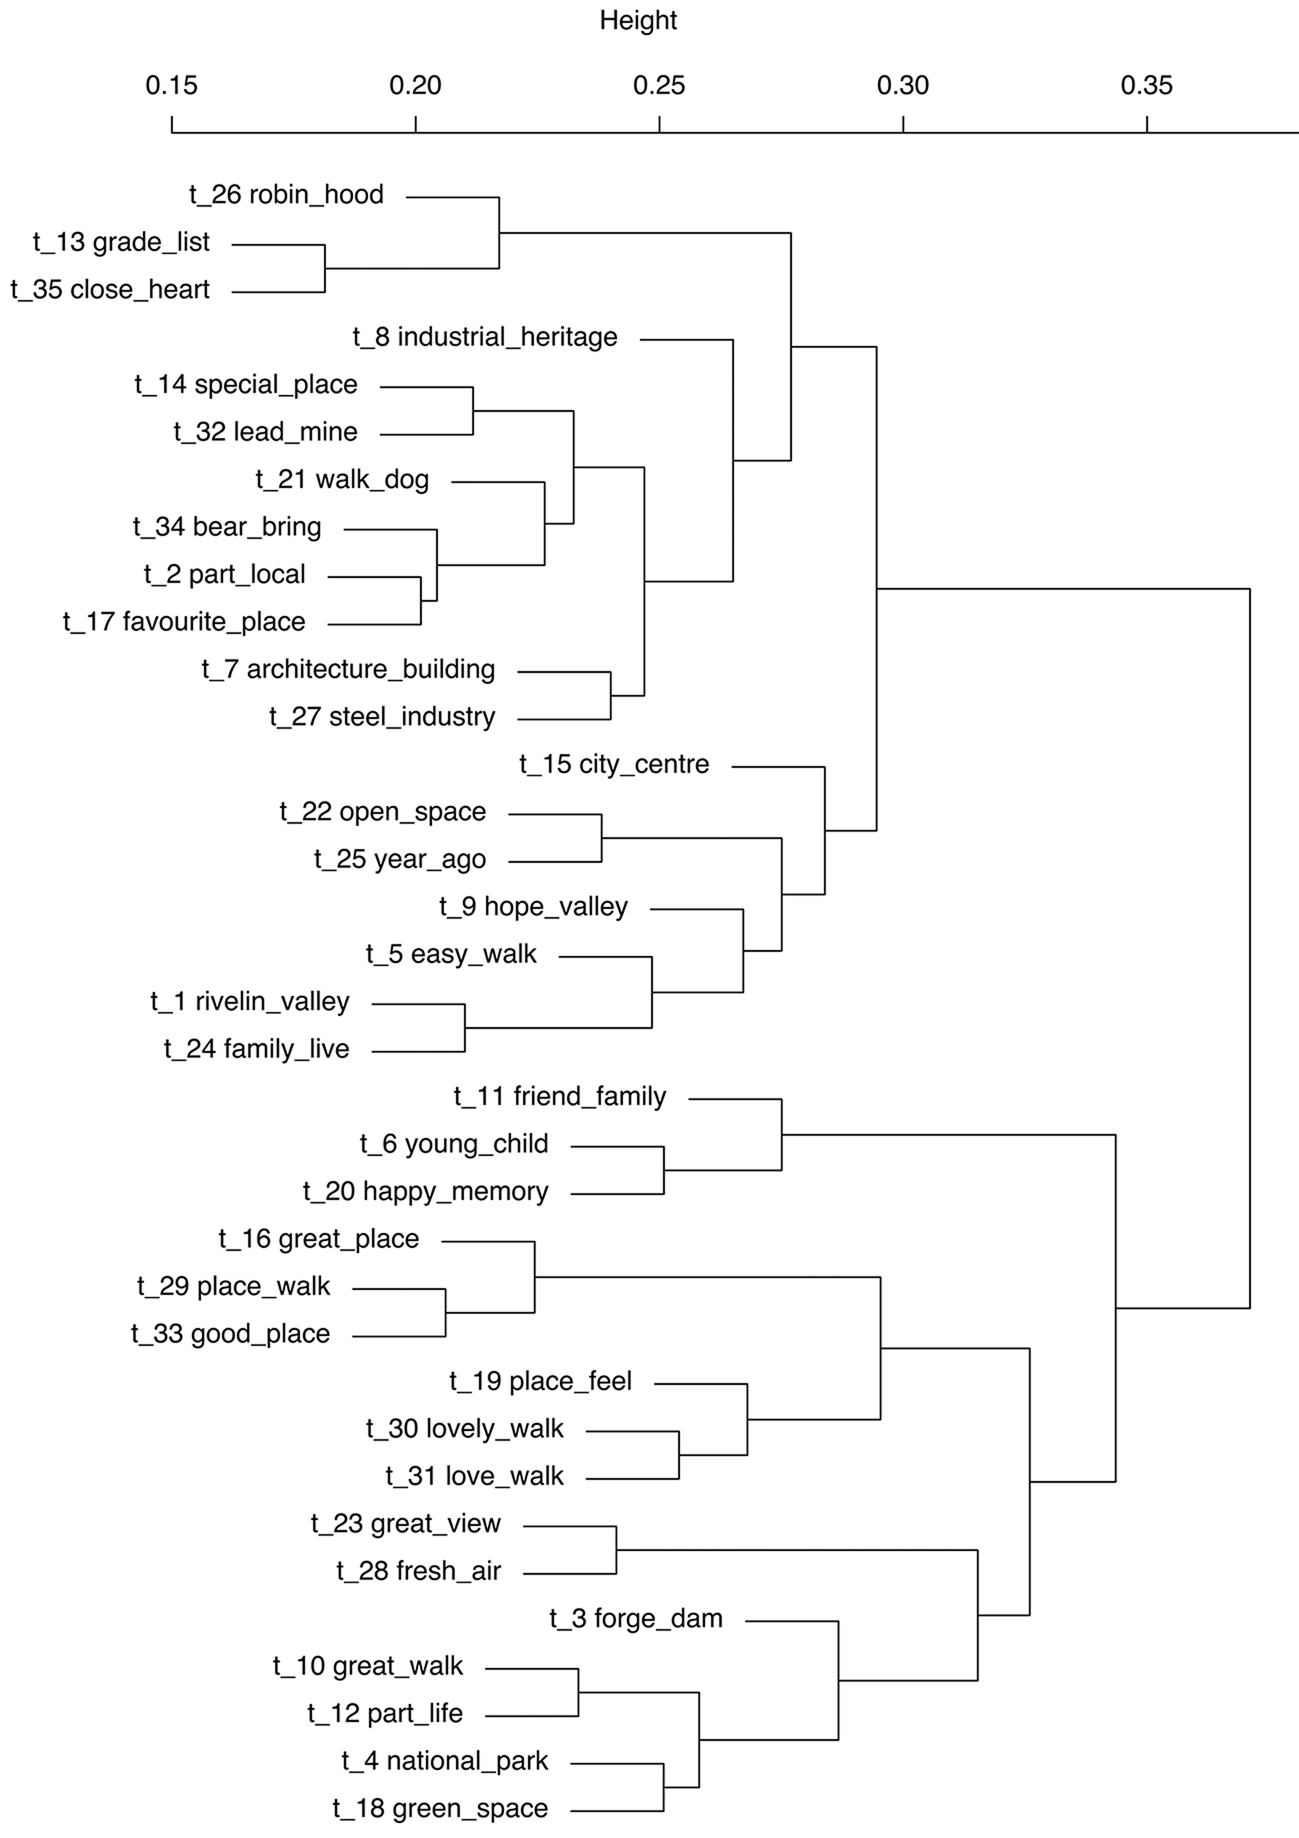
Figure 5. The Cluster Dendrogram shows the 35 topic clusters with their respective labels chosen by the modelling process. The levels (Height) show the similarities of topics. Topics in the lower level of the diagram on branches close together show topic clusters that have themes closely related to each other. For example, topic 10: ‘great_walk’ and topic 12: ‘part_life’ consist of documents or ‘stories’ with content that support each other and can be summarized under the respective label. Similarly, topic 4: ‘national_park’ and topic 18: ‘green_space’ consist of documents with a similar theme. At a higher level, all four clusters are related to each other—to a lesser degree than at a lower level but more closely related than, for example, topic 3: ‘forge_dam’, again, a level higher up.
Using this unsupervised learning method prevents the introduction of researcher bias in the next step of data analysis, which is comparable to the coding phase of text in other approaches, such as NVivo, as the algorithm has completed the clustering independently and created a pre-labelled dataset. This approach follows to the tenets of Grounded Theory (Charmaz Reference Charmaz2006). Our attempt to capture the themes latent in or emerging from the data themselves opposes the commonly used and widely criticized approach of applying codes or categories and trying to fit the data into these codes, introducing bias and issues with reliability and validity (Banks et al. Reference Banks, Woznyj, Wesslen and Ross2018; Welsh Reference Welsh2002). The approach of creating two bi-gram label variants per topic has proved to help identify the themes more accurately (Label 1 and Label 2) (see Table 1). Following the Topic Modelling process, the dataset was exported and the labelling by the algorithm was manually assessed in a direct approach to observe the coherence of the topics (Lau et al. Reference Lau, Newman and Baldwin2014). In the same step, the most dominant topics were identified manually and compared to the suggestions made by the algorithm.
Table 1. Following the Topic Modelling process, the optimal number of topics (35) was chosen to create labels for the topic clusters. The labels are based on the most frequent key terms in the documents/stories of each topic cluster. Labels vary in their quality, which makes a manual evaluation necessary.
A manual evaluation has shown that some of the topics are related to heritage, history and archaeology (Robin_Hood, industrial_heritage, steel_industry, list_building), while others are related to private life and community (friend_family, happy_memory) or aesthetic values (great_view, natural_beauty). However, topic labelling still needs human input and dataset structuring for meaningful labelling and categorization of the data. The application of the algorithm does not fully replace manual assessment and fine-tuning of coding (Cai et al. Reference Cai, Siebert-Evenstone, Eagan, Shaffer, Ruis and Lee2021; Chang et al. Reference Chang, Gerrish, Wang, Boyd-graber, Blei, Bengio, Schuurmans, Lafferty, Williams and Culotta2009; Leeson et al. Reference Leeson, Resnick, Alexander and Rovers2019). In our data model, the manual categorization was subsequently carried out to understand on what basis the documents were clustered (top terms) and if the clustering proved meaningful.
Value categories and perception correlation
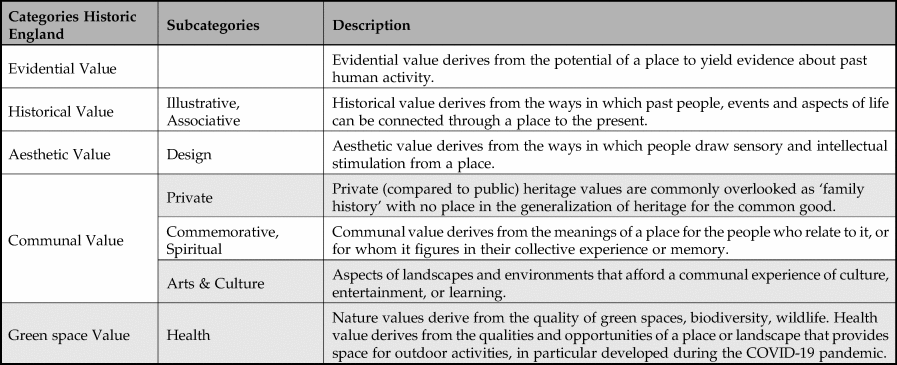
In the third step, the data were manually coded and the quality of the topic clusters and labels was assessed. To correlate these emerging values based on the experiences and perceptions of people with the value categories set by HE (Historic England since 2015, formerly English Heritage) (English Heritage 2008), each document was allocated to one of the following value categories (subcategories): evidential value, historical value (associative, illustrative), aesthetic value (design), communal value (social (renamed to ‘private’Footnote 10), commemorative, spiritual). The subcategories of ‘Communal’ values were developed to be more nuanced regarding the variety of aspects of stories, accommodating elements that did not fit into the HE categories. Also, a new category capturing the concept of nature in people's perception of landscape values was integrated to address the increasing awareness of valuing the environment in view of climate change and biodiversity loss (Table 2). This was also necessary to overcome the diametrical-opposite division developed in value systems over the past decades, dividing cultural/natural landscapes, tangible/intangible elements, and learning/mental health approaches to heritage—a subdivision rarely evident in the daily experience of the environment.
Table 2. Historic England's value categories as set out in the Conservation Principles (English Heritage 2008). Additional nuance to these categories is proposed based on the underlying themes identified in survey data. The additional values (shaded cells) address societal trends and the changing and dynamic demands and needs of residents in the Peak District National Park and the city of Sheffield following the COVID-19 pandemic.
Results
In this section we present the results of the modelling process, direct observations and manual annotation for correlation with the values defined in Historic England's Conservation Principles. We do this by first introducing the results of the TM. We then describe the manual observation of usefulness of the modelled topics and labels. Finally, we summarize the results of the correlation and describe the development of a more nuanced division of communal values as identified in the survey data.
Results show that people's perceptions correlate with some of the value categories of HE, showing that the expert definition of heritage values is capable of capturing parts of the individually held values. Our bottom-up approach can be aligned with the expert-led approach to find a common ground for heritage value categorization.
Modelling categories
As suggested in Figure 4 and illustrated in Figures 5 and 6, the modelling computed 35 clusters as an optimal topic number. The sizes of the clusters varied from five documents/stories (Topic 35) to 33 (Topic 6).
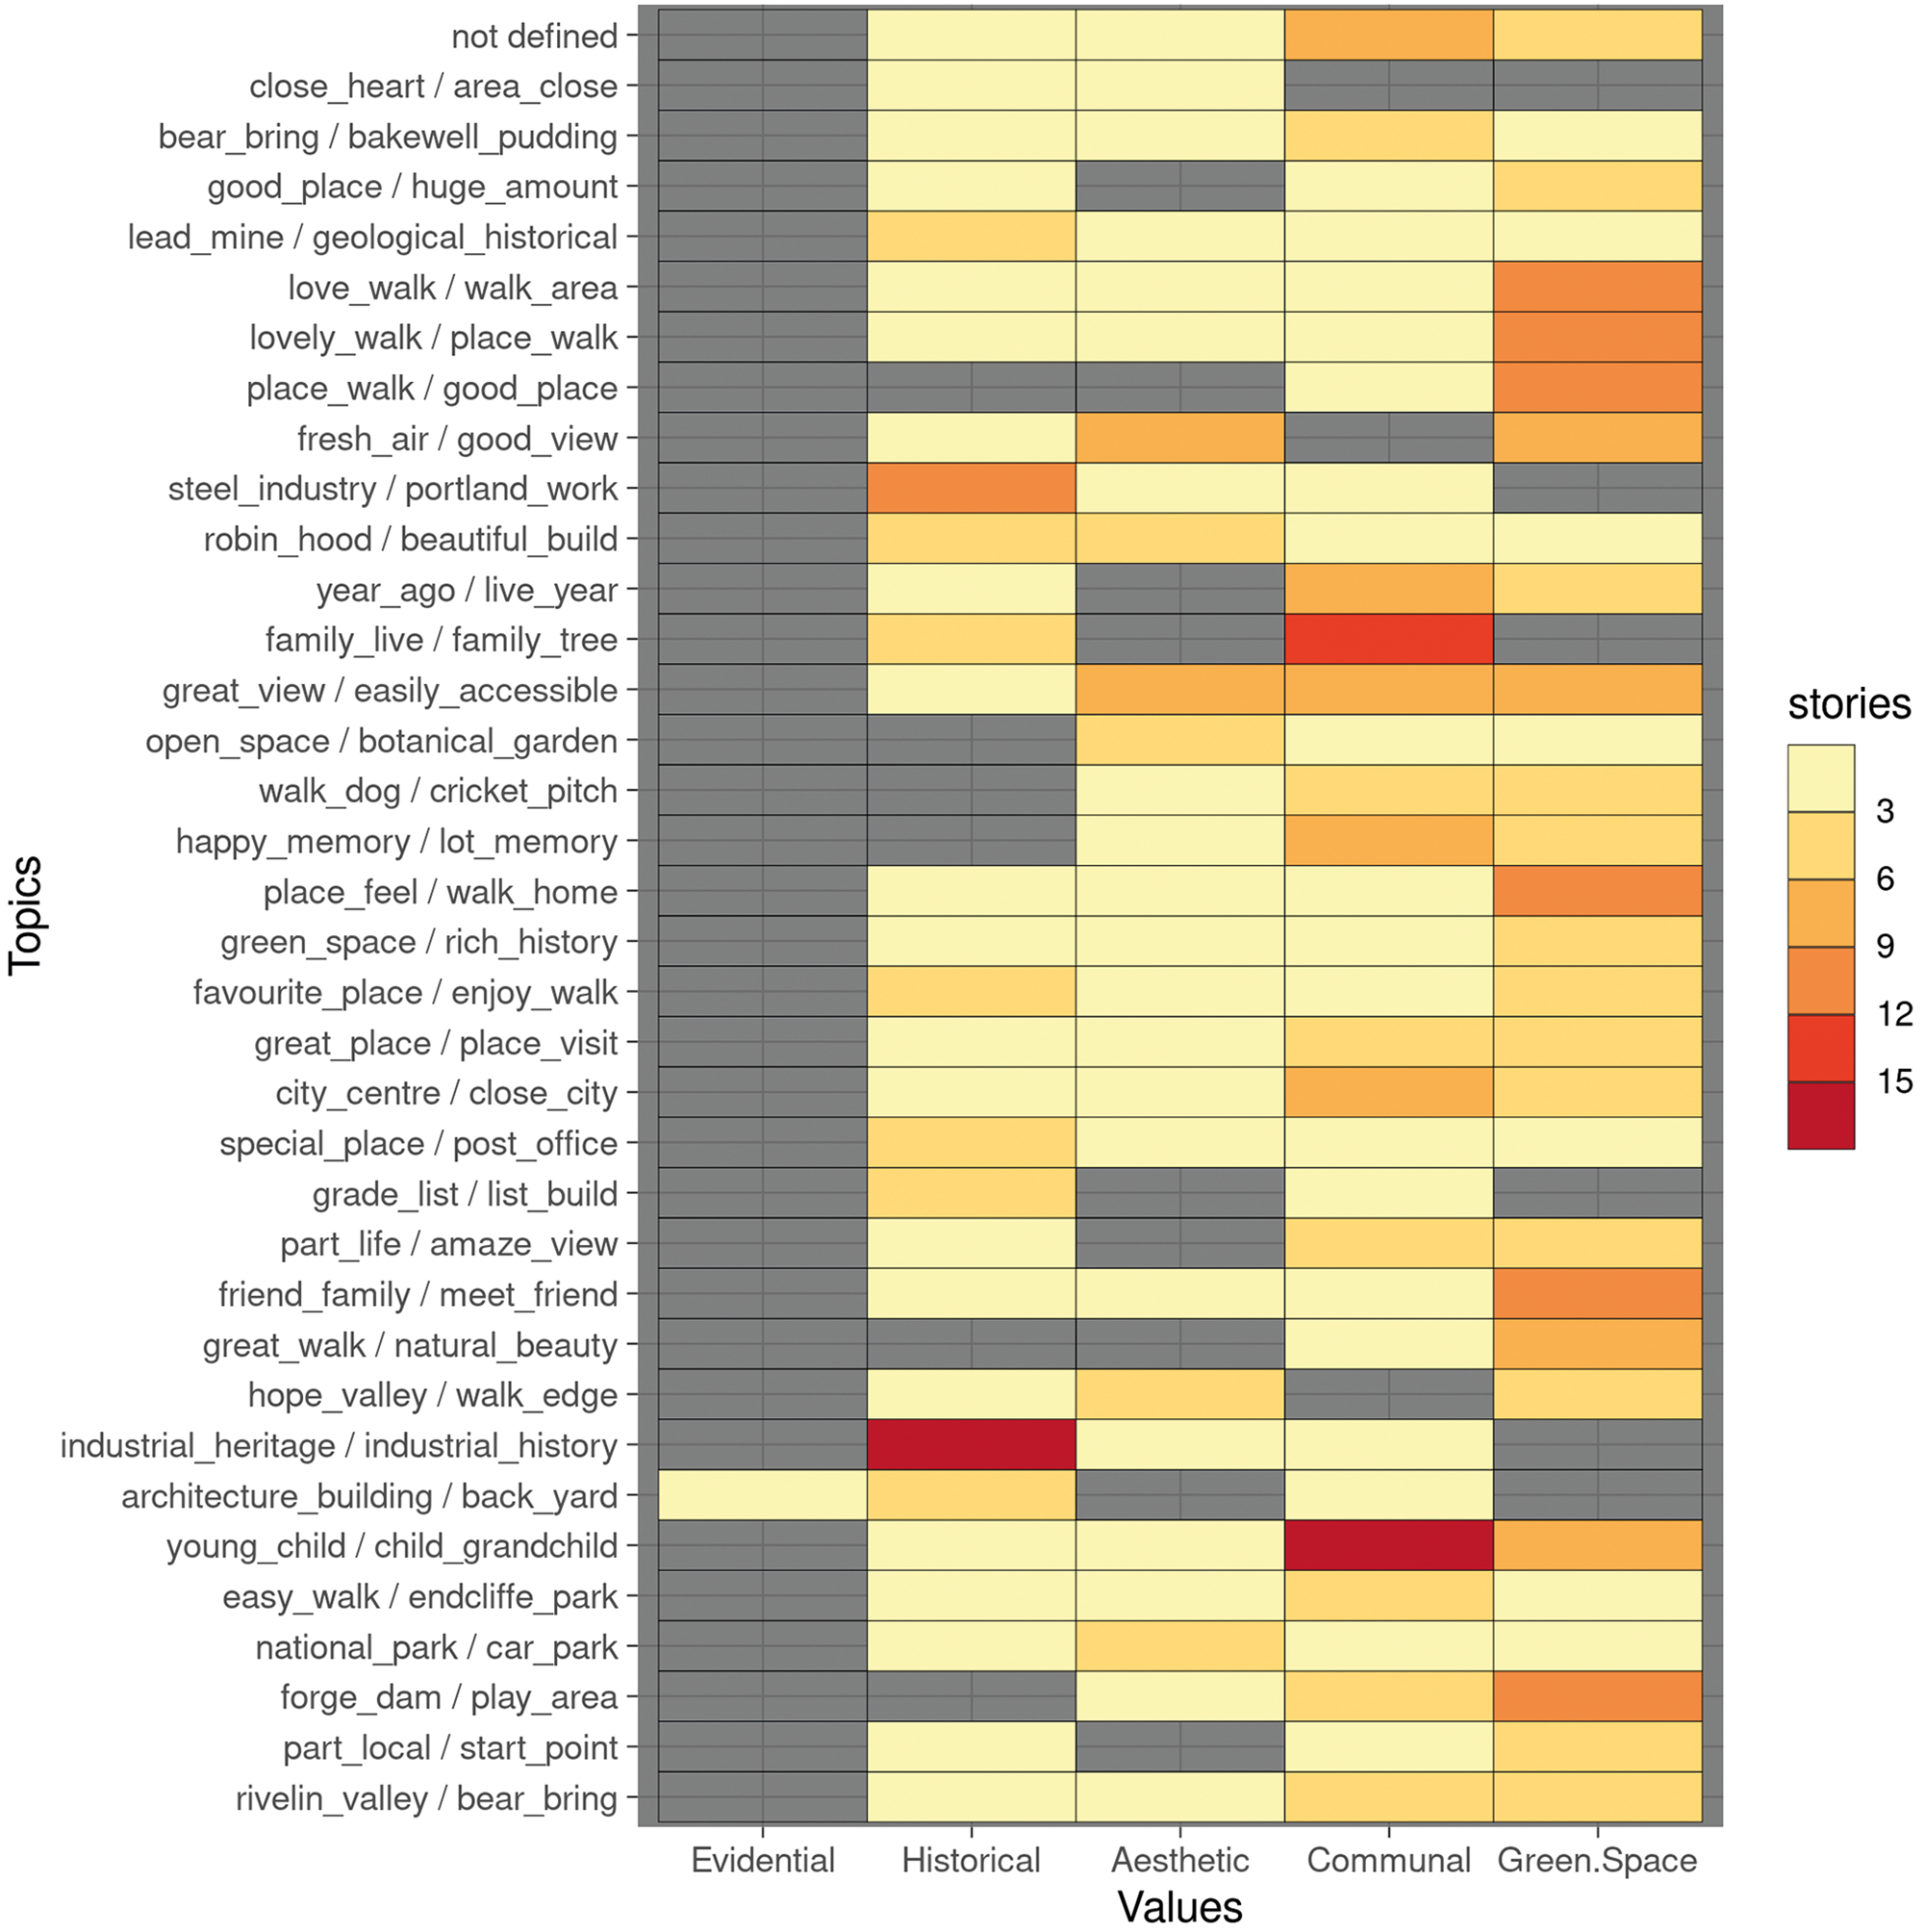
Figure 6. Result of manual evaluation of the topic modelling process. Document count over topics, showing the number of documents (stories) allocated to the corresponding value categories as defined by Historic England. High counts (red) show the dominant value category in a topic cluster. Rows with yellow cells (low counts) show incoherent topics with high variation in values. The proposed category for ‘Green Space’ value, including ‘Health’ value, dominates in the assessment.
The TM approach provided mixed results. Some documents did not provide a story and were not included in the clustering (n = 37). Other documents provided stories that were too short (just one or a few words), which did not allow the algorithm to cluster in a meaningful way. These documents were labelled 0 (n = 20). However, during the manual process, these documents could still be allocated to one of the categories. For example, ‘magical place’ was allocated to the subcategory ‘Spiritual’ value;Footnote 11 the location ‘Surprise View’ with the description: ‘In a word, “breathtaking”’ containing the keyword ‘view’ in the location name was associated with ‘Aesthetic’ value; the location ‘Kinder Ravine’ provided the description ‘Scrambling’, which was annotated with the code ‘outdoor activity’ and associated with the type ‘Green Space’ and the subcategory ‘Health’. In total, 510 documents provided sufficient textual data for the Topic Modelling algorithm to process.
The top-terms list created during the TM process clustered the most frequent words of each document, which provides the basis for the clustering decision and the labelling of each topic cluster. This list was used to decide on the most important keywords of each story or document. The resulting contracted list was subsequently condensed into a single one-word code. This code was used to allocate the document to one of the four value categories included and defined in Historic England's Conservation Principles (English Heritage 2008) (historical, evidential, aesthetic, communalFootnote 12) (Table 2).
Value category development
Automated Topic Modelling provides valuable first insight into the latent themes in the survey data. The stories showed clear trends and commonalities (Table 1). However, it was necessary to assess and refine the categories manually. It became clear that some of the documents could not be fitted into this predefined set of values defined in Conservation Principles; for example, topics labelled with ‘calm_place’, ‘great_walk’, or ‘nature_reserve’. A heatmap shows that survey respondents based their place attachment predominantly on communal, green space and health aspects (Figs 7 & 8) with green space and health dominating the relationship between people and places. A more nuanced approach to defining heritage values might extend the existing framework by further subdividing the category of communal values (private, spiritual, commemorative) to include ‘Arts & Culture’ (Fig. 7; Table 2), to capture the intangible qualities of the cultural aspect of areas in Sheffield, in particular. Furthermore, a new (sub)category of ‘Green Space’ would help to overcome the artificial divide between cultural and natural heritage which people rarely recognize (Byrne & Ween Reference Byrne, Ween and Meskell2015; Harrison Reference Harrison2020; Latour Reference Latour1993). This category would capture the values people place on wildlife and ecology, for example, while addressing the increasing awareness of environmental pressures on natural resources. Another subcategory of ‘Green Space’ value could be defined as ‘Health’ value (both physical and mental), which encompasses, for example, people's COVID-19 experiences and the different approaches to landscapes that have emerged as a result of the lockdowns that were imposed at this time alongside relaxation and the calming qualities of woods in Sheffield's parks that relate to public benefit.
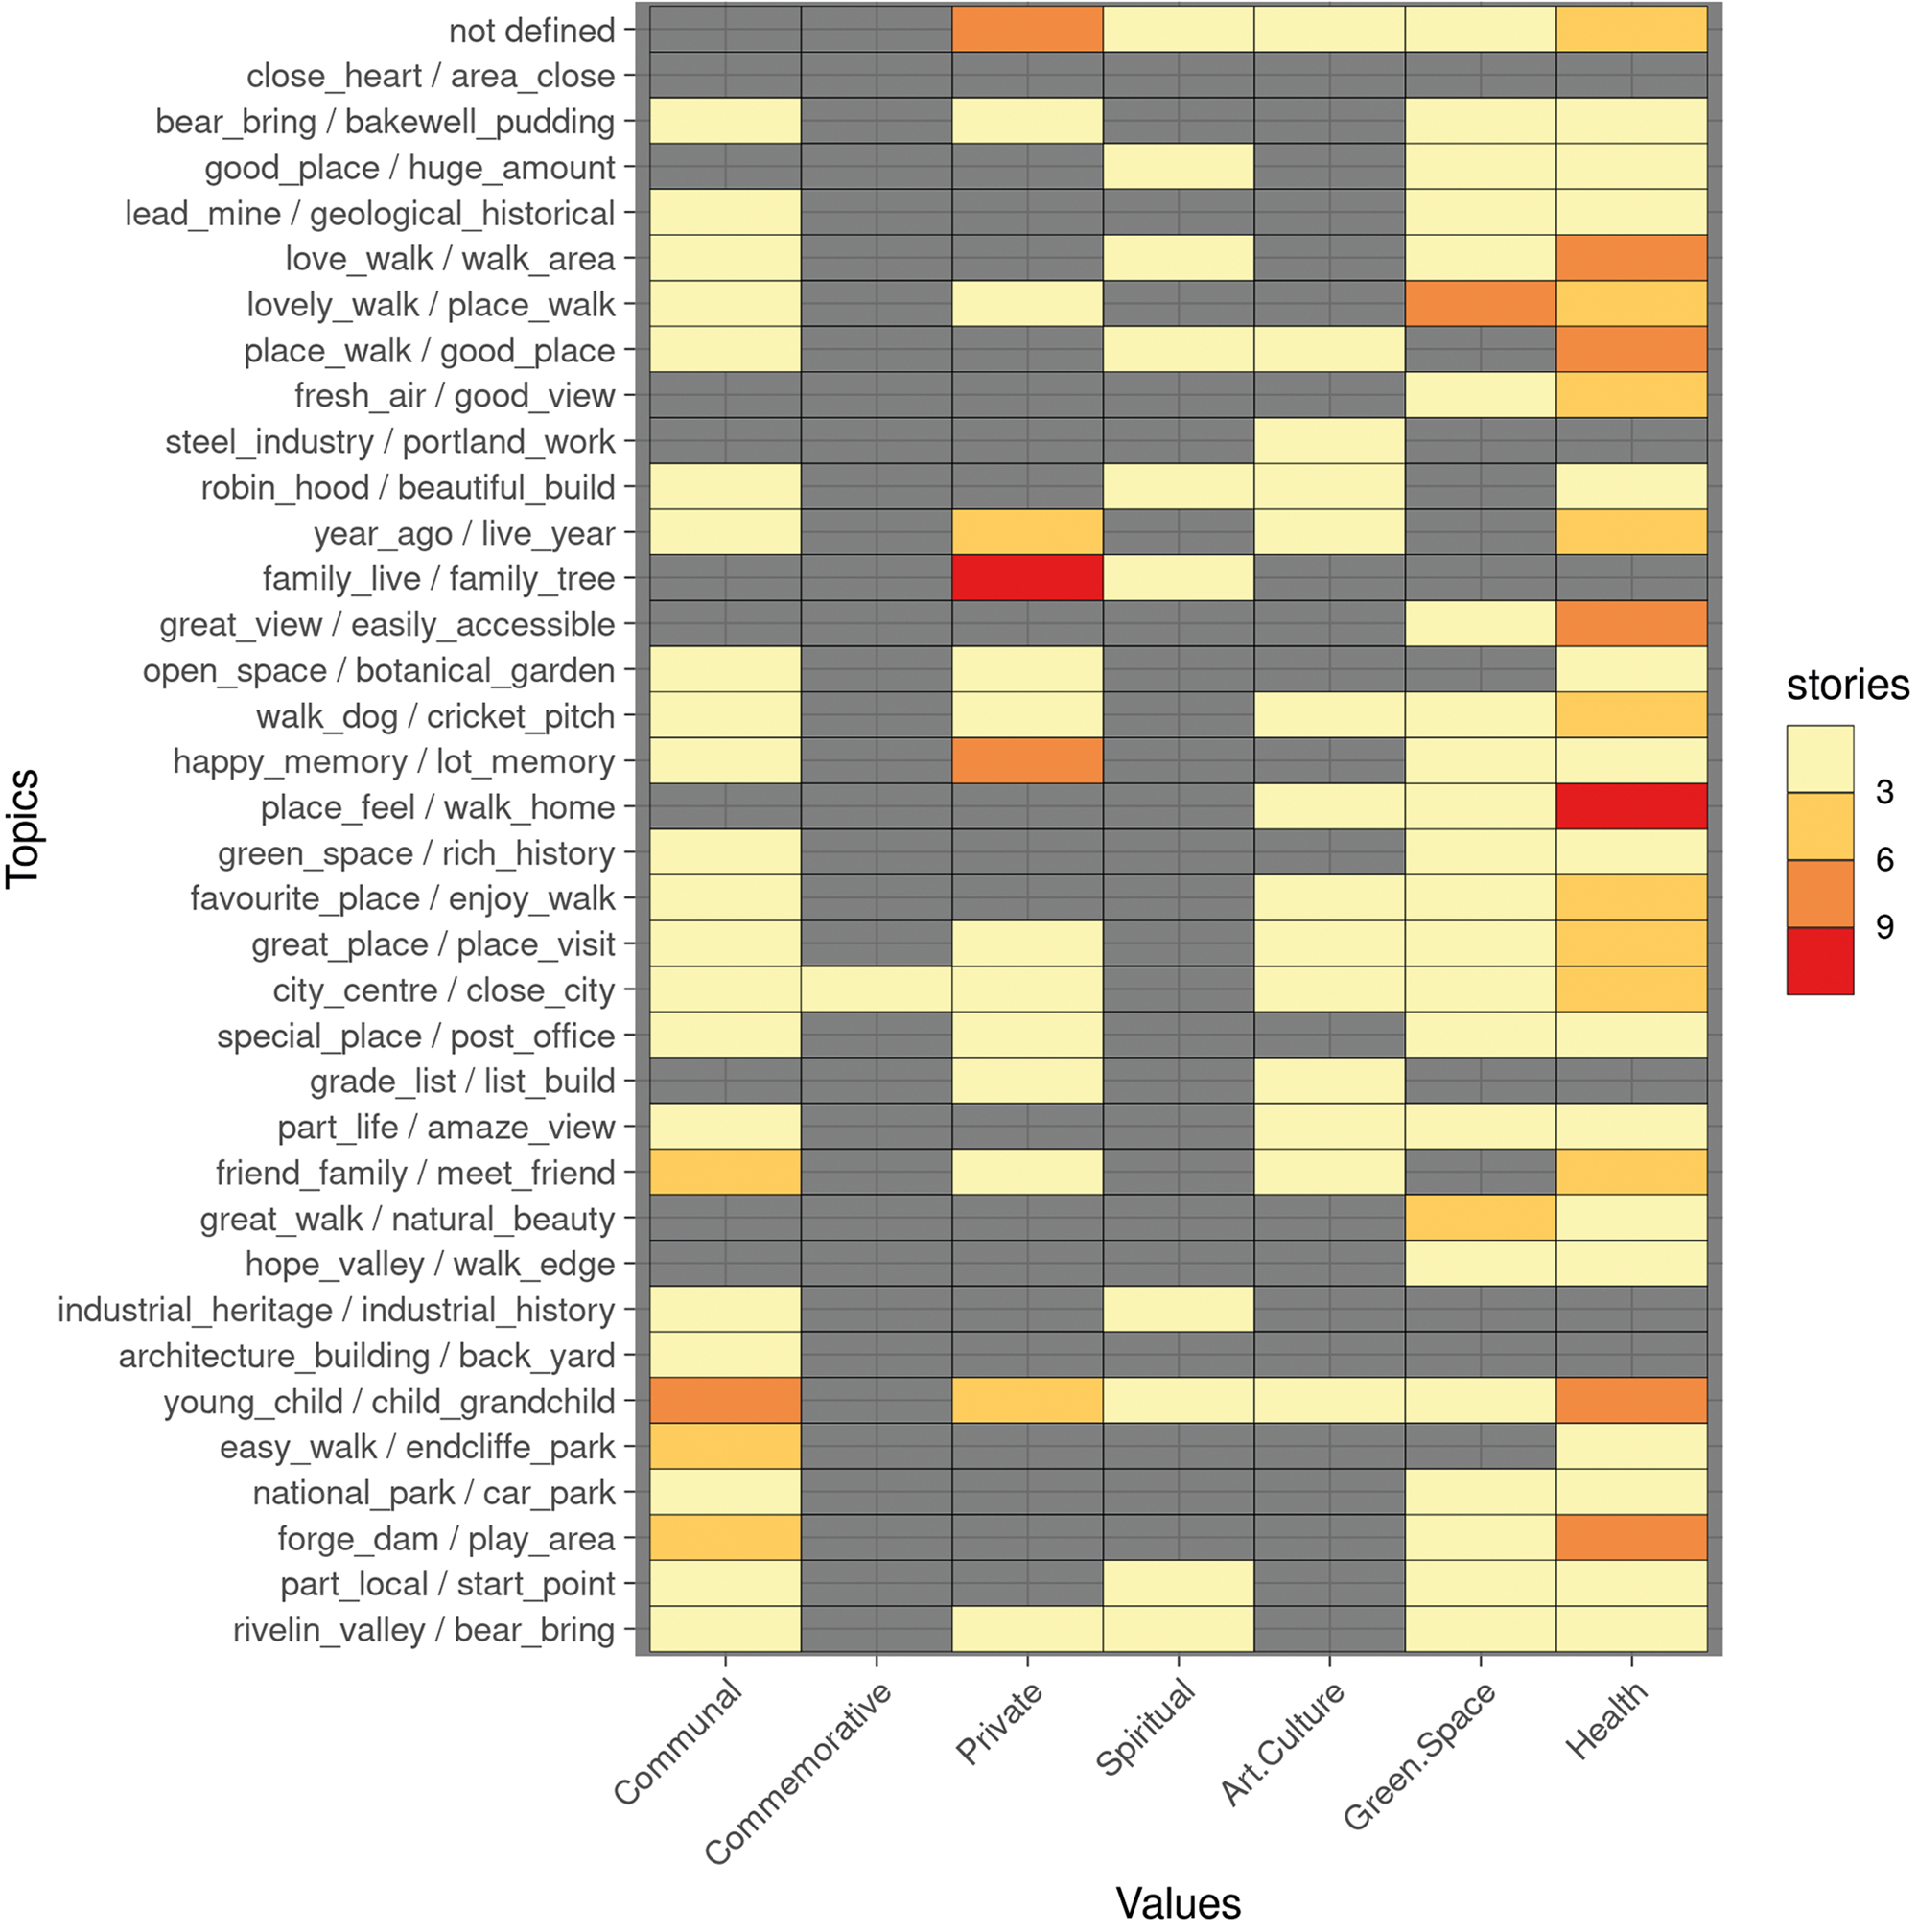
Figure 7. The category of communal values can be subdivided into private, spiritual and commemorative values, as set out in Historic England's Conservation Principles. Themes emerging from the survey data show a trend to connect places based on green space, health and arts & culture. Yellow colours in the heatmap represent low numbers of stories, while darker red colours represent higher numbers of stories categorized in the respective categories. The graph shows that survey respondents based individual place attachment predominantly on aspects of communal, green space and health aspects.
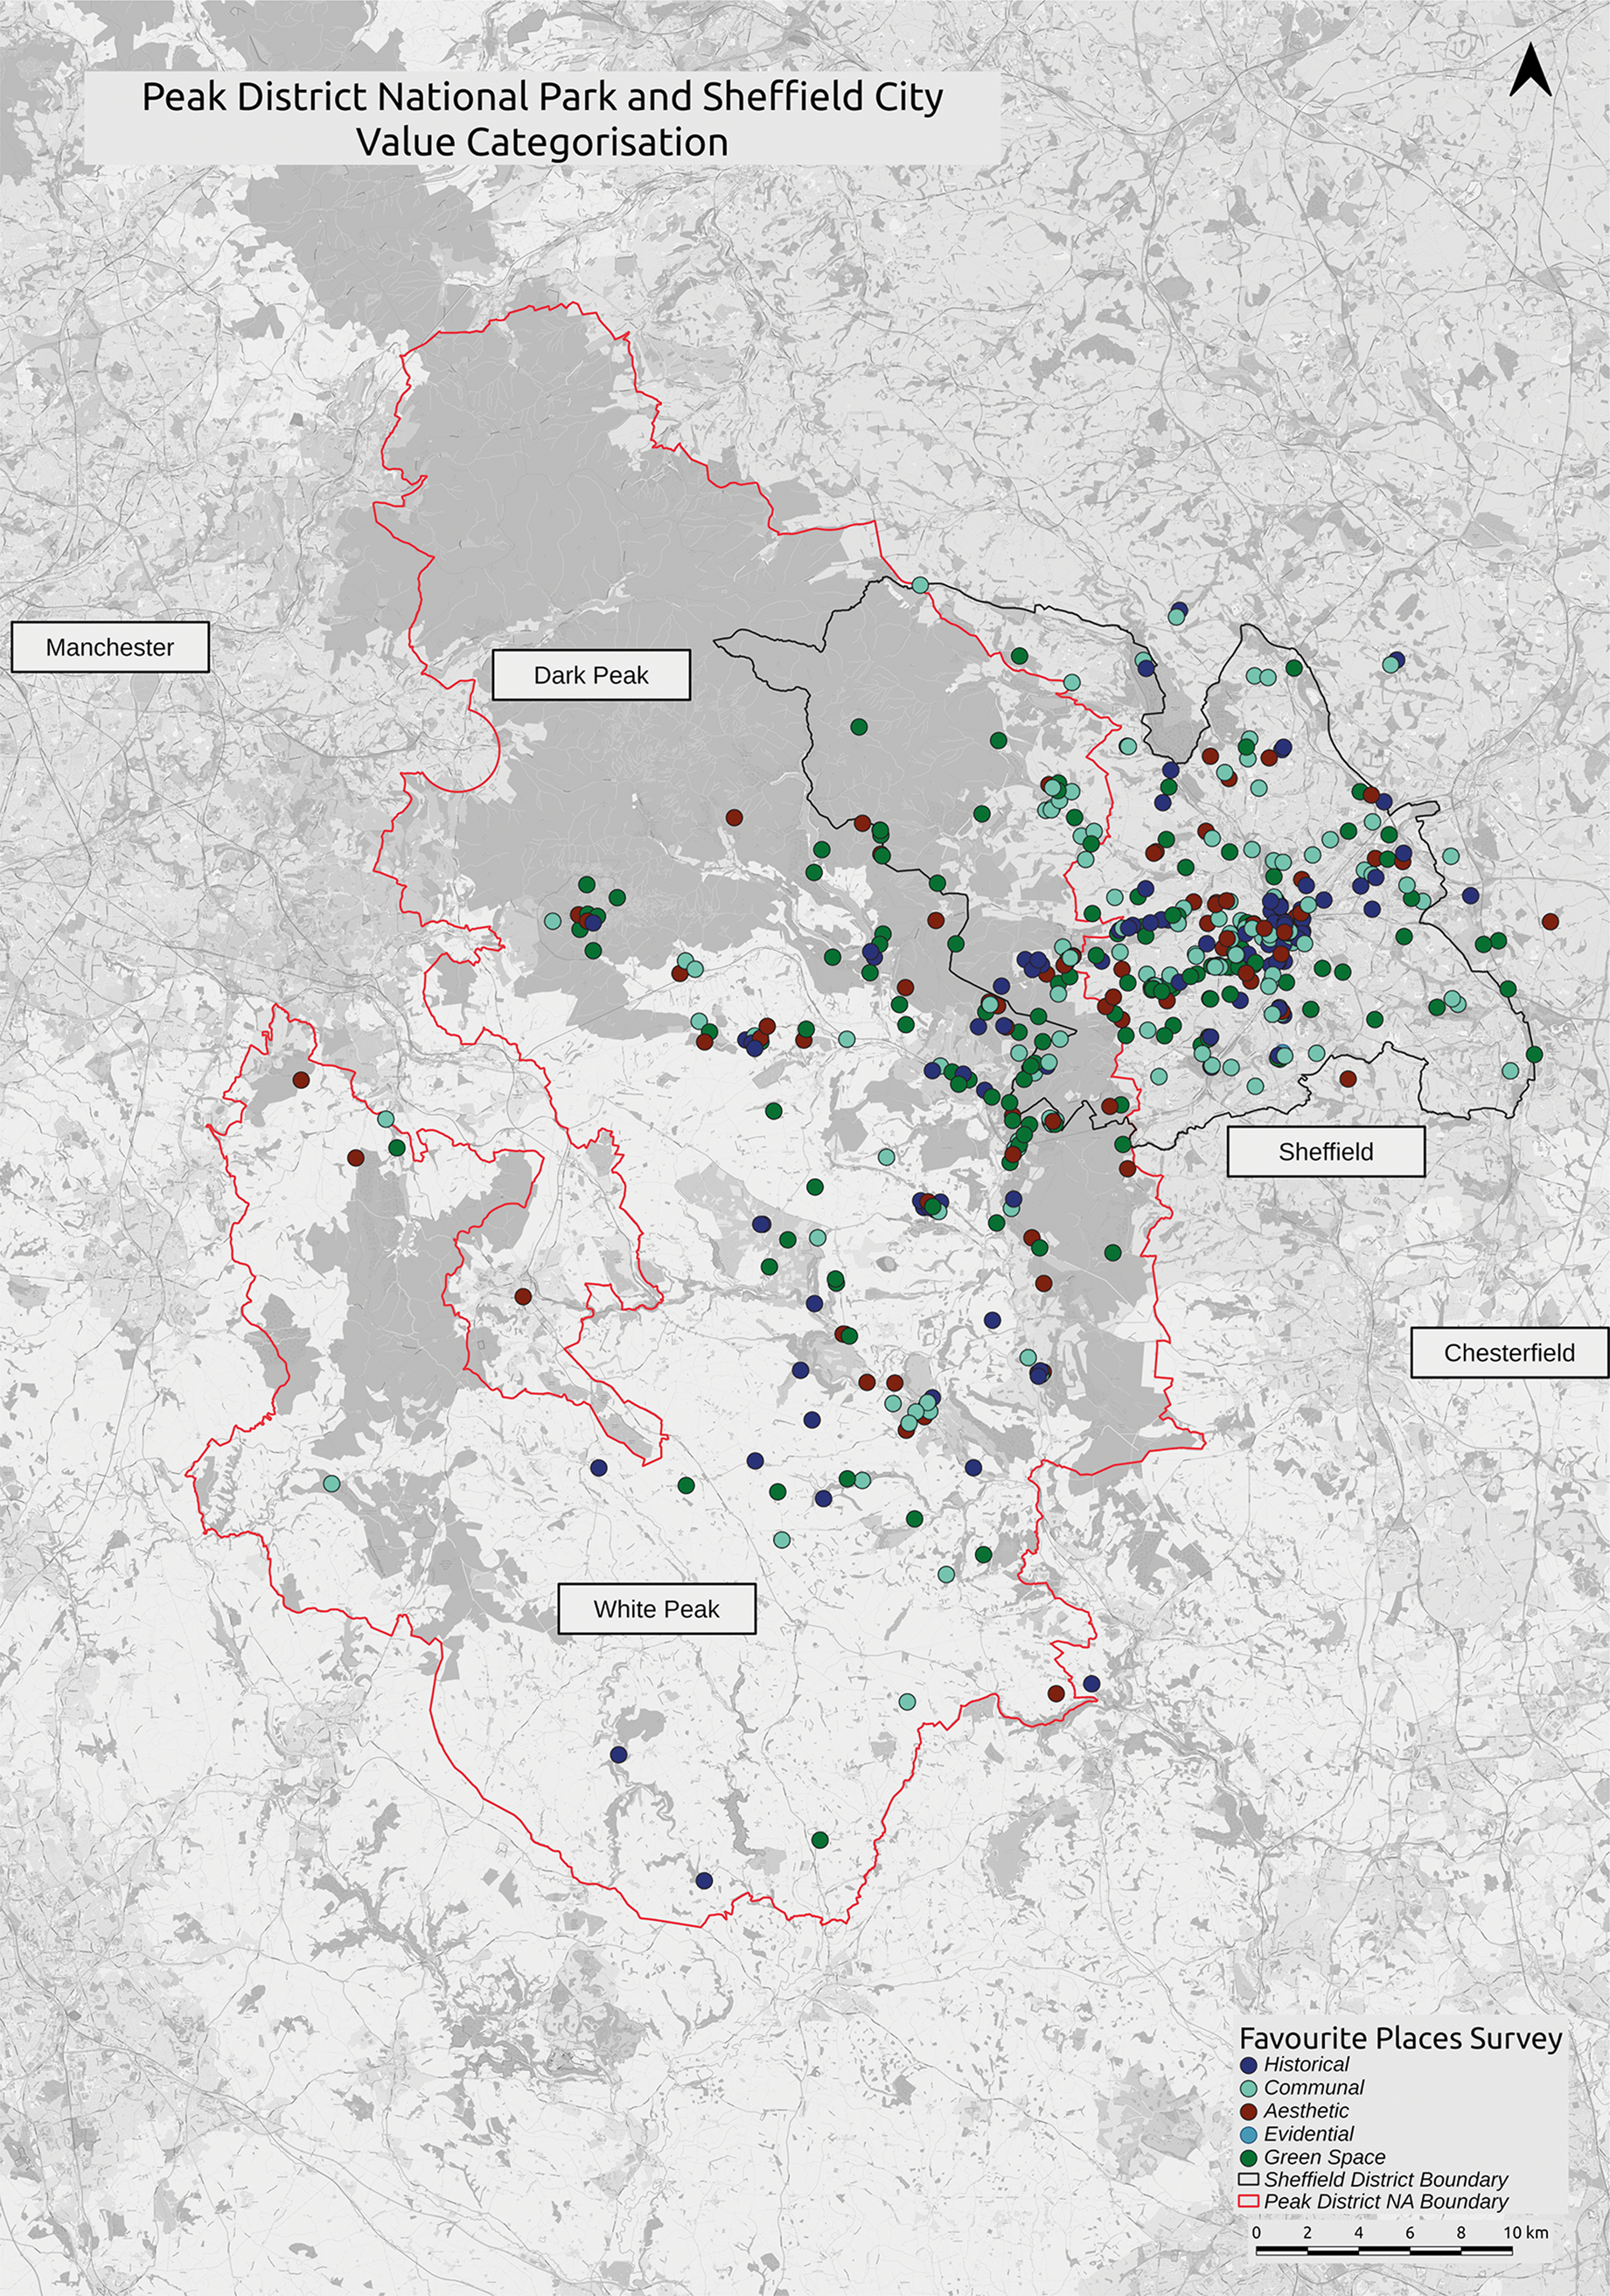
Figure 8. Mapped overview of categories across the study areas. Distinct areas show clusters. (Map created in QGIS; data contain OS data © Crown copyright and database right 2022. Map tiles by Stamen Design, under CC BY 3.0. Data by OpenStreetMap, under ODbL).
We can illustrate this argument with some examples. First, the document cluster of Topic 19 consisted of 18 documents. Label 1 was given as ‘place_feel’ and label 2 as ‘walk_home’. A list of the most dominant words in the stories showed that ‘lockdown’ was mentioned in five documents. Ten documents were labelled with the broad subcategory ‘Health’. These documents mentioned ‘access’ to ‘nature’ or ‘green spaces’, ‘peace’, ‘walking’, ‘calming’ and ‘relax’. Three documents were allocated to ‘Aesthetic’ and ‘Green Space’. The documents which were not allocated to the aforementioned categories were categorized as ‘Aesthetic (Design)’ (n = 3), ‘Historic (Associative)’ (n = 2), ‘Natural Resort’ (n = 2), and ‘Arts & Culture’ (n = 1). Topic cluster 24 was labelled by the algorithm as ‘family_live’ and ‘family_tree’. Of the 18 documents in this cluster, 12 were manually categorized as relating to ‘Private’ value and two to ‘Spiritual’ value. This exemplifies another cluster of high coherence and close association with the modelled labels.
Cluster 27 comprised 12 documents labelled as ‘steel_industry’ and ‘portland_works’; the manual assessment in this case showed that nine documents could be categorized as ‘Historical’ value, with the distinction of ‘Associative’ and ‘Illustrative’.
Figure 6 shows the distribution of documents (stories) over the developed catalogue of heritage values, as the result of TM and manual assessment/refined categorization. The colour scale indicates the number of documents for a topic cluster within each cluster. Dark red cells indicate a high number of documents in one category and, therefore, a good correlation of document content in the Topic Modelling process. Rows with yellow cells show a great variety of value categories in one cluster and low coherence in the respective cluster overall. Furthermore, the graph shows the value categories most dominant in the perception of survey responses. ‘Communal’ values were mentioned 142 times, ‘Historical’ values 104 times, ‘Aesthetic’ values 79 times and ‘Green Space’ qualities 175 times (of these, 119 documents were categorized as ‘Health’). Evidential value could only be identified in one document based on the description of the connection to a place. The topic allocation in Figure 5 can be correlated with Table 2. For example, Figure 6 shows Topic 8 to be most dominant, categorized as ‘Historical’ with labels in Table 2 defined as ‘industrial_heritage’ and ‘industrial_history’. This example shows a case where manual annotation confirmed the outcome of the topic modelling process. The dominant topics and categories in the proposed categories ‘Cultural’ value and the subdivision of the introduced category of ‘Green Space’ values with ‘Health’ can be seen in Figure 7. Apart from the category ‘Communal’ values, ‘Green Space’ and ‘Health’ feature most strongly in public perceptions.
In general, topics labelled as ‘young_child’ (Topic 6), ‘friend_family’ (Topic 11), ‘happy_memory’ (Topic 20), ‘family_live’ (Topic 24), ‘close_heart’ (Topic 35) were most dominantly associated with ‘Communal’ values (Spiritual, Private), while labels such as ‘place_walk’ (Topic 30), ‘love_walk’ (Topic 31), ‘place_feel’ (Topic 19), were associated with ‘Health’. Documents of the category ‘Historical’ value were labelled ‘lead_mine’ (Topic 32), ‘steel_industry’ (Topic 27), ‘grade_list’ (Topic 13), ‘industrial_heritage’ (Topic 8), ‘architecture_building’ (Topic 7).
Examples of stories provided by survey participants which qualified for the different categories are provided in Supplementary Material 2. For example, category ‘Green Space’ with the subcategory ‘Health’ frequently referred to ‘lockdown’ and the COVID-19 pandemic. Unsurprisingly, these areas were primarily located in the city of Sheffield, where people had to find open spaces for appropriate social distancing. A theme detected and correctly labelled by the algorithm was the practice of ‘ash scatters’ allocated to ‘Communal’—more precisely ‘Spiritual’ value—primarily associated with specific open-space and viewpoints in the Peak District National Park. Another subcategory of ‘Communal’ value is shown here as subcategory ‘Arts & Culture’.
These examples show that Topic Modelling found coherent topic clusters and labels suitable for a first insight and open-minded approach to the data with no preconceived assumptions and codes. The clustering can be useful for a first analysis as a basis for the preliminary coding in the second step of qualitative analysis and, subsequently, the allocation to specific heritage value typologies/categories.
Category visualization
QGIS was used throughout this project. The visualization of favourite places in both study areas can be seen in Figure 8. The map is presented as an interactive webmap where the points on the map can be selected and information on the personal connection (stories) provided in the form of a pop-up window. Photographs provided by the participants illustrate the places as an extra layer. Individual values can be selected and presented on the map, for example, only showing locations labelled with an aesthetic value or values for the calming qualities of the landscape. Figure 8 provides a background overview of the categories as set out by HE's Conservation Principles and the proposed additional categories as a result of this study.
The detailed maps give an indication of the values given to places as identified in this study. The values emerged from the stories based on personal attachment to these places. Figure 9 focuses on a central part of the PDNP with the village of Eyam, which is known as the ‘plague village’. An outbreak of bubonic plague in 1665 forced the residents of Eyam to isolate themselves under huge hardship to save the surrounding villages from a spread of the disease.Footnote 13 ‘Historical’ value dominates this location (n = 5).
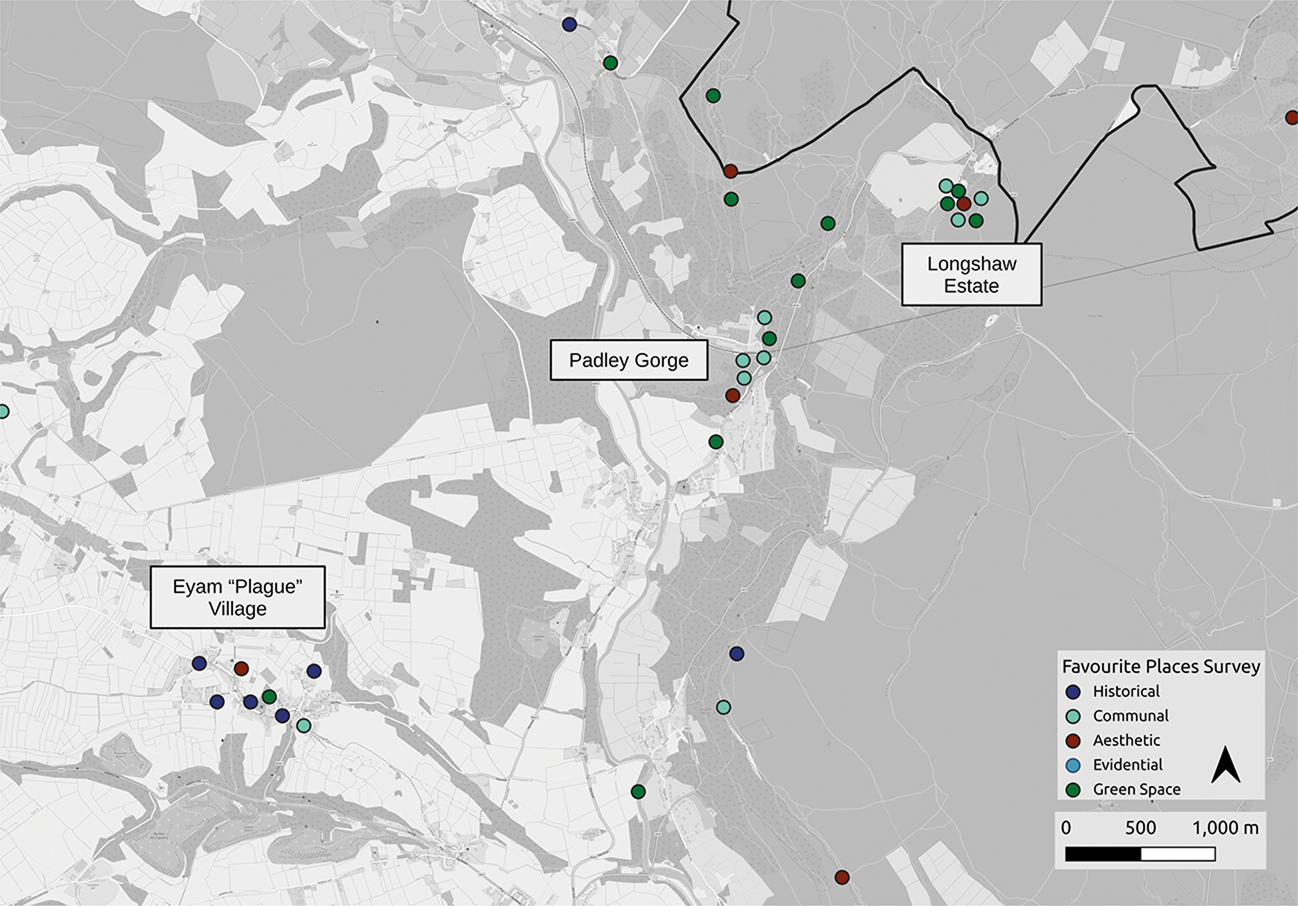
Figure 9. Detail of the overview map (Fig. 8). The plague village Eyam (lower left) is predominantly valued by survey participants for the ‘Historical’ value (n = 5). Padley Gorge (centre), one of the temperate rainforests of Britain (Shrubsole Reference Shrubsole2022), is valued for the ‘Green Space’ qualities (n = 4) and ‘Communal’ values (n = 4), similar to the National Trust's Longshaw Estate (upper right) with recognition given predominantly to ‘Green Space’ value (n = 3) and ‘Communal’ value (n = 3). (Map created in QGIS, © OpenStreetMap contributors; data contain OS data © Crown copyright and database right 2022.)
Notable for the river valleys, leading from the PDNP into Sheffield, is the difference of value-based connection as shown in Figure 10. The Rivelin Valley is predominantly favoured for its ‘Historical’ value which refers to the up to 20 watermills along the watercourse appearing from around 1600.Footnote 14 In contrast, the Porter Valley to the south is predominantly favoured for its ‘Green Space’ value and health benefits as a green space in the city centre. A detailed view on the city centre, visualizing categories and subcategories in Figure 11, provides insight into the values of residents associated predominantly with ‘Arts & Culture’ and ‘Historical’ value (each n = 12).
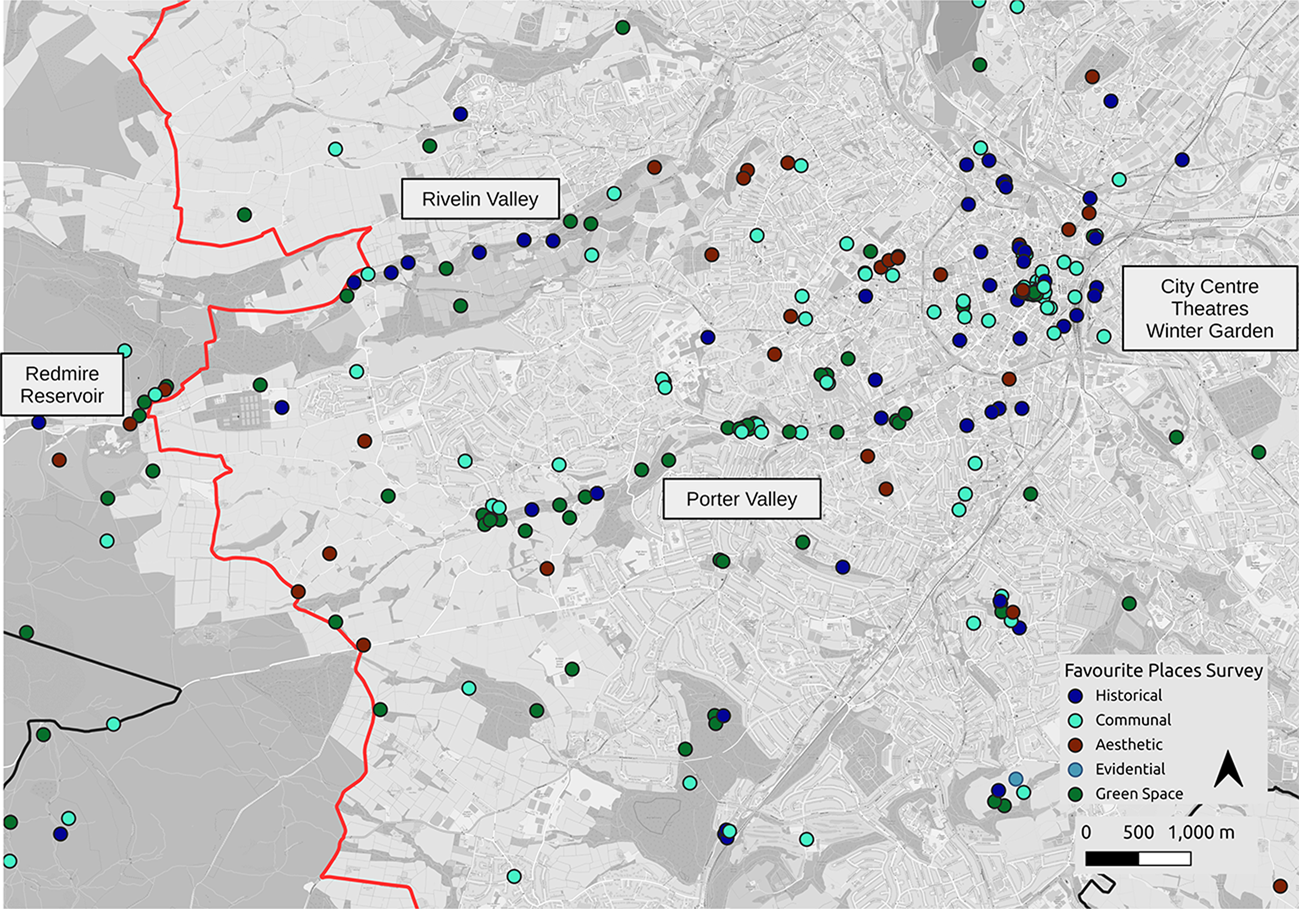
Figure 10. Detail of the overview map (Fig. 8). Notable is the difference between the public perception of the two valleys: Rivelin Valley (upper centre) and the Porter Valley (centre). Rivelin Valley, with its deep early industrial history present in the various sites of ‘Wheels’ along the river, is predominantly valued for its ‘Historical’ value (n = 6), while the Porter Valley in the heart of the city is predominantly valued for its ‘Green Space’ value (n = 14). (Map created in QGIS, © OpenStreetMap contributors; data contain OS data © Crown copyright and database right 2022.)
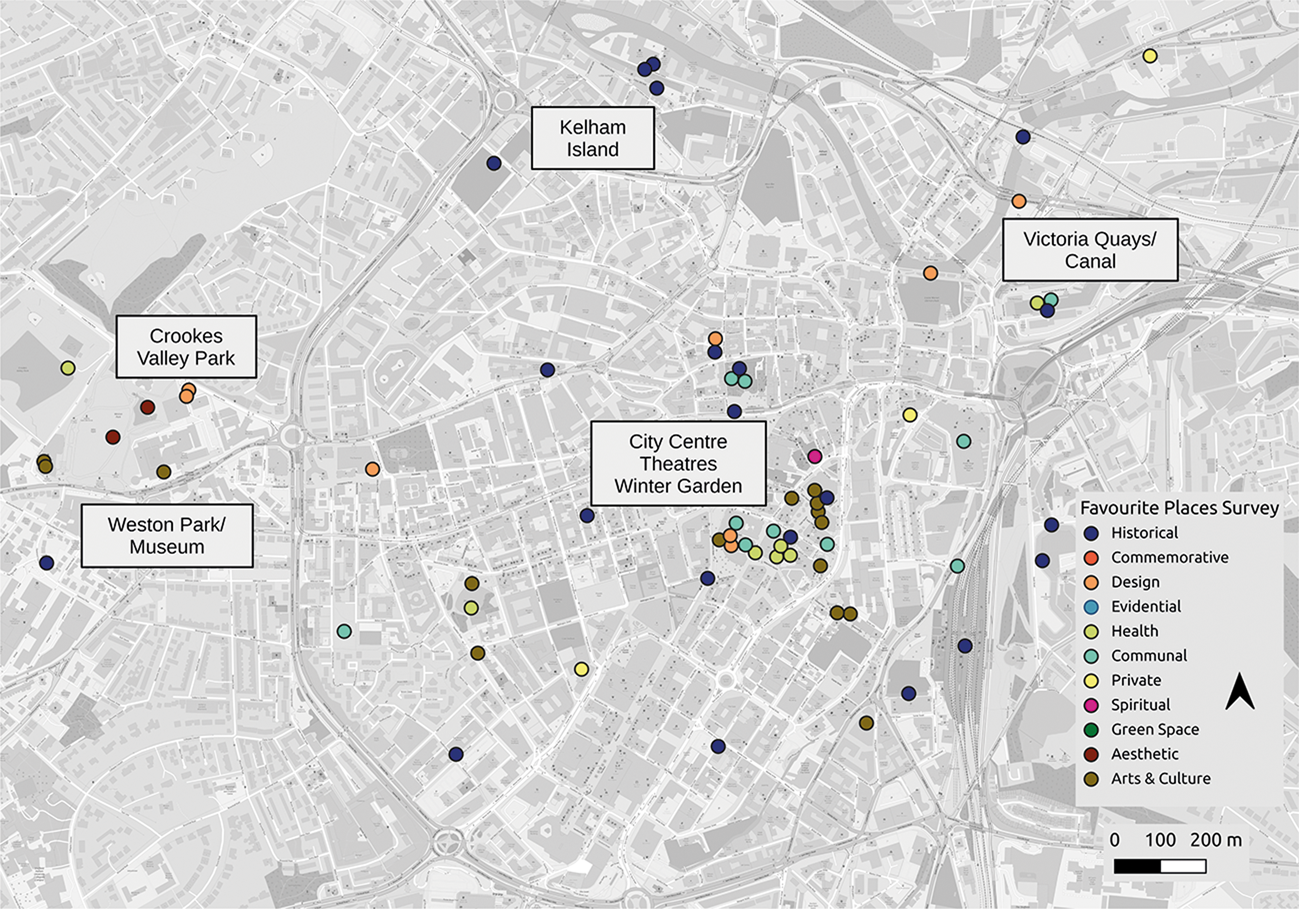
Figure 11. Detail of the overview map (Fig. 8). The legend provides a more fine-grained categorization. ‘Historical’ (n = 12) and ‘Arts & Culture’ values (n = 12) dominate. (Map created in QGIS, © OpenStreetMap contributors; data contain OS data © Crown copyright and database right 2022.)
The mapping of values that has emerged from the survey shows that individual, subjective stories have the potential to form an overall value pattern at landscape scale. The value distribution presents the varying and manifold valuation of places, showing how one place can have more than one meaning for the public. Nevertheless, despite a multiplicity of meanings and significances, current techniques allow the assessment, integration and visualization of public perception and place attachment in a form that can provide vital background for planning, alongside (notably and for example) Historic Landscape Characterization or HLC.
Limitations, biases and advantages of AI
It should be pointed out that qualitative research introduces bias at various stages of the research process. Our data collection introduced a limitation and bias as a convenience sample through the means of publication and completion of the survey. We fully acknowledge that marginalized groups have not been specifically explored and would certainly be a study that could follow up, be complementary to and contrast the findings of this paper (see Endnote 4). Both approaches—TM and Manual Observation/Annotation—introduce biases into the process of data analysis. The only automated process that is not influenced by the researcher is the phase where the TM model runs (the computation of the models). TM is based on a model algorithm, which is sometimes treated as a black box because of the complex mathematical ground on which the algorithms and statistical methods are based. However, to make the process as clear and transparent as possible, the choice of model algorithm and the definition of parameters must be documented. Appropriate models can be chosen depending on the analysis and data. Model parameters, such as iteration or number of topics, can be optimized and adapted to control the process.
The final assessment and analysis for the training dataFootnote 15 is manually observed by the researcher to create a model based on the training data, which can then be applied to new data for an optimization of Topic Modelling in the specific field—in this case, the categorization of heritage values in cultural landscapes. This introduces the human factor, which in turn introduces researcher bias into the methodology, similar to other qualitative research methods (i.e. NVivo or manual coding). Transparency and reproducibility can be achieved by rigorous documentation of the process.
By way of advantage, the use of TM allows topics and themes to be identified that emerge from or are latent within the data without having a preconceived set of codes. This approach eliminates the risk of researcher bias towards the topics introduced in the data analysis by preconceived codes. This constitutes a significant change in the way qualitative data can speak for themselves and can reveal patterns within the data, before the topics are then further analysed manually in the process of categorization.
AI offers the opportunity to create a reproducible, repeatable and automated workflow of processes, which would not be possible with various individual human assessors. The routine set-up for the analysis works on the same parameters in every iteration of the process. This makes it more reliable for the categorization of data provided by future surveys to review people-centred values on a rolling basis.
Discussion
Our methodology builds on approaches tested in previous studies: on research projects focusing on a people–place connection (Dalglish & Leslie Reference Dalglish and Leslie2016; Natural England 2015; Primdahl & Kristensen Reference Primdahl and Kristensen2016), and on approaches of other disciplines focusing on computer linguistics that provide methodologies for an application in heritage management (Goerz & Scholz Reference Goerz and Scholz2010; Sassolini & Cinini Reference Sassolini, Cinini, Calzolari, Choukri and Maegaard2010; Sporleder Reference Sporleder2010). AI has been successfully applied in Heritage Management, but not on a landscape scale (Bordoni et al. Reference Bordoni, Mele and Sorgente2016; Condorelli et al. Reference Condorelli, Rinaudo, Salvadore and Tagliaventi2020; Fiorucci et al. Reference Fiorucci, Khoroshiltseva, Pontil, Traviglia, Del Bue and James2020; Matrone et al. Reference Matrone, Grilli, Martini, Paolanti, Pierdicca and Remondino2020). Our research methodology therefore combines the approach from disciplines such as data science, geography, archaeology and urban planning on a landscape scale. Using Topic Modelling and a Grounded Theory approach to analyse and integrate public survey data as spatial representation into the planning process offers a way to overcome the challenges qualitative data can often represent in terms of practical application.
Themes emerging from stories of place attachment provided by survey participants in the Peak District National Park and the City of Sheffield align well with some of the existing heritage value categorizations set out by Historic England's Conservation Principles (Historical, Evidential, Aesthetic, Communal) (65 per cent). Notable, however, is the lack of ‘Evidential’ value (n = 1) in the perceptions of people with just one case, perhaps due to the lack of documentation on this value subject in a publicly accessible format (e.g. information boards, accessible documentation). However, ‘Communal’ value, usually not prioritized among other values in the significance assessment process, represents almost one-third of the traditional value categories. Within the City of Sheffield, the valuing of the cultural element of the city centre was notable, for which we propose an additional subcategory of ‘Arts & Culture’ value (which comprised 15 per cent of all ‘Communal’ value). It also became clear that 35 per cent of all personal connections to place were based on experiences during the COVID-19 pandemic and with a strong orientation toward the use of landscape for mental and physical health benefits (Fagerholm et al. Reference Fagerholm, Samuelsson and Eilola2022). Therefore, we propose the introduction of the category ‘Green Space’ value to bridge the artificial division between natural and cultural heritage. Some 71 per cent of the data in this category showed a close relationship between nature and health.
These results show that single, individual opinions collected in a public online survey can map onto the landscape as heritage values based on people's individual, personal and subjective connections to place. The argument that individual opinions or the public view cannot be considered in the valuation process of landscapes (because it is too difficult, or the data are too diverse to be meaningful) is therefore no longer tenable. We will return to this point in the conclusion. Individual opinions—when aggregated—can create a generalizable pattern of heritage valuation. The detailed view of the two river valleys in Sheffield exemplifies how personal stories can form a coherent pattern of such values. We present this example, therefore, as proof of concept for a method that is suitable for integrating people-centred landscape perception and values within a framework for assessing landscapes within planning and decision-making processes. We also argue for this grounded approach providing the basis for generating entirely new categories or sub-categories of values, rather than trying to force observed values into a predefined framework. While we suggested a bottom-up approach to obtain insight into the perceptions of people's understanding and valuing of the heritage in their everyday environment, the information should be understood as an additional layer of background information in the framework created by Historic England. This dataset will enable us to make decisions shaping people's neighbourhoods on a wider base of information including the crucial dataset of ‘insider knowledge’. While this study provides a snapshot in time, complementary studies can contribute to a completion of the picture and further automation of the process can allow data collection and analysis on a rolling basis for up-to-date datasets (Tenzer Reference Tenzer2022; Tenzer & Schofield Reference Tenzer and Schofieldn.d.).
Our research has highlighted potential areas for future work, for example, the automation of the topic clustering and labelling process, including the application of the proposed value categories in a supervised topic modelling approach. This is necessary as the unsupervised model only works with words used in the documents (stories) and not the English Heritage (2008) value categories. The topics are only sometimes sensible and coherent (meaning high coherence and meaningful clustering). In the future, the datasets created from this work could be used to train supervised deep-learning models that can then be used for fully automated labelling and the classification of users’ responses.
Furthermore, there is scope to integrate a more refined approach to survey participants and the inclusion of visitors or demographically to explore variance in perception. A more fine-grained study could explore marginalized communities and the integration of heritage from a different perspective. Also, a focus on the visualization of qualitative data could develop a more nuanced representation of value categories in GIS. Finally, developing the theory of perception and value production in different contexts and communities could increase the understanding of what makes landscapes and people's everyday heritage vital for developing a sense of place, identity and belonging.
AI technologies are set to revolutionize the opportunities to understand and present datasets from heritage and archaeology. New tools and methods are currently being developed by a loose community of digital archaeologists, computer linguists and data scientists that, together, have yet to find a more inter- and trans-disciplinary approach to the question of values. However, the trends to cooperate are promising and will bring into the future the methods of various disciplines concerned with the past and with landscape.
Conclusion
This study has developed a novel method that allows the integration of people's connections with place into the assessment framework of landscape and heritage management. Furthermore, this research has introduced Topic Modelling combined with a Grounded Theory approach with a bias-reduced, time-efficient and repeatable method to interpret and categorize people-centred values of everyday heritage. This innovative approach to qualitative data collection for heritage planning can give local authorities and heritage organizations the opportunity to embed locally held values of heritage within landscape management processes.
The meanings and values people place in the landscapes of their everyday lives are more varied and personal than widely considered in heritage and landscape assessment. Individually held, subjective values form a category for heritage assessment that should not be underestimated for its capability to shape identity, create deep bonds and positively impact place-making [in terms of] more than just anecdotal evidence (Modesto & Waterton Reference Modesto, Waterton, Bennett, Carter, Gayo, Kelly and Noble2020). However, this is not about individual opinions; rather it is about gaining a deeper understanding of what drives the development of a sense of place, belonging and identity, and how this can change over time. It is also about recognizing the significance of locally held views and values in creating a more inclusive approach to heritage management than that which exists currently, at least in the Anglophone world. This study shows how diverse meaning and valuing is within communities, but that it can form a distinctive pattern across the landscapes and that this pattern can be both captured and accommodated within the planning process and in heritage management strategies.
Acknowledgement
This project was carried out as a part of an AHRC/UKRI WRoCAH-funded PhD project at the University of York. Grant reference number: AH/R012733/1. The authors want to thank Anna Badcock (PDNPA) and Zac Nellist (SYAS) for their support for this project and help to publish the survey through organizational channels.
Supplementary materials
Supplementary materials may be found at https://doi.org/10.1017/S0959774323000203


 Open access