

The literature in political economy has shown that electoral rules are essential to explain the composition and levels of public spending across countries. In particular, many authors have argued that the provision of social policies will be higher in proportional representation (PR) electoral systems compared to majoritarian ones. However, a key assumption in most important theoretical works is that the population is homogeneous or perfectly segregated across districts.Footnote 1 Yet public policies have beneficiaries that are not necessarily homogeneously spread across territories. This means that the theoretical relationship between electoral rules and public spending might not generally hold. Our article contributes to developing these caveats by studying whether the effect of electoral rules on governments’ provision of public spending is contingent on the geography of social recipients. More specifically, we hypothesize that the incentives to provide social spending in majoritarian systems will increase when social recipients are geographically concentrated. We test this argument with data on social spending in twenty-two OECD countries and find supportive evidence. The empirical evidence suggests that geographic clustering can bring social spending in majoritarian systems to levels equal to those in PR systems.
This article speaks to recent developments in political economy that explore the role of economic and political geography in redistribution, representation and policy provision.Footnote 2 More specifically, our theoretical argument is in line with several studies that focus on the joint role of geography and electoral institutions in the provision of certain policies, such as trade,Footnote 3 antipoverty policiesFootnote 4 or labour policies.Footnote 5 These works provide evidence that the effect of electoral rules on the distribution of targeted public spending cannot be understood without considering the geographical concentration of recipients, whether they are industries or individuals. This article contributes to this literature by arguing that this framework of analysis can also be applied to universal policies, such as social spending. When the beneficiaries of these policies are geographically defined, politicians may have incentives to use welfare spending to target specific districts. Hence, we expect electoral officials under majoritarian electoral rules to increase the provision of social policies when social recipients are geographically clustered.
The article extends the existing literature in several ways. First, the empirical stakes in our analysis are more challenging than those in previous works, as we apply general predictions about the impact of geography in a worst-case policy type, namely universalistic policies with limited scope for territorial targeting. Secondly, our theoretical model does not take to task the basic structure of politicians’ incentives under majoritarian rules (that elected officials in single-member districts will attempt to win seats by catering to local interests), but uses the same logic to predict that seemingly ‘universalistic’ policies may also be strategically used to compete for votes in low-magnitude districts. Thus the article provides new theoretical insights to help explain variation among majoritarian systems rather than simply focusing on the variation between electoral system types. Finally, by analysing how the geography of social recipients moderates the impact of electoral rules on public spending, our article provides a more nuanced account of the conditional effect of electoral institutions. Doing so also advances the debate on whether institutions make a difference to political processes and outcomes, in general, and public spending in particular.
The article proceeds as follows. The next section reviews the arguments on electoral systems and social spending and presents the main hypothesis. The following section introduces the variables, data and methods, while subsequent sections present the results, robustness checks and conclusion.
SOCIAL POLICIES, ELECTORAL SYSTEMS AND GEOGRAPHIC CONCENTRATION
Why do levels of provision of social policies vary across countries? This has been a highly discussed and analysed question in political science. The long-standing literature spans from the classical works on welfare policies that rely on nationwide cleavages to explain levels of redistributionFootnote 6 to an extensive body of work that explores alternative explanations such as the corporatist structure of the state,Footnote 7 the openness of national economies,Footnote 8 the strength of the labour movement and left parties,Footnote 9 or the distribution of general and specific skills among the population.Footnote 10
A number of studies in the last fifteen years have instead focused on the role of the electoral system in explaining country-level variation in the composition and levels of social provision and redistribution. Iversen and SoskiceFootnote 11 argue in a prominent study that the provision of social policies is higher under proportional electoral systems than under majoritarian rules because left-leaning governments are more likely to be formed under PR rules.
A strand of this research that has flourished in recent years comes to a similar conclusion – proportional systems redistribute more than majoritarian ones – but focuses on the degree of the targetability of public goods vs. pork-barrel spending and the geographic incentives provided by each type of electoral system.Footnote 12 The argument is that policy makers in majoritarian electoral systems – which have many low-magnitude districts – have incentives to implement narrow distributive policies to target specific, geographically concentrated groups of voters instead of providing broad (nationwide) social policies. In contrast, politicians in proportional systems try to maximize their chances of winning national electoral support by using social and welfare policies that advance the interests of voters spread across many districts or the whole nation.
Yet empirical evidence on the relationship between electoral rules and the size and composition of public spending is not conclusive.Footnote 13 This might be explained, at least partially, because this literature has largely overlooked the role of the geographical distribution of beneficiaries of public spending. The absence of geography is not unique to the study of the effects of electoral rules, but has characterized some of the most important theoretical contributions in political science, such as the spatial theory of elections,Footnote 14 the median-voter model on redistributionFootnote 15 and the subsequent theoretical works they inspired. As Rodden puts it, geography has generally been ‘a blind spot for political scientists’.Footnote 16 However, recent contributions in political economy have begun to develop some interesting insights into the role of political and economic geography in explaining the level and composition of public spending.Footnote 17 Some research has argued that the provision of narrow policies, such as trade,Footnote 18 antipoverty policiesFootnote 19 or labour policiesFootnote 20 can be explained by the interaction of electoral institutions and geography. We help advance this literature by arguing that the concentration of beneficiaries also provides greater scope to target public goods geographically. Certainly, when recipients of policies are unevenly distributed across jurisdictions, seemingly ‘universalistic’ programmes of public spending may de facto turn into regionally distributive spending in the sense that beneficiaries are geographically defined. This means that although spending may formally continue to be non-excludable public goods, some geographical areas with a low concentration of recipients may in practice be excluded from the lion’s share of spending, while the benefits concentrate in others.
THE ARGUMENT
Our basic theoretical argument is that in a majoritarian electoral system, politicians will have more incentives to be responsive to social recipients when they are concentrated in certain districts. As a result, levels of social expenditure will be higher in majoritarian systems where social recipients are geographically concentrated than in a similar electoral system where they are evenly distributed across a large number of districts. This hypothesis is grounded on both demand-side and supply-side mechanisms. In essence, we contend that the geographic concentration of recipients in majoritarian systems: (a) enhances the electoral reward of responding to the interests of social beneficiaries (demand-side explanation) and (b) facilitates the coordination of legislators’ electoral strategies and, in turn, the bargaining power of a pro-social legislative coalition (supply-side explanation).
The concentration of individuals with similar (social spending) demands in small districts increases the likelihood that this group of voters will become pivotal for any politician trying to win the district seat(s). Assuming that political elites are electorally motivated – that is, that they will choose the level and composition of social spending that best serves their electoral interests – legislators will have greater incentives to cater to the interests of social recipients when they represent a relatively high percentage of the population in some defined districts.Footnote 21 In addition, as JuskoFootnote 22 has previously noted regarding antipoverty policies, social spending that is based on income support (which represents two-thirds of social spending)Footnote 23 is particularly well suited for electoral use because transfers in cash, such as unemployment benefits or pensions, are highly visible: beneficiaries clearly recognize that they are directly benefiting from this spending. These voters will tend to vote for politicians who, if elected, will increase their expected income. More importantly, we expect this electoral behaviour to be more similar among social recipients than among other sectors of the electorate. As social demand is correlated with low income levels, social recipients are more likely than other voters to be responsive to in-cash benefits.Footnote 24 This means that each unit of social spending yields higher electoral elasticity: the marginal increase in support for politicians who implement an increase in spending is higher among social recipients than among other electorates.Footnote 25 In summary, the geographic concentration of recipients makes transfer programmes more attractive to political elites in majoritarian electoral systems because: (a) social recipients are more likely to become a pivotal group of voters to win legislative seat(s) in low-magnitude districts and b) they are more likely to be electorally responsive to an increase in their expected income. In consequence, we expect higher levels of social provision in majoritarian systems where recipients are geographically concentrated than where they are dispersed.
As far as the supply-side mechanism is concerned, we argue that the concentration of recipients makes electoral strategies converge among legislators – which facilitates coordination and, in turn, strengthens the bargaining power of the pro-social coalition. In majoritarian systems districts are smaller and more numerous, so the territorial concentration of recipients is more likely to affect a number of electoral districts than in systems with larger districts. As the number of constituencies in which recipients are over-represented increases, so does the number of legislators for whom increasing social spending becomes a winning electoral strategy. Convergence of electoral interests among legislators facilitates the coordination of electoral strategies and, in turn, increases their leverage to change the provision of social policies. Unlike pork-barrel spending, where provision is more likely driven by bilateral agreements between legislators, levels of social provision can be more easily increased by coordination among legislators who represent districts with high concentrations of social policy beneficiaries.
A final caveat is that, as long as the demand for social spending can correlate with low income, a potential source of criticism of our argument is that higher levels of social spending may be opposed (and in turn prevented) by a coalition of legislators from richer regions (who are unwilling to raise taxes to pay for higher redistribution). However, the distributive tensions that result from regional inequalities have been addressed in different ways in different countries, and clearly not always in the direction of richer regions demanding less redistribution. On the one hand, political parties play an essential role in mediating distributive disagreements among regions. Where political parties are integrated, strong national party leaders can more easily discipline regional copartisans to make them comply with the national party’s guidelines.Footnote 26 Put it differently, national party leaders have strategies availableFootnote 27 with which to extract compliance from legislators and appease within-party conflict over regional redistribution.Footnote 28 On the other hand, even where political decentralization provides political leaders with the institutional leverage (and resources) to express their preferences, there are prominent examples among federal countries – such as Canada, Germany or Spain – in which rich regions have accepted high levels of redistribution.Footnote 29 As Beramendi shows for the Canadian case,Footnote 30 risk sharing between regions is one of the key factors in shaping preferences for redistribution; if there is high mobility of social recipients, wealthy regions may be more willing to accept public insurance programmes to prevent cross-regional externalities.
Table 1 summarizes the interaction between electoral institutions and the geography of recipients in explaining the provision of social policies. Columns represent divisions across electoral institutions, whereas rows capture variation in the distribution of recipients. Our main hypothesis is that when recipients of social policies are concentrated geographically, politicians in majoritarian systems will have more incentives to provide social policies than in contexts where recipients are more evenly distributed (D>B). On the contrary, we expect the standard prediction in the literature to hold (A>B) for low levels of concentration.
Table 1 Level of Provision of Social Policies According to the Electoral System and the Geography of Recipients
We expect the geography of recipients to have no significant impact in the provision of social policies in proportional systems (A=C, ceteris paribus). As we stated above, the allocation of seats in proportional systems is fundamentally determined by vote share, so votes count the same regardless of their geographical location. An increase in the geographical targeting of social policies may undermine the effectiveness of social spending to win votes across many districts in the country. However, as there is no premium for geographically clustered votes, concentration does not offset the comparative advantage of social spending relative to distributive policies as a strategy to compete for votes under PR rules. Accordingly, we expect elected officials’ incentives to provide social policies in proportional systems not to be significantly affected by the degree of concentration of social recipients.
Finally, we cannot make any prediction regarding whether the geography of recipients may offset the effect of electoral rules on public spending. The geographic concentration of social recipients may reduce differences in levels of social spending between electoral systems, but we cannot predict whether social spending in majoritarian systems will eventually offset levels of provision under PR. This means we cannot provide any hypothesis on whether D will be larger than C. This is ultimately an empirical question that we will address in our analysis.
VARIABLES, DATA AND METHODS
We operationalize our dependent variables as Social Expenditure and Social Security Transfers as a percentage of GDP in twenty-two OECD countries covering mostly the period 1990–2010.Footnote 31 These are the two conventional variables used in the literature to measure the level of social policy provision in a country. Social Expenditure captures all social spending, whereas Social Security Transfers measures entitlement programmes such as unemployment, sickness and disability benefits.
Our argument is that when the demand for these policies is concentrated in certain regions,Footnote 32 elected officials under majoritarian rules will have more incentives to increase social spending. To measure the concentration of social policy recipients across regions, we use levels of regional unemployment. Unemployment rates are the most straightforward measure of cross-regional differences in income, levels of social need or demand for social policies. Thus we operationalize the geographic concentration of social policy recipients by measuring the geographic concentration of unemployment rates.
To calculate the geographic concentration of recipients, we use three different measures. Our main measure is the Adjusted Geographic Concentration (AGC) index proposed by SpieziaFootnote 33 and developed from Ellison and Glaeser.Footnote 34 The OECD uses this index extensively.Footnote 35 The AGC index compares the unemployment size and geographic weight of all regions in a given country, and is constructed to account for both within- and between-country differences in the size of regions. It is scaled from 0 (no concentration) to 1 (maximum concentration), and is suitable for international comparisons of geographic concentration.Footnote 36
The second measure is the coefficient of variation in regional unemployment rates (Coefficient Variation). This results from dividing the regional standard deviation of unemployment rates with the average regional unemployment rate. Both rates were calculated weighting each region by its size (measured as the active population in the region). This measure also ranges from 0 to 1.
The third measure is the ratio between the unemployment rate in the 90th percentile region and the unemployment rate in the region in the 10th percentile region (perc90/10). The rationale of this measure is that the greater the difference between unemployment rates in high- and low-unemployment regions, the stronger the geographic concentration of unemployment, and thus the more unequal the demand for social policies across the country’s territory.
The regional data for these indices are taken from the OECD Regional Statistics. We use the Territorial Level 3 (TL3) units, which is the most disaggregated unit we can use.Footnote 37
These indices capture relevant differences in the levels of concentration of social policy recipients. Figure 1 displays the evolution of the AGC and the Coefficient of Variation for all countries in the sample.Footnote 38 Italy and Belgium are the most geographically unequal countries, while Australia and Netherlands have fewer regional differences. Although there is variation within countries, differences between countries are more prominent. Hence, our empirical strategy will mostly exploit between-country variation. A first descriptive glance at the data seems to support our main argument. For instance, in the second half of the 1990s, two of the majoritarian countries with the highest levels of geographic concentration were Italy and France, which were also among the majoritarian countries with higher levels of social expenditure. While the average social expenditure during this period in the rest of the majoritarian countries in the sample was 16.6 per cent of GDP, this figure rises to 29.7 per cent in France and 24.4 per cent in Italy. In addition, this seems to offset the differences between electoral systems. The provision of social expenditure, as measured by the OECD, in this period in Italy is above the average of the PR countries (23.6 per cent) and in France it was the highest in the sample, including all the PR systems.
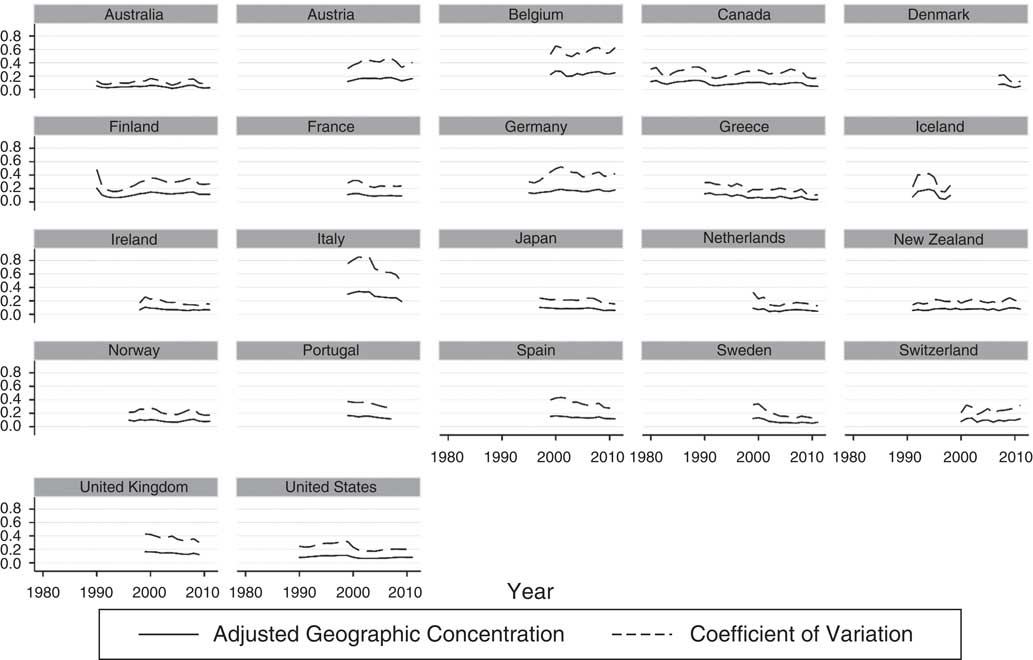
Fig. 1 Unemployment AGC and coefficient of variation
Our basic argument is that the geographic concentration of beneficiaries will moderate the effect of electoral rules on levels of social provision. To test this hypothesis we interact the concentration indexes with two different variables that operationalize electoral rules. The first is the Effective Electoral Threshold,Footnote 39 which measures the average share of votes that a party needs to win to secure parliamentary representation with a probability of at least 50 per cent. It ranges from 37.5 in single-member district systems to 0 in proportional systems with one single national district.Footnote 40 Secondly, we use a dummy variable, Majoritarian, which takes a value of 1 if the electoral system is a majoritarian system, and 0 otherwise.Footnote 41 We expect the interaction coefficient between the concentration indexes and electoral system variables to have a positive sign. In other words, the provision of social spending in majoritarian systems will be higher as the concentration of recipients increases.
The statistical models include several economic and political controls.Footnote 42 First, we include the Unemployment Rate, which captures a country’s general demand for social spending. The argument is that countries with higher levels of unemployment experience greater pressure to expand social spending. With a similar logic, models also control for GDP Growth. This is a very standard economic control that accounts for the effects of economic growth on the need for social policies. When a country is growing, pressures on social spending will be lower. We also include two economic controls of a country’s degree of exposure to globalization: Trade Openness and Financial Openness. The former is measured as the total trade (sum of imports and exports) as a percentage of GDP. The latter is operationalized using Chinn and Ito’sFootnote 43 Financial Openness Index, which measures openness in capital account transactions. Two competing hypotheses on the impact of globalization predict opposite effects on the dependent variable: the compensation hypothesis states that openness is associated with higher levels of government spending and social protection,Footnote 44 while the globalization hypothesis predicts that international competition forces countries to decrease social spending.Footnote 45 Models also control for the Interest Rate, which is a proxy of the costs associated with the expansion of social policy programmes through debt. This control follows Altig and Davis’s work,Footnote 46 which shows that financial restrictions constrain governments’ distributive calculations.
As political controls, we include a Left Government variable, measured as the percentage of the cabinet posts that belong to social democratic or left parties.Footnote 47 The common understanding in the literature is that ideology matters when explaining government spending.Footnote 48 With this control, we are essentially looking at the effect of electoral systems net of any partisan–government bias that each system may exhibit – PR systems might be more pro-left, and majoritarian systems more pro-right.Footnote 49 Voter Turnout in the previous election is also included in the models. Assuming that lower-income citizens are less prone to vote, parties will have greater incentives to enact redistributive policies when turnout is higher.Footnote 50
We test our hypothesis using data on twenty-two OECD countries. Panels are unbalanced due to cross-country variation in data availability and cover for most countries the early 1990s to 2010.Footnote 51 On average, each regression encompasses around fourteen observations per country. We estimate time-series panel-corrected standard error estimations.Footnote 52 As social spending has an increasing trend over time, all models include a panel-specific autoregressive error term. To account for the robustness of these estimations, we run further empirical checks below.
RESULTS
In this section we test our main hypothesis using the two dependent variables: Social Expenditure (Table 2) and Social Security Transfers (Table 3). Before examining the main results, the sign and significance of the control variables deserve some discussion. The results show that, as expected, the unemployment rate has a positive impact on social spending, while GDP Growth decreases the need for social policies since it has a negative impact on general levels of social expenditure, and unemployment benefits in particular. Furthermore, Trade Openness displays a positive and significant coefficient just in Table 2, whereas the Financial Openness Index exhibits significant signs across both tables. In addition, we also find a consistent and expected negative effect of Interest Rate.
Table 2 Recipients’ Geographic Concentration, Electoral System and Social Expenditure
Note: time-series-cross sectional estimations with panel-corrected standard errors in parentheses. All models contain a panel-specific AR(1) term. Constant not shown. ***p<0.01, **p<0.05, *p<0.1.
Table 3 Recipients’ Geographic Concentration, Electoral System and Social Security Transfers
Note: time-series-cross sectional estimations with panel-corrected standard errors in parentheses. All models contain a panel-specific AR(1) term. Constant not shown.
***p<0.01, **p<0.05, *p<0.1.
As for the political variables, we do not find partisan effects on levels of social policies. This finding is in line with research claiming that the direct impact of a government’s ideology on spending policies is unclear, and that its effect will be contingent on other contextual variables, both institutional and economic. This is noted in Pontusson, Rueda and WayFootnote 53 and Kwon and Pontusson,Footnote 54 among others.Footnote 55 In addition, we find evidence that a higher electoral Turnout increases social expenditure, but only for general social spending. Pontusson and RuedaFootnote 56 provide empirical evidence that when voter turnout is high, only left parties have more incentives to provide redistributive policies. This could explain why we do not find a positive effect of Turnout on social security transfers, as the effect might be contingent on the ideology of the ruling party.
The most important independent variables of the empirical analyses are the interactions between the three geographic concentration indexes and the two electoral system variables. First, Tables 2 and 3 show that in all model specifications, majoritarian electoral rules, either measured as Effective Electoral Threshold or as a Majoritarian dummy variable, exhibit a negative effect on social expenditure and social security transfers when the concentration of recipients is zero. This finding supports our first prediction (A>B): proportional electoral systems provide higher levels of social benefits than less proportional systems, conditional on geographic concentration being zero.
Secondly, the results show that the provision of social policies in majoritarian systems increases as the territorial clustering of unemployment grows. This is indicated by the positive and highly significant interaction terms between electoral rules and concentration indices across the twelve model specifications of Tables 2 and 3, which supports the main hypothesis of this article (D>B in Table 1). This effect is very robust as it is displayed on both dependent variables – Social Expenditure and Social Security Transfers – regardless of which concentration or electoral system variables are used in the model.
We also find a less robust negative effect of geographic concentration in PR systems, as indicated by the concentration variable principal component. In half of the models, the concentration variable has a significant negative impact by itself on social spending, which means that for non-majoritarian electoral systems (those with value 0 in the electoral system variables), geographic concentration of beneficiaries reduces social spending. The finding, though, is of low magnitude and not very robust (as it even exhibits a positive coefficient in Models 3.4 and 3.5). In the theoretical section, our expectation was that PR rules would be neutral in relation to the concentration of social policy beneficiaries. However, some of our results seem to suggest that the concentration of social policy demand has a negative effect on social spending as proportionality increases. This negative effect of the concentration of interests in PR settings is in line with Rickard’sFootnote 57 and Jusko’sFootnote 58 findings, and suggests that PR systems are relatively more generous in terms of social spending when social beneficiaries are dispersed than when they are geographically concentrated.
Together, these findings suggest that the effect of electoral rules on the provision of a social policy is contingent on the distribution of its recipients. Governments in proportional electoral systems provide more social policies when the beneficiaries are dispersed all over the country. However, as the geographic concentration of beneficiaries augments, governments in majoritarian electoral systems increase the provision of social policies compared to PR systems.
As the tables only exhibit conditional parameters and significance must be assessed for all values of independent variables, we follow Brambor, Clark and Golder’sFootnote 59 guidelines, and supply graphical results that allow us to better observe the sign and magnitude of the effects.
Figure 2 plots the marginal effect of unemployment’s geographic concentration across different electoral systems (interaction coefficient of Model 2.1). We can observe that the marginal effect varies, as the electoral system is more majoritarian. For effective electoral thresholds over 17, a greater concentration of unemployment has a positive effect on social spending, and the effect becomes stronger as the concentration continues to increase. The left-hand side of Figure 2 shows a negative effect of geographic concentration in PR systems when proportionality is perfect. As mentioned above, however, this effect is less robust and is not significant in all models.
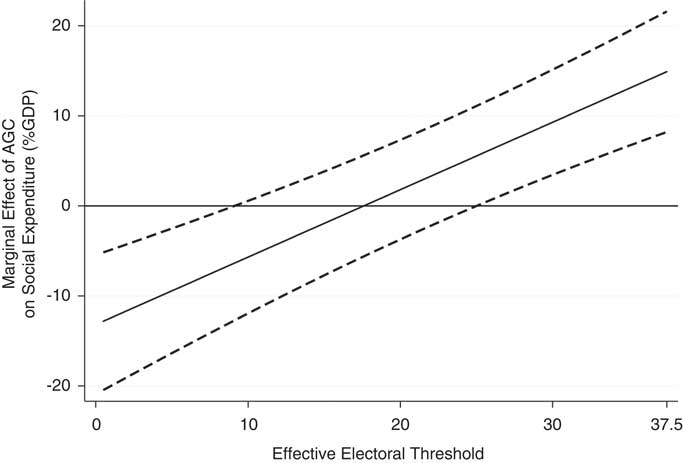
Fig. 2 Marginal effect of geographic concentration of unemployment on social spending conditional on the electoral system Note: dashed lines indicate 95% confidence interval.
The figure accounts for the marginal effect of geographic concentration of unemployment under different electoral systems. This moderating impact of concentration would reduce the differences between electoral systems, or even overturn the prediction that proportional systems will provide higher aggregate levels of social policies. To better represent the moderating effect of concentration across electoral systems, Figure 3 simulates the impact of a majoritarian and a PR system on social spending under different concentration settings. For this simulation, we use Model 2.4, which is a more conservative estimation, and compare the predicted social expenditure in a country where the Majoritarian variable has a value of 1 with a country where it has a value of 0. In a context with low concentration, social expenditure in PR systems is just above 24 per cent of GDP. This is, as expected, a higher level of social policies than a country with a majoritarian electoral system, where provision would be around 18 per cent of GDP. However, as recipients’ concentration increases, there is also an increase in the provision of social policies in majoritarian countries, while social policy provision in PR systems remains virtually the same in this simulation. Consequently, in a country with a high geographic concentration of unemployment (AGC=0.35), the provision of social policies rises substantially under majoritarian electoral institutions and social policy provision ends up being similar in majoritarian and PR systems (around 24 per cent of GDP). As said, Model 2.4 is more conservative; simulating other models, we find that majoritarian electoral systems provide around 1 per cent more of the GDP in social spending than PR systems with high geographic concentrations of unemployment.
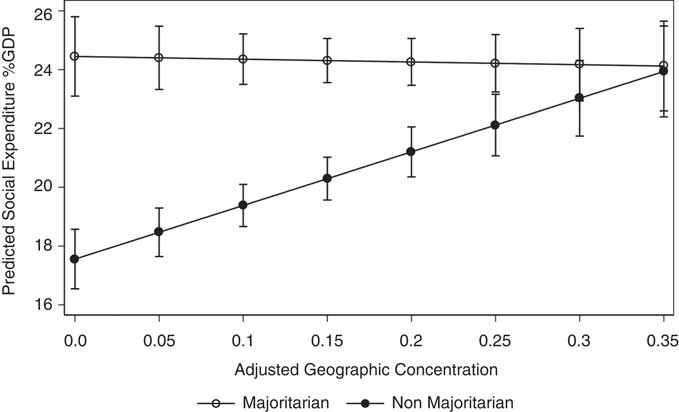
Fig. 3 Effect of the electoral system on social expenditure at different levels of unemployment geographic concentration (95% confidence interval)
These predicted values illustrate that recipients’ territorial concentration substantially changes the impact of majoritarian electoral systems on social spending. The empirical analysis suggests that geographic clustering can bring the effect of majoritarian rules on social spending to be similar to those of PR systems. Although the established expectation in the literature is that the provision of social policies will be higher in proportional electoral systems, this will most significantly happen when geographic clustering is low. If beneficiaries cluster in certain territories, the incentives to provide social policies in majoritarian electoral systems are stronger, and for high levels of concentration, they can potentially overturn the differences between electoral systems in levels of social spending.
In Table 4, we further explore the relationship between electoral rules and geographic concentration on social policies, providing a more nuanced account of the type of social spending. We replicate previous models using AGC as our main concentration variable and the two electoral system variables on different versions of the dependent variable: one measures social expenditure in cash and the other measures social expenditure in kind.Footnote 60 Our theoretical argument is that, when demand for social policies is concentrated in specific regions of countries with majoritarian electoral systems, pro-social coalitions will be formed from districts where recipients of social policies are pivotal. In these circumstances, an increase in social policies is a more efficient strategy to win elections than targeting district by district with pork-barrel spending. Hence, the interaction between the concentration of beneficiaries and electoral rules should have an effect on levels of provision of in-cash benefits, but should not affect the levels of in-kind social expenditure.
Table 4 Robustness Checks on the Dependent Variables
Note: time-series-cross sectional estimations with panel-corrected standard errors in parentheses. All models contain a panel-specific AR(1) term. Constant not shown. ***p<0.01, **p<0.05, *p<0.1.
The empirical models confirm this. The interaction effect that we detected in previous tables is due to in-cash policies. While the interactions are strongly significant to explaining social expenditure in cash in Models 4.1 and 4.2, the significance vanishes when the dependent variable is social policies in kind (Models 4.3 and 4.4).
A second issue is whether our results can be explained by simply an increase in the provision of unemployment benefits as a response to unemployment concentration, or whether the variation in social expenditure is explained by a wider range of social policies. In Models 4.5 to 4.8 we break in-cash social spending into two categories: Unemployment Spending (formed by unemployment benefits and active labour market policies) and Other Social Expenditure. As discussed above, we use unemployment concentration as a proxy for the concentration of social policy beneficiaries, and as an indication of the level of concentration of demand for general social policies. The results of Models 4.5 through 4.8 show that our variable of concentration does not simply capture demand for unemployment benefits. Although the interaction between the concentration of beneficiaries and electoral system has a positive and significant effect on the provision of unemployment policies, the effect is stronger when we use in-cash social expenditure as a dependent variable (Models 4.7 and 4.8). This means that our concentration variables are useful for capturing not only the concentration of the unemployed, but more generally the concentration of demand for social spending.
ROBUSTNESS CHECKS
Empirical findings in the previous section are quite straightforward. The geographic concentration of social policy beneficiaries increases the provision of social spending in majoritarian electoral systems. This conditional effect significantly reduces the differences between electoral systems in levels of social provision.
In this section, we check the robustness of the results in several ways. First, we use a different measure of the concentration of recipients. In Table 5 we replicate the analysis using Selway’sFootnote 61 measure of cross-cuttingness between income and geography (Income–Geography Overlap). This measure was developed using survey data, and it captures the extent to which income cleavage overlaps with geography in each country. Since income can be a good proxy for demand for social spending, we consider Selway’s measure to be a good alternative operationalization of the geographic concentration of social policy demand. When the cross-cutting index scores low, it means that individuals with low and high incomes tend to live in different regions, whereas it scores high if incomes are distributed in a similar way across the territory, meaning that cleavages cross-cut each other. In contrast to the previous analyses, lower values of the cross-cuttingness measure imply higher levels of concentration.
Table 5 Robustness Checks on the Concentration Variable (IGO)

Note: time-series-cross sectional estimations with panel-corrected standard errors in parentheses. All models contain a panel-specific AR(1) term. Constant not shown. ***p<0.01, **p<0.05, *p<0.1.
Table 5 displays the results of the econometric model using Selway’s index to operationalize the concentration of recipients. The results are robust to the use of a time-invariant measure such as Income–Geography Overlap (IGO). The interaction between this variable and type of electoral system is significant across all model specifications. This implies that when income and geography correlate (in other words, when income is concentrated in certain regions), majoritarian electoral systems increase the provision of social policies compared to PR systems. These results are similar to those reported in the previous section with our time-varying concentration variables. Interestingly, the empirical test now exhibits a more consistent effect with respect to the relationship between geographic concentration and social spending in PR countries suggested in some of the previous models: the greater the overlap between income and region, the lower the levels of social provision under PR rules. Altogether these results confirm those in the previous sections and highlight the importance of the geography of income in mediating the effect of electoral rules on social spending.
In Table 6 we run further empirical checks to test whether the results are robust to different model specifications. We carry out the empirical analyses using Social Expenditure as the dependent variable and the AGC index as the concentration variable, but the results are quite similar using the social security transfers or the in-cash social expenditure as the dependent variable, as well as other concentration indexes as the independent variable.
Table 6 Robustness Checks on Model Specification

Note: constant and controls not shown. Standard errors in parentheses; ***p<0.01, **p<0.05, *p<0.1.
We first check that the empirical findings are not driven by one or two individual cases in Models 6.1–6.4. In Models, 6.1 and 6.2 we replicate the analyses of Table 2 using jack-knife tests. In Models 6.3 and 6.4 we perform the same analyses dropping all the Italian observations, as Italy tends to have the highest values for the concentration variables. The interaction between AGC and the two electoral system variables keeps its significance across all these models (except Model 6.2, where the interaction is borderly insignificant at p<0.119).Footnote 62
We also want to rule out the possibility that the electoral system is endogenous to the concentration of social policy recipients. The argument would be that countries with a higher concentration of social policy recipients – and, in turn, a greater fragmentation of interests – are more likely to have a majoritarian electoral system.Footnote 63 This possibility is partially ruled out by the correlation between the AGC and the effective electoral threshold (−0.095): it is very low and has the opposite sign than would be expected if there were an endogeneity problem. In any case, we follow RickardFootnote 64 and run a two-stage least squares model (2SLS), using the year in which the current electoral system was set as an instrument.Footnote 65 There is plenty of evidence that the age of the electoral system correlates with the type of electoral system, as countries with older electoral laws tend to have more majoritarian electoral rules. This is a useful instrument because the type of electoral system will be explained by the year of its adoption, while it is unlikely that this year is related to the level of geographic concentration of social policy recipients today. Models 6.5 and 6.6 display the results of the 2SLS models. The interactions are significant and the magnitude of the coefficients is quite similar, which confirms the robustness of the empirical findings.
We also run dynamic panel data models with a GMM estimator and a lagged dependent variable, both with the dependent variable specified as level or as a first difference.Footnote 66 Models 6.7 to 6.10 display the results. Although the lagged dependent variable subtracts, as expected, part of the magnitude of the effects,Footnote 67 the interactions remain significant in the four specifications.
Finally, we replicate the empirical analyses with fixed effects. We have previously shown that most of the variation in our concentration variables is between, rather than within, countries. Still, Models 6.11 and 6.12 include these analyses for the sake of robustness. Our electoral system variables display temporal trends with no variation for almost all countries, which could potentially lead to unreliable point estimates and biased estimators if fixed effects are used. Therefore, we use Plümper and Troeger’sFootnote 68 fixed effects vector decomposition method to separate the country fixed effects from the effect of the electoral system. Models 6.11 and 6.12 demonstrate that the introduction of fixed effects does not modify the sign of the effect of the social expenditure model. In addition, the interactions are significant for both models. This implies that although our theoretical argument is mostly explaining between-country variation, it can also be applied to account for within-country variation.Footnote 69
CONCLUDING REMARKS AND FURTHER RESEARCH
The literature that explores the relationship between social policies and electoral institutions has largely overlooked the role of social recipients’ geographic concentration in explaining levels of welfare provision. In this article we purport to fill this literature gap by analysing how the geographic distribution of social recipients moderates the impact of electoral rules on social spending. The article provides robust empirical findings showing that the territorial distribution of social beneficiaries is important in accounting for variation in levels of social provision across OECD countries. We have found that in majoritarian electoral systems, the higher the concentration of social recipients, the higher the provision of social policies. When demand for social policies clusters in certain regions, elected officials under majoritarian rules increase the provision of social spending. For high levels of concentration, social provision social provision in majoritarian systems may be equal to -or even higher than- levels in PR systems. Which contradicts the standard predictions in the literature.
Our findings raise additional theoretical and empirical questions that could be addressed in future research studies. First, the article convincingly shows that the unemployment rate can be interpreted as a general measure of social need, but there may be other measures – in particular concentrations of the elderly, who have a strong impact on social transfer spending (through pensions and health care). Being a populous group, we may expect them to become ‘pivotal’ voters and significantly affect policy makers’ behaviour. An empirical question is whether our hypothesis holds when we analyse the geographical concentration of those approaching old age.
Secondly, although we presumed that the geographic concentration of interests would not affect social provision under proportional rules, some of the analyses conducted showed a significant and negative impact of concentration of recipients on social spending in PR countries. This empirical result is in line with previous studies on industrial policies such as Rickard,Footnote 70 and suggests that a better understanding of the joint impact of electoral rules and the geography of recipients on social spending in PR systems is needed. For instance, a potential avenue for research could consist of exploring whether the existence of powerful regional leaders weakens the impact of concentration of levels of social provision. Regional entrepreneurs in decentralized contexts may successfully resist any attempt by national officials to reduce social spending. In this context we may expect levels of social provision to be less dependent on changes in the geographic concentration of social recipients. More generally, decentralized institutions may also help to provide a better account of distributive spending across PR systems. Powerful regional actors in proportional systems may succeed in targeting public goods towards their jurisdictions, so we may expect higher levels of targeted spending in proportional decentralized systems than in unitary ones.
A third important question that deserves further study is the degree of elasticity of social spending to geography. If we assume that citizens reward increases in public spending and penalize reductions in social provision, then variation in the level of concentration of recipients will have a relatively larger effect on increasing social spending than reducing universalistic expenditures. Put differently, the marginal increase in social spending that may result from higher levels of concentration will be relatively larger than the marginal reduction in social provision associated with a more dispersed distribution of recipients across territories. This may result in a path-dependent spending pattern whereby high levels of past social spending reduce the effect of geography on future social provision. An empirical analysis along these theoretical lines would require longer time-series data to allow a detailed tracking of within-country variation over time.
Further development of the article’s theoretical insights would also require a better account of the individual-level mechanisms that underlie the hypotheses. One of the key assumptions in possible implications of the analysis is that a higher concentration of social recipients increases demand for social spending. However, survey-based empirical evidence is needed that shows whether regional context shapes individuals’ political preferences regarding social provision,Footnote 71 and whether changes in preferences in turn affect their vote decision.Footnote 72 Our results suggest that electoral concerns are important for public officials when deciding about levels of social provision. Yet further analyses should explore whether politicians’ strategies align with citizens’ preferences and voting patterns.
Finally, future research in the area should pay closer attention to the self-reinforcing dynamics of social spending. The geographical concentration of beneficiaries may promote party development by bonding the interests of the represented (social recipients) and their representatives. Stronger organizational capacities may in turn strengthen the bargaining power of the pro-social coalition within and across political parties. Also, if the concentration of social beneficiaries is associated with increasing electoral payoffs, politicians may have incentives to uphold (and even exacerbate) regional concentrations of beneficiaries in certain areas. Further exploration of these dynamics will help provide a more nuanced account of the argument and its robustness to potential endogenous relationships.


