


Neuronal cell damage or death (apoptosis) is a key feature in the pathology of neurodegenerative disorders, such as ischaemic stroke, Alzheimer's disease (AD) and Parkinson's disease(Reference Mattson and Duan1). Therefore, neuronal cell survival is pivotal in preventing such neurodegenerative disorders. Importantly, identification and characterisation of the critical modulators of neuronal cell survival are of paramount significance to elucidate the mechanisms underlying neurological diseases and thus facilitate the development of novel treatment strategies. Another common feature seen in AD brains is lesions of extracellular amyloid plaques, which consist of protein aggregates of β-amyloid(Reference Marotta, Majocha and Tate2, Reference Cole, Williams and Alldryck3). Significantly, free neuronal Zn has been shown to promote aggregation of the β-amyloid(Reference Capasso, Jeng and Malavolta4), and increased levels of Zn are reportedly colocalised in the brain of AD patients(Reference Miller, Wang and Telivala5).
Epidemiological studies have shown that people who ingest higher levels of n-3 fatty acids, such as DHA, are less likely to develop neurodegenerative diseases like AD(Reference Tully, Roche and Doyle6). Similarly, low blood levels of n-3 fatty acids have been linked to neuropsychiatric conditions such as depression(Reference Laugharne, Mellor and Peet7) and AD(Reference Conquer, Tierney and Zecevic8). Fish are an excellent source of dietary DHA, yet regular consumption of fish is often uncommon in the typical Western diet (Australian Fisheries Management Authority). Improved mental development has been observed in human subjects with adequate dietary supply of DHA during infancy(Reference Agostoni, Trojan and Bellu9). Another link between DHA and AD is revealed by the finding that AD patients have a reduced amount of DHA in phospholipids in the hippocampal area(Reference Corrigan, Horrobin and Skinner10). Additionally, provision of DHA has been linked to lower amyloid plaque production in AD brains. In one such example, amyloid precursor protein transgenic mice on DHA-supplemented diets displayed a decreased amount of β-amyloid production compared with mice on control diets(Reference Oksman, Iivonen and Hogyes11), suggesting a role of DHA in inhibiting plaque formation. This theory is supported by an assay performed on cortical extracts of mice placed on low and high DHA-containing diets, revealing a significant reduction of β-amyloid levels in the brains of mice fed on the DHA-enriched diets compared with brains of mice fed on the DHA-deficient diet(Reference Lim, Calon and Morihara12).
An association between DHA levels in the brain and Zn homeostasis has been found, which is particularly interesting due to the neuroprotective roles of Zn and n-3 fatty acids. Studies on Zn-deficient pregnant rats have showed a decrease in PUFA synthesis and impaired transport of PUFA to foetuses(Reference Yang and Cunnane13), leading to whole-body depletion of maternal stores of n-6 and n-3 PUFA(Reference Cunnane, Yang and Chen14).
We have previously demonstrated that a dietary-induced reduction of brain DHA in rats can cause overexpression of ZnT3, a transmembrane protein involved in transport of Zn into synaptic vesicles(Reference Jayasooriya, Ackland and Mathai15). Although Zn is an important nutrient as an essential catalytic and/or structural cofactor in many Zn-dependent enzymes, in high concentrations, Zn is toxic and causes neuronal cell damage, which is seen in brain ischaemia, trauma and epilepsy(Reference Capasso, Jeng and Malavolta4). Moreover, Zn induces formation of amyloid plaques and brain cell death, which are significant features of aging-related neurodegenerative processes like AD(Reference Cuajungco and Lees16). Since high levels of synaptic Zn are commonly seen in AD brains, these results suggest a likely synergy between Zn and DHA in AD pathophysiology. Using proteomic analysis, we aimed to identify novel human neuronal proteins that are affected by both Zn and DHA. Here, we report for the first time that Zn and DHA affect the expression levels of histones H3 and H4 in the human neuronal cell line M17. This novel discovery that changes in Zn and DHA have a major effect on histone gene expression levels will contribute to understanding the molecular biology of AD and the development of intervention strategies.
Methods
Cell culture
The human neuroblastoma cell line M17 was grown at 37°C in a humidified atmosphere in the presence of 5·0 % CO2, as monolayer cultures in 75 cm2 disposable plastic flasks (Nunc™, Roskilde, Denmark), maintained in 10 ml Opti-MEM media (a modified minimum essential medium (Eagle's) media) with heat inactivated 2·5 % foetal bovine serum supplementation. At approximately 90 % confluence, M17 cells were harvested or passaged using 0·025 % trypsin/EDTA or 0·05 % trypsin/EDTA, respectively.
M17 cells were seeded at a density of 1 × 10⁶ cells/75 cm2 flask and grown in media supplemented with DHA (DHA, Sigma Aldrich, St Louis, MO, USA; 10 μg/ml final concentration; pre-incubated overnight at 37°C to allow the DHA to conjugate with media proteins to allow delivery into cells) or without DHA and with (5 μm final concentration) or without ZnCl2. After 2 d of incubation, the cells were harvested, centrifuged at 1000 g for 5 min and pellet resuspended in PBS. Each sample was then divided into aliquots, centrifuged at 14 000 g for 5 min and cell pellets stored at − 80°C until needed for analysis.
Two-dimensional PAGE
Cell pellets were resuspended in ZOOM protein solubilizer 1 lysis buffer (Invitrogen, Carlsbad, CA, USA), disrupted by passing through a twenty-one-gauge needle and sonicated by using a Microson Ultrasonic cell disrupter (Misonix Incorporated, Farmingdale, NY, USA), following the manufacturer's instructions. Samples were then centrifuged at 14 000 g for 20 min at 4°C and stored in small aliquots at − 80°C until needed for analysis.
Quantification of the protein concentration in cell lysates was performed using Quant-IT™ Protein Assay Kit (Invitrogen) and Qubit™ Fluorometer, following the manufacturer's instructions.
First (isoelectric focusing) dimension of reduced and alkylated cell lysates was resolved on pH 3–12 ZOOM IPG strips (Invitrogen) followed by the second dimension on precast 4–20 % Tris–glycine ZOOM gels (Invitrogen) following the manufacturer's instructions.
Gels were stained with SYPRO Ruby protein gel stain (Invitrogen) according to the manufacturer's instructions and detected using Fujifilm LAS-300 UV transilluminator (Fujifilm, Melbourne, Vic, Australia) to visualise protein spots.
MS analysis
Individual gel plugs containing the protein samples of interest were excised from each gel by automated robotic cutter and placed into sequential wells in a ninety-six-well format plate and subjected to two rounds of destaining with 25 mm-ammonium bicarbonate and dehydration with 50 % acetonitrile. The gel plugs were then fully dehydrated at 37°C before digestion with porcine trypsin for l6 h at 37°C. Digestion products were released from the gel plugs by sonication and acidified using 1 % trifluoroacetic acid. The peptides were then purified using a C18 zip tip according to the manufacturer's instructions (Varian, Palo Alto, CA, USA) and eluted on to the Applied Biosystems, Inc. (ABI) MS target in α-cyano-4-hydroxycinnamic acid matrix. The target was then analysed immediately by matrix-assisted laser desorption ionisation-time of flight/time of flight MS using the ABI 4700 Proteomics Analyser (ABI, CA, USA) immediately. Samples were initially analysed in single MS mode to determine the peptide mass fingerprint of the sample. The ten most intense peptide peaks were then isolated, fragmented and analysed in tandem MS/MS mode to determine de novo amino acid sequence of the peptides selected. A combined protein score for the peptide mass fingerprint and ten most intense peptides were obtained using the Mascot bioinformatic search engine (Department of Primary Industries, Melbourne, Vic, Australia) to search the non-redundant National Center for Biotechnology Information, Homo sapiens database, mass tolerance 100 ppm and oxidation as a variable modification. Proteins were identified via their peptide mass fingerprint and deduced amino acid sequence determined by single MS and tandem MS/MS, respectively. Protein identity was only reported for samples that gave a significant (P < 0·05) molecular weight search score.
One-dimensional electrophoresis and Western immunoblot analysis
Cell lysates (described above) were resolved on 15 % SDS-PAGE gels following our established techniques(Reference de Leon, Glaspole and Drew17).
For Western analysis, the SDS-PAGE gels were transferred onto a nitrocellulose membrane (Pall Life Science, Pensacola, FL, USA) and blocked with 1 % (w/v) non-fat skim milk in TBS, following our standard methods(Reference de Leon, Glaspole and Drew17). Membranes were incubated with 1/1000 dilution of monoclonal mouse anti-human H3 and H4 (Abchem, Sydney, NSW, Australia) antibodies and antibody binding detected with anti-mouse (Chemicon International, Temecula, CA, USA) horseradish peroxidase secondary antibody (diluted 1/4000) following our standard techniques(Reference de Leon, Glaspole and Drew17). Antibody binding proteins were visualised using Immobilan Western chemiluminescent horseradish peroxidase substrate (Millipore Corporation, Temecula, CA, USA) according to the manufacturer's instructions.
Developed membranes were stripped for 15 min at room temperature using 1 ml Re-blot Plus-strong (Chemicon International) diluted in 1:10 in Milli-Q water. In order to ensure equal protein loading, the membranes were reprobed for β-actin using mouse anti-β-actin (Sigma Aldrich) primary antibody (1/5000 dilution) followed by anti-mouse horseradish peroxidase antibody (Chemicon International) and developed as described above.
Real-time PCR analysis
Total RNA was isolated from cell pellets using RNeasy Mini-kit (Qiagen, Doncaster, Vic, Australia) according to the manufacturer's instructions, along with DNA-free treatment (Ambion, Austin, TX, USA) to remove genomic DNA. The RNA concentration and purity were spectrophotometrically measured on Nanodrop ND-1000 (NanoDrop Technologies, Wilmington, DE, USA). First strand of cDNA was synthesised from 1 μg total RNA template by using High-Capacity cDNA Reverse-Transcription kit (ABI), and quantitative real-time PCR was performed, in triplicate, on 7500 Real-Time PCR System (ABI), using 1 × SYBR Green PCR Master Mix (ABI) and specific primers to human histone H3 (forward: 5′-AATCGACCGGTGGTAAAGCA-3′; reverse: 5′-TTGCGAGCGGCTTTTGTA-3′) and H4 (forward: 5′-TTATGAGGAAACTCGCGGAGTG-3′; reverse: 5′-TGGCTGTGACTGTCTTGCGTT-3′), following the manufacturer's instructions. Glyceraldehyde-3-phosphate dehydrogenase was used as the endogenous control. Expression levels for each sample were calculated using Δ cross-over threshold (Ct) method where the data were normalised by determining the difference in Ct values between H3 or H4 genes and glyceraldehyde-3-phosphate dehydrogenase. The fold change was calculated as 2− ΔΔCt, where the ΔΔCt is the difference between the treated ΔCt and control ΔCt. Significance (P < 0·05) was tested by the Student's t-test.
Results
Proteomic analysis of human neuronal cells with and without zinc and DHA
In the present study, we cultured human neuronal M17 cells in the presence and absence of Zn and DHA to identify novel proteins that are either up- or downregulated in response to Zn and DHA.
We subjected total protein lysates of M17 cells to two-dimensional (2D) gel electrophoresis and stained with SYPRO Ruby fluorescent stain to visualise differentially expressed protein spots. We first looked at the effect of Zn on M17 proteins in absence of DHA (Fig. 1). Many protein spots were significantly increased following treatment of the M17 cells with 5 μm Zn (Fig. 1(b)). We observed there were two basic spots at about 11 and 15 kDa, which showed a significant reduction in protein amounts (S1 and S2 in Fig. 1(a)) and these were chosen for MS analysis.
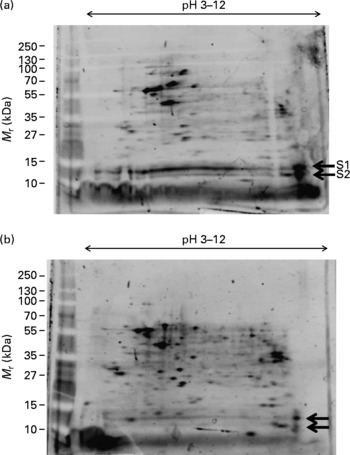
Fig. 1 Effect of zinc on protein expression in M17 human neuronal cells. Proteome expression of M17 cells grown in the absence of DHA and without zinc (a) or with zinc (final concentration of 5 μm) (b). Five microlitres of molecular mass markers (M r) were run concurrently and gels stained with SYPRO Ruby staining. Protein spots of significant difference ( ← ) were subjected to MS analysis (S1, S2).
The effect of DHA on M17 cells in the presence of Zn was also investigated by 2D analysis (Fig. 2). We observed a significant reduction in the number and level of protein spots with 10 μg/ml DHA treatment; however, the protein levels of two spots were significantly increased with the DHA treatment (S3 and S4 in Fig. 2(b)). These two spots occupied similar isoelectric point and molecular mass as those seen in Zn-deficient cells (S1 and S2 in Fig. 1(a)). These spots were therefore selected for MS analysis.
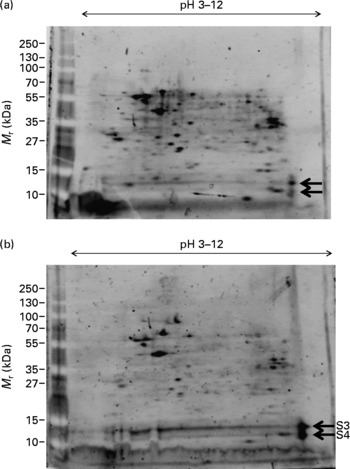
Fig. 2 Effect of DHA on protein expression in M17 human neuronal cells. Proteome expression of M17 cells grown in the presence of zinc (final concentration of 5 μm) and no DHA (a) or with 10 μg/ml DHA (b). Five microlitres of molecular mass markers (M r) were run concurrently and gels stained with SYPRO Ruby staining. Protein spots of significant difference ( ← ) were subjected to MS analysis (S3, S4).
When we compared additional treatments of ‘ − Zn+DHA’ with ‘+Zn − DHA’ and − Zn+DHA with ‘+Zn+DHA’, no significant difference on H3 and H4 levels was observed (data not shown). As Zn and DHA have opposing effects on H3 and H4 levels, treatments of − Zn+DHA and +Zn − DHA may cancel each other out and therefore show no significant difference. Moreover, comparing − Zn+DHA with +Zn+DHA did not show significant difference also, suggesting that Zn does not affect upregulation caused by DHA.
The protein spots S1–S4 (Figs. 1 and 2, respectively) were precisely excised by an automated robotic cutter, in-gel digested by trypsin and the peptide fingerprints subjected to MS analysis. Upon Homo sapiens National Center for Biotechnology Information database searches, the identities of the spots were revealed with a score of 100 % match (Table 1). Both S1 and S3 spots were identified as human histone H3 (isoelectric point 11·1, 15·3 kDa), while spots S2 and S4 were identified as human histone H4 (isoelectric point 11·4, 11·4 kDa) matching perfectly with the isoelectric point and molecular mass observed in the 2D gels (Figs. 1 and 2, Table 1).
Table 1 MS protein identity summary table*

pI, Isoelectric point; M r, molecular mass.
* Protein spots S1–S4 were excised from each gel by automated robotic cutter and subjected to trypsin digest followed by MS analysis and submission of peptide fingerprints to Homo sapiens National Center for Biotechnology Information database searches. Proteins were identified via their peptide mass fingerprint and deduced amino acid sequence determined by single MS and tandem MS/MS, respectively. Protein identity was only reported for samples that gave a significant (P < 0·05) molecular weight search score.
To validate our proteomic findings, we investigated human histone H3 and H4 proteins and mRNA levels using Western and real-time PCR analyses, respectively.
Western blot analysis of human histones H3 and H4
Using monoclonal antibodies specific to human histone H3 and H4, we subjected the same M17 total protein cell lysates as used in 2D analysis to Western blot analysis. In the absence of DHA, both histones H3 and H4 were downregulated upon Zn treatment (Zn effect; Figs. 3(a) and 4(a), correlating with the 2D results (Fig. 1). In the presence of Zn and DHA (DHA effect), both histones H3 and H4 were upregulated (Figs. 3(a) and 4(b)), again correlating with the 2D results (Fig. 2). To ensure that the observed changes in protein levels were not attributed to unequal protein loading of the wells of the gels, we probed the same blots with β-actin housekeeping protein, and this showed that there were equal protein-banding intensities (Figs. 3(b) and 4(b)). Furthermore, densitometric analysis of the protein bands in relation to β-actin indicated significant difference in expression levels (Figs. 3(c) and 4(c)).
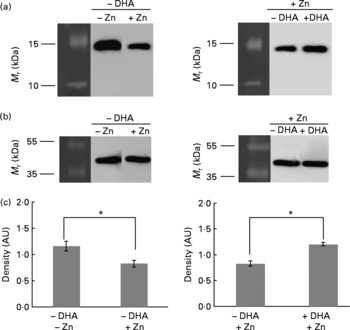
Fig. 3 Western blot analysis of H3 (a) and β-actin (b) expression in M17 cells grown in media supplemented with (+) or without ( − ) zinc (final concentration of 5 μm) and with (+) or without ( − ) 10 μg/ml DHA. (c) Densitometric analysis in arbitrary units (AU) are shown as means with their standard errors (n 3), *P < 0·05. Molecular mass protein markers (M r) are indicated on the left of each gel.

Fig. 4 Western blot analysis of H4 (a) and β-actin (b) expression in M17 cells grown in media supplemented with (+) or without ( − ) zinc (final concentration of 5 μm) and with (+) or without ( − ) 10 μg/ml DHA. (c) Densitometric analysis in arbitrary units (AU) are shown as means with their standard errors (n 3), *P < 0·05. Molecular mass protein markers (M r) are indicated on the left of each gel.
Real-time PCR analysis of human histones H3 and H4
In order to investigate whether changes in protein levels of histones H3 and H4 correlated with mRNA levels in M17 cells treated with and without Zn and DHA, we performed real-time PCR analysis. In the absence of DHA, both histones H3 and H4 showed significant downregulation of mRNA levels in response to Zn treatment ( − 1·8- and − 1·5-fold difference between treatment and control, respectively; Fig. 5). In the presence of Zn, both histones H3 and H4 demonstrated significant upregulation of mRNA levels in response to DHA (0·8- and 1·2-fold difference between treatment and control, respectively; Fig. 5). Taken together, the changes observed in mRNA levels of histones H3 and H4, with Zn and with and without DHA (Fig. 5), correlated well with the changes observed in protein levels (Figs. 1–4).
Fig. 5 Real-time PCR analysis of H3 (a) and H4 (b) expression in M17 cells treated with zinc-deficient ( − ) and zinc (final concentration of 5 μm)-supplemented (+) media containing no ( − ) or 10 μg/ml DHA (+). Negative values (less than zero) refer to downregulation/reduction and positive values (more than zero) refer to upregulation/increase in fold difference of histone H3 and H4 mRNA between the treatments. Fold difference is the difference in mRNA levels between – and + zinc (zinc effect) and – and + DHA (DHA effect). Data are shown as means with their standard errors (n 3), *P < 0·05, compared to control ( − DHA/ − zinc or − DHA/+zinc).
Sequence analysis
Having demonstrated the effects of Zn and DHA on H3 and H4 proteins and mRNA levels in M17 human neuronal cells, we next analysed the sequences of these histones to reveal molecular details that would help us to understand the connection between the histones H3/H4, Zn and DHA.
Comparison of nucleic and amino acid sequences between human H3 and H4 shows minimal sequence identities. H3 and H4 have only 44·8 % nucleic acid identity and only 20·6 % amino acid identity (Table 2). It is interesting to note that there is 100 % amino acid identity between human and mouse H3 and H4, such that similar effects of Zn and DHA on histones could be predicted in the mouse.
Table 2 Nucleic (NA) and amino acid (AA) identity and similarity between human histones H3 and H4*

* NA and AA sequences were analysed by The European Molecular Biology Open Software Suite pairwise alignment algorithms on the European Molecular Biology Laboratory –The European Bioinformatics Institute database (http://www.ebi.ac.uk/Tools/emboss/align/).
† AA identity (and similarity) between human histones H3 and H4.
Since Zn had an effect on the expression levels of histones H3 and H4, we searched 4000 bp upstream from the start codon of these histones for transcription-binding motifs. Indeed, we identified metal responsive elements (MRE) in both H3 and H4 (Table 3). Both histones H3 and H4 are present on two different chromosome clusters (e. g. clusters 1 and 2). For histone H3, one MRE is present in cluster 1 (located 2610 bp upstream from the start codon), while two MRE are present in cluster 2 (located 743 and 919 bp upstream from the start codon; Table 3). For histone H4, two MRE are present in cluster 1 (located 1405 and 1995 bp upstream from the start codon), while no MRE was detected in cluster 2 (Table 3).
Table 3 Metal response elements (MRE), as transcription-binding motifs, in H3 and H4 with their respective chromosome locations and nucleic acid (NA) position upstream from the start codon in base pairs (bp) identified from National Center for Biotechnology Information database searches (http://www.ncbi.nlm.nih.gov/sites/entrez)

R, bases A or G; N, bases G, A, T or C; X, not present.
Discussion
Neurodegenerative disease, aims and findings
Neurodegeneration imparts huge personal and financial costs upon sufferers, their family/carer(s) and society as a whole. These costs are predicted to rise over time in the absence of effective treatments. Given what is known in regards to the protective effect of DHA(Reference Akbar, Calderon and Wen18–Reference Crowder and Freeman20), and the deleterious effects of its deficiency on neuronal health(Reference Capasso, Jeng and Malavolta4, Reference Cunnane, Yang and Chen14, Reference Tesco, Koh and Kang21), basic questions remain about the underlying mechanisms. In addition, although an essential nutrient and a high concentration of free cellular Zn induce the formation of amyloid plaques and brain cell death; these are significant features of aging-related neurodegenerative processes such as AD. Key to addressing this is to identify novel proteins regulated by Zn and DHA. The present study was conducted to answer these questions, and is based on the well-established data that both Zn and DHA play an important role in neuroprotection, perhaps even synergistically, by modulating gene and protein expression, and critically, the activity of survival signalling pathways. The discovery that histones, particularly H3 and H4, are consistently differentially expressed as a result of Zn and DHA supplementation provides evidence to support this hypothesis.
In the present study reported here, both H3 and H4 were significantly downregulated by Zn in the absence of DHA (Zn effect). On the other hand, both H3 and H4 were significantly upregulated in M17 human neuronal cells following DHA treatment in the presence of physiological Zn levels (DHA effect). This is the first report showing that Zn and DHA regulate the expression levels of histones H3 and H4 in the M17 human neuronal cell line.
Histones
Histones are basic nuclear proteins that are responsible for the nucleosome structure of the chromosomal fibre in eukaryotes. They play an important role in nucleosome formation and hence gene expression. The four core histones (H2A, H2B, H3 and H4) function as one unit, the nucleosome, with Hl at the periphery. Three strong interactions result in the formation of two dimers (H2A with H2B and H2B with H4) and one tetramer (H3 with H4). In addition, there are weaker interactions between H2A and H4, and also between H2B and H3. There is also an interaction of intermediate strength between H2A and H3(Reference Elgin and Weintraub22). Therefore, it is likely that H3 and H4, being two of the four histone core subunits, act as one unit. Our findings that Zn and DHA influenced the expression of both H3 and H4 proteins in the same direction (down- or upregulated) are consistent with the known interaction of these two histones.
Possible mechanisms on the affect of zinc and DHA on H3 and H4 expression
We report here that both H3 and H4 possess multiple metal response elements upstream of their start codons, which suggests that the transcription of genes is under the control of Zn, possibly through metal-binding transcription factors. Thus, based on the present findings, we hypothesise that Zn may inhibit/repress the transcription of histones H3 and H4 in M17 human neuronal cells, resulting in lower histone protein levels, as observed in the present study. Indeed, there are emerging studies that show a role for Zn-mediated transcriptional repression, rather than activation, through MRE(Reference Zheng, Feeney and Kille23). It has been reported that inhibition of DNA synthesis terminates histone protein synthesis indicating that histone synthesis and DNA synthesis are very tightly linked(Reference Heintz, Sive and Roeder24). Although not investigated here, it is possible that Zn may also affect DNA synthesis and thereby result in the termination of H3 and H4 synthesis in M17 cells. Conversely, we have found that DHA upregulates expression levels of both H3 and H4 and abolishes the effect of Zn, suggesting that there is an interaction between Zn and DHA in these neuronal cells. The mechanism for this interaction is not clear; however, the end result is that Zn and DHA together may increase DNA synthesis.
The present results are supported by previous studies, which found that Zn affects histone expression in the mouse thymus(Reference Moore, Blanchard and Cousins25). In the present study, the expression of a number of transcription/translation-related factors, including H3 histone family 3A protein, was influenced by Zn, showing that dietary Zn can also alter gene expression levels. In a further study, rats fed a DHA-enriched diet for 2 months displayed many alterations in gene expression, among which H3 histone, family 3B was identified(Reference Barceló-Coblijn, Högyes and Kitajka26). Thus, the present results are supported by other data in the literature suggesting that Zn and DHA alter histone subunit expression, which in turn may alter the expression of many other genes. On a different note, effects of both Zn and DHA on histone expression may result from effects on the cell cycle. However, in our M17 human neuronal cell line, cells will be at different stages of the cell cycle, and cell cycle effects cannot be ascertained.
Summary, conclusions and future work
In summary, we report for the first time that Zn and DHA alter expression of histones H3 and H4 in the M17 human neuronal cell line. We hypothesise that expression of H3 and H4 may be negatively controlled by Zn via multiple MRE(Reference Laity and Andrews27). Conversely, DHA may play a role in the upregulation of H3 and H4 in nucleosome formation and gene expression. Under normal physiological Zn conditions, we propose that DHA facilitates DNA synthesis resulting in increases in histone protein levels, as observed in the present study. Thus, we further propose that DHA may contribute positively to minimising the onset of neurodegenerative diseases, such as AD, through maintaining the integrity of neuronal cell DNA synthesis and histone H3 and H4 synthesis. Neurodegenerative diseases may involve the compromisation of the integrity of neuronal cells through inhibition of DNA synthesis with consequent termination of histone synthesis and subsequent apoptosis. The present research is underway to investigate the direct association of Zn with H3 and H4 and the effect of DHA on the post-translational modification of histones. Understanding the molecular basis of the affect of Zn and DHA in neuroprotection may provide novel information on the treatment and management of neurodegenerative diseases.
Acknowledgements
The present work was supported by Deakin University's Central Research Grant Scheme and Faculty of Health, Medicine, Nursing and Behavioural Sciences cluster funding scheme. As the primary author, C. S. contributed to the overall design and supervision of the study, construction of figures and tables and writing of the manuscript; C. S. does not have conflict of interest. N. S. provided hands on performance of the 2D gel, Western and real-time PCR analyses; N. S. does not have conflict of interest. D. C. performed initial feasibility studies and assisted in writing of the manuscript; D. C. does not have conflict of interest. L. K. performed bioinformatics analysis component of the study and prepared Table 3; L. K. does not have conflict of interest. D. D. M. and J. L. assisted N. S. with cell culture treatment component of the study; D. D. M. and J. L. do not have conflict of interest. A. J. S. provided expertise, analysis and direction regarding DHA treatments of neuronal cells and assisted in writing of the manuscript; A. J. S. does not have conflict of interest. As the senior author, L. A. provided expertise, analysis and direction regarding Zn treatments of neuronal cells and assisted in writing of the manuscript; L. A. does not have conflict of interest.


