


Malnutrition is a serious and common condition in hospitalised patients, and it affects up to 60 % of these patients, depending on the hospital setting and the population( Reference Pirlich, Schutz and Norman 1 ). Internal wards with a high percentage of older adults have the highest prevalence rates( Reference Pirlich, Schutz and Norman 1 ). Malnutrition is defined as a condition in which a lack of energy, protein and/or other nutrients causes measurable and adverse effects on the body composition, function and clinical outcomes. It encompasses both undernutrition and overnutrition( Reference Elia, Lungqvist and Stratton 2 ). For the purpose of this paper, malnutrition refers to undernutrition. The adverse effects include prolonged wound healing, higher risks of complications, longer hospital stays, higher levels of care dependency and higher rates of mortality, all of which place a high cost burden on the healthcare systems( Reference Gomes, Emery and Weekes 3 , Reference Felder, Lechtenboehmer and Bally 4 ).
To adequately prevent and treat malnutrition in hospitalised patients, guidelines recommend conducting nutritional risk screening with a valid and reliable screening tool within 24 h of the patient’s hospital admission( Reference Beck, Balknas and Furst 5 – Reference Cederholm, Barazzoni and Austin 13 ). Malnutrition screening can be rapidly carried out to identify subjects at nutritional risk( Reference Cederholm, Barazzoni and Austin 13 ). Studies show that more than half of patients with (or at risk of) malnutrition are not identified unless malnutrition screening is conducted( Reference Bavelaar, Otter and van Bodegraven 14 , Reference Kruizenga, Wierdsma and Van Bokhorst 15 ). Furthermore, patients staying in wards that do not use a malnutrition screening tool receive fewer nutritional interventions than patients in wards that use a malnutrition screening tool( Reference Eglseer, Halfens and Lohrmann 16 ).
However, many hospitals have not integrated the routine use of a validated screening tool in the standard procedure in their wards, although this varies greatly among different countries( Reference Eglseer, Halfens and Lohrmann 16 , Reference Schindler, Pernicka and Laviano 17 ). If the healthcare staff members do not use a valid and reliable screening tool, other indicators are usually used to determine the nutritional status of the hospitalised patients. Commonly used indicators are weight or the BMI( Reference Eglseer, Halfens and Lohrmann 16 ). Another commonly used indicator is the clinical view of healthcare professionals, which is a subjective indicator. Weight, BMI and also the clinical view of staff are of low validity and reliability, and their use may lead to a lack of recognition of malnourished patients, which emphasises the need for systematic screening with validated tools( Reference Eglseer, Halfens and Lohrmann 16 ). Data collected as part of the ‘International Prevalence Measurement of Care Problems’, a large, cross-sectional, annual survey( Reference Eglseer, Halfens and Lohrmann 16 ), show that about 38·5 % of Austrian hospital wards use a screening tool but that the screening is not conducted with more than half of the patients on these wards.
The reasons that healthcare staff do not use a malnutrition screening tool are manifold and include the lack of time and knowledge, a low priority of nutritional issues in general, absence of a supportive organisational culture and negative attitudes of healthcare staff (e.g. nurses) towards malnutrition screening( Reference Green and James 18 , Reference Eide, Halvorsen and Almendingen 19 ). Malnutrition is a multidisciplinary topic, and successful nutritional care is only possible if professionals such as dietitians, physicians, nurses and nurses’ aides work together( Reference Tappenden, Quatrara and Parkhurst 20 ). For this reason, specific roles and responsibilities for patient nutritional care are often not clearly assigned to members of these different professions( Reference Green and James 18 ).
To convince healthcare staff, stakeholders and hospital managers of the need to use a nutritional screening tool as part of their daily routines, studies must be carried out to investigate the effectiveness of these tools( Reference Omidvari, Vali and Murray 21 ). However, until now, few studies have been conducted to evaluate the effectiveness of the use of a malnutrition screening tool with regard to the knowledge, attitudes and perceived practices (KAP) of healthcare staff in hospitals, although these are key components for the successful nutritional care of malnourished patients( Reference Omidvari, Vali and Murray 21 ).
Therefore, the aim of this study was to determine the effect of the use of a valid and reliable malnutrition screening tool as part of an existing electronic documentation system in a hospital to assess the KAP of nurses, nurses’ aides and physicians regarding malnutrition.
Methods
Design
A controlled study with a pre-test–post-test study design was conducted to determine the KAP of healthcare staff (nurses, nurses’ aides and physicians) on malnutrition at the baseline (T0) and 1 month after the implementation of a malnutrition screening tool (T1).
Participants
We chose a convenience sample of two Austrian hospitals, which represented the intervention and control groups, respectively. The inclusion criteria were that the hospitals had not used a malnutrition screening tool before the study, and both concurrently agreed that they were willing to use a malnutrition screening tool. Furthermore, the two hospitals were chosen owing to their similarities in terms of the patient characteristics (e.g. age and diseases) and organisational structures (e.g. sizes of the hospital, sizes of the wards, number of beds and specialisations).
This study was carried out in the internal wards of the respective hospitals. The internal wards were chosen because of the high prevalence of malnutrition in patients in these wards( Reference Pirlich, Schutz and Norman 1 , Reference Roller, Eglseer and Eisenberger 22 ). The participating hospitals decided to participate in this study and use it as a pilot project to determine whether the tool could be used in all hospital wards in the future. Fig. 1 shows the time frame of the study procedure.
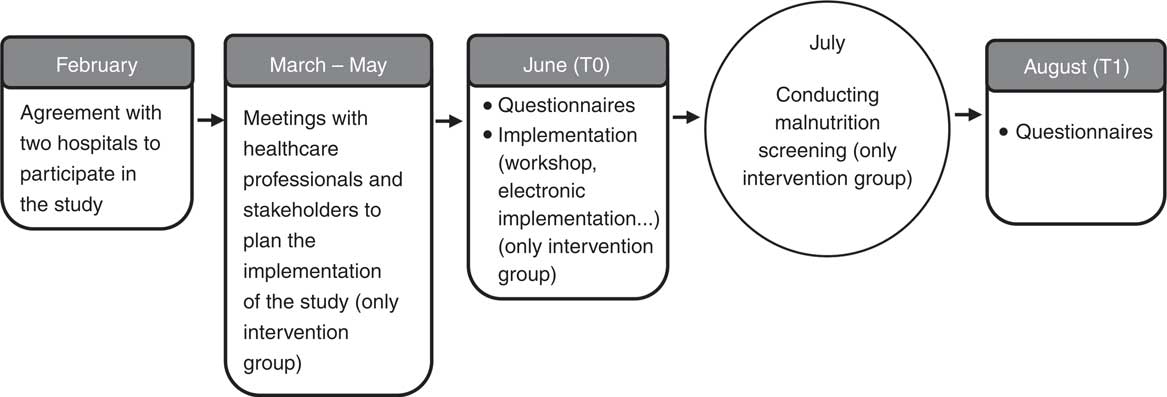
Fig. 1 Time frame of the study procedure.
Intervention
The intervention was the implementation of the Graz malnutrition screening tool (GMS)( Reference Roller, Eglseer and Eisenberger 22 ). This tool was chosen, among other reasons, because it has been developed by local experts. This increased the acceptability of the screening tool to the users. Furthermore, the GMS was chosen because it has been explicitly developed for hospitalised patients, based on the ESPEN guidelines for nutrition screening( Reference Kondrup, Allison and Elia 7 ). Furthermore, it shows good psychometric properties( Reference Roller, Eglseer and Eisenberger 22 ), and it was possible to use this screening tool in conjunction with the existing electronic documentation system used in the hospital. The GMS consists of four items: BMI, weight loss, nutritional intake and diseases related to nutrition.
The implementation process consisted of several actions. First, the screening tool needed to be integrated into the existing electronic documentation system of the hospital. We decided to include the screening in the process of electronically documenting patient records for practical reasons. We assumed that it makes the application of the screening as easy as possible, allowing staff to screen the patients’ nutritional status while performing the standardised nursing/medical assessment and entering this information into the electronic documentation system during the admission of the patients.
From March to May 2017, we held several meetings in the intervention hospital with the ward nurses and stakeholders to plan the time frame and implementation of the study (see Fig. 1). In June, the research dietitian conducted two workshops, each with a duration of about 45 min. In these workshops, the dietitian described the background of the screening tool, and provided instructions on how to fill out the screening forms. All the nurses, nurses’ aides and physicians in the respective wards were invited to take part in these workshops (i.e. participation was voluntary). At the workshops, two innovators (one nurse and one physician) were chosen who would control the application of the screening and remind colleagues to conduct the screening during the admission of each patient. The workshop explained how to use the screening tool and did not aim to educate the participants about malnutrition. Printed folders and posters, including the most important information about the project and the contact details from the project leader, were handed out to each ward nurse to be distributed in the participating departments.
The control group did not receive any intervention.
Questionnaire
To collect data, a questionnaire was used to assess the KAP of the study participants( Reference Laur, Marcus and Ray 23 ). Data were collected at two time points: at the baseline (T0, June 2017) and 1 month after the implementation of the malnutrition screening tool (T1, August 2017). The questionnaire was handed out to all nurses, nurses’ aides and physicians who were working in the participating wards by the research team in printed form (see Fig. 1).
Knowledge, attitudes and perceived practices
The first part of the questionnaire consisted of demographic questions, whereas the second part of the questionnaire was the instrument used to assess the KAP of the healthcare staff, which was previously published by Laur et al.( Reference Laur, Marcus and Ray 23 ). We obtained the written permission to use this questionnaire before starting the study. The questionnaire includes twenty-seven questions, which are divided in two subscales. The first subscale (twenty questions) includes questions that allowed us to assess the knowledge and attitudes (KA) of the health professionals, and the second subscale (seven questions) includes practice questions (P) that allowed us to assess the perceived nutritional practices regarding malnourished patients in the respective wards. The participants answered the questions using a five-point Likert scale (KA subscale) or four-point Likert scale (P subscale). The possible answers to the KA questions ranged from strongly disagree (one point) to strongly agree (five points). The answer categories for the P questions were as follows: never (one point), sometimes (two points), often (three points), always (four points) or not applicable (one point). The maximum score that could be achieved on the whole questionnaire was 128, which consisted of 100 points for the KA subscale and twenty-eight for the P subscale( Reference Laur, Marcus and Ray 23 ).
The questionnaire was designed to reflect high-quality nutrition care practices and was designed for use in hospitals( Reference Laur, Marcus and Ray 23 ). It has an acceptable length and generally takes about 10 min to complete. The questionnaire was tested in terms of its face validity and test–retest reliability, and satisfactory results were reached. The intra-class correlation coefficient (ICC) for the subscale KA was 0·69, and the ICC for the subscale practice was 0·84( Reference Laur, Marcus and Ray 23 ).
In the present study, the original English questionnaire was translated into the German language by a dietitian who is familiar with the terminology used in the area of malnutrition. Afterwards, an independent professional translator (native speaker) translated the questionnaire back to English. After a discussion was held with dietitians, nurses and nurse researchers, certain formulations were adapted after the back-translation, and a pre-test of the questionnaire was conducted with fifteen healthcare professionals. Subsequent feedback received from these professionals led to the final adaptations of the questionnaire, which ensured the simplicity and efficiency of its use.
Furthermore, three subjective statements were added that allowed us to collect data on the personal opinions of the participants and investigate the concurrent validity of the German version of the KAP questionnaire. These were as follows:
(1) my knowledge regarding malnutrition improved since the last measurement;
(2) my attitudes regarding malnutrition improved since the last measurement; and
(3) the nutritional management of malnourished patients at my ward improved since the last measurement.
These statements needed to be rated by the participants with a five-point Likert scale (answers ranging from strongly disagree to strongly agree).
Data analysis
All data were entered into the SPSS statistical software (SPSS Inc.) version 23 and analysed using descriptive statistics, χ 2 tests, Wilcoxon signed-rank tests and Student’s t tests. The confidence intervals for the t tests were set at 95 %. The effect sizes were calculated and interpreted as suggested by Cohen( Reference Cohen 24 ). The small effect size was set at 0·10, the medium effect size at 0·3 and the large effect size at 0·5( Reference Cohen 24 ). Questionnaires with missing data were excluded from the analysis to obtain the KAP total score, KA subscore and P subscore.
To analyse the three, additional, subjective questions (whether the participant believed that their KAP had changed), a new variable was created. With respect to this variable, the answers in the five-point Likert scale that were treated as ‘yes, knowledge/attitudes/perceived practices changed’ were ‘strongly agree’ and ‘somewhat agree’. Answers that were treated as ‘no, knowledge/attitudes/perceived practices did not change’ were ‘strongly disagree’ and ‘disagree’. ‘Neutral’ answers were not taken into account during the analysis of these items. The associations between the improvements in KAP and the intervention v. control group were analysed using the χ 2 test.
Justification of sample size
A calculation of minimally detectable effect sizes of changes in the KAP sum score between T0 and T1 was conducted. A sample size of 150 would have 80 % power to detect an effect size of at least 0·230 using a paired t test with a two-sided significance level of 0·05.
Ethical considerations
The local ethics committee approved the study (29–270 ex 16/17). Participation in the study was voluntary for the hospitals. The nurse hospital managers and the medical hospital managers had to provide their written informed consent. All ward nurses and medical heads in the participating departments had to provide their agreement to participate.
Results
Demographic data
A total of 269 nurses, nurses’ aides and physicians participated in the study and filled out the questionnaire at baseline. Of these 269 participants at baseline, 190 persons completed the questionnaire at T1. No significant differences in the demographic data among the participants in the intervention group and control group at baseline were observed (see Table 1).
Table 1 Baseline demographic data of the participants in the intervention* and control groups (Numbers and percentages)
*Person in the intervention group did not answer all of the demographic questions.
Changes in scores of the knowledge, attitudes and perceived practices questionnaire
Of the 190 questionnaires that were filled out at baseline (T0) and 1 month after the implementation of the malnutrition screening tool (T1), seven had missing data. Subsequently, 183 of the 269 participants’ questionnaires (68 %) could be included to calculate the sum score for the whole KAP questionnaire and scores for the KA and P subscales. The baseline scores for the intervention and control groups were very similar in terms of these three scales (see Table 2).
Table 2 Changes in sum score and subscores of the knowledge, attitudes and perceived practices (KAP) questionnaire before and after the implementation of the malnutrition screening tool, with effect size (Mean values and standard deviations)
IG, intervention group; CG, control group; KA, knowledge, attitudes; P, perceived practices.
The sum score for the KAP questionnaire changed significantly after the implementation of the malnutrition screening tool in the intervention group (P<0·001), but not in the control group (P=0·081). Similar results were observed when the data were analysed separately for each subscale. The KA score changed significantly in the intervention group (P=0·009) but not in the control group (P=0·113), and a significant improvement in the P subscale was observed in the intervention group (P=0·007) but not in the control group (P=0·968) (see Table 2).
Changes in single items on the knowledge, attitudes and perceived practices questionnaire
Overall, we observed significant, positive changes between T0 and T1 in eight items for the intervention group (see Table 3); specifically, these included four items in the KA subscale and four items in the P subscale. The highest effect size was reached regarding the change in agreement to the statement ‘All patients should be screened for malnutrition at admission to hospital’.
Table 3 Items on the knowledge, attitudes and perceived practices questionnaire that changed significantly in the intervention group between T0 and T1, with effect size (Mean values and standard deviations)
In the control group, data related to two items on the KA questionnaire improved significantly after the implementation of the screening tool (see Table 4) but no improvement was observed for the control group in the items of the P questionnaire (Table 5).
Table 4 Changes in the knowledge and attitudes (KA) items of the knowledge, attitudes and perceived practices questionnaire between T0 and T1Footnote * (Mean values and standard deviations)
* For some items, the n is slightly smaller than 122 or 68, because not everyone completed all questions.
† Reverse-coded questions.
Table 5 Changes in practice (P) items of the knowledge, attitudes and perceived practices questionnaire between T0 and T1Footnote * (Mean values and standard deviations)
* For some items, the n is slightly smaller than 122 or 68, because not everyone completed all questions.
Subjective questions regarding the change in knowledge, attitudes and perceived practices – concurrent validity
In all, 54·2 % of the participants in the intervention group stated that their knowledge of malnutrition improved, whereas this was indicated by only 20·7 % of the participants in the control group. This difference between the intervention group and the control group is statistically significant (P=0·003). However, 79·2 % of the participants in the intervention group reported that their attitudes had improved as opposed to 65·5 % of the participants in the control group (no significant difference between the groups). Meanwhile, 77·8 % of the participants in the intervention group stated that their perceived nutritional practices regarding malnourished patients improved, whereas only 34·8 % of those in the control group issued this statement (significant difference between the intervention and control group was observed, P<0·001).
Discussion
This study shows that the implementation of a malnutrition screening tool leads to an improvement in KAP of the healthcare staff (nurses, nurses’ aides and physicians) in hospitals. When comparing the results of the KAP questionnaire before the implementation (T0) and after the implementation (T1), we observed that the KA and P scores improved significantly in the intervention group but not in the control group. Participants in the intervention group indicated that their attitudes and knowledge (subscore KA) had improved, as well as their nutritional practices (P).
Improvements in single items of the knowledge and attitudes subscore
A significant improvement in the intervention group between T0 and T1 was observed for four items. The effect size for the change in pre-test and post-test results was the highest for the item ‘All patients should be screened for malnutrition at admission to hospital’. This means that the attitudes of the healthcare staff improved with regard to the application of a screening tool. This is an important finding as – before the project – nurses , nurses’ aides and doctors indicated that they were afraid that the application of the screening tool would be time-consuming and would not be beneficial. Some of the staff members were uncertain whether the use of a screening tool would be beneficial, because they assumed that they would recognise malnourished patients during their clinical examination. These types of expressions of attitudes displayed by staff towards validated screening tools were not only observed during the current project but have also been described in the literature( Reference Porter, Raja and Cant 25 – Reference Kurmann, Thilo and Hürlimann 27 ). Authors of recent studies have interviewed nurses and asked questions regarding the application of validated screening tools. The results of these interviews revealed that nurses often believe that they know when a patient requires further nutritional intervention and, therefore, assume that standardised screening is not necessary( Reference Porter, Raja and Cant 25 , Reference Abayomi and Hackett 26 ).
Another significant improvement in KA was noted in the responses to the general statement ‘Nutrition is not important to every patient’s recovery in hospital’ (reverse coded). The data showed that the attitudes towards, and knowledge about, the importance of nutrition has generally improved. Some studies have shown that positive attitudes correlate with higher knowledge, and can also lead to better nutritional practices( Reference Bauer, Halfens and Lohrmann 28 ). On the other hand, there are studies that were not able to show that an improvement in knowledge automatically improved behaviour and practices( Reference McCluskey and Lovarini 29 ), as sustained changes in nutritional practices are longer, complex and continuous processes( Reference Laur, Marcus and Ray 23 , Reference McCluskey and Lovarini 29 ).
Another positive change was observed in the positive responses to the statement ‘I know how to refer to a dietitian’. These responses show that the knowledge towards multidisciplinary cooperation has improved. This is an extremely important point as experts all agree that working together in multidisciplinary teams, which include dietitians, nurses, physicians and/or other healthcare professionals, is the most effective way to tackle the serious problem of malnutrition in hospital( 30 – Reference Kirkland and Shaughnessy 32 ). Nurses and physicians must realise that malnutrition is not only a topic that is assigned to dietitians but to the whole team that cares for the patients. Members of every profession have important roles in the provision of adequate nutritional care regarding malnutrition( Reference Green and James 18 , Reference Eide, Halvorsen and Almendingen 19 ).
After implementing the malnutrition screening tool, the participants of the present study indicated more frequently that they would need more training to provide better support for the patients’ nutrition needs. This suggests that the healthcare staff were not aware before the study that they might have gaps in nutritional knowledge and that the awareness of a need for further training was aroused by increased contact with the topic of malnutrition. The literature shows that nutritional topics are rarely included as part of the education of healthcare professionals such as nurses and physicians( Reference Kris-Etherton, Akabas and Bales 33 – Reference Chung, van Buul and Wilms 35 ). This indicates that they must pursue further education on their own to gain knowledge that enables them to detect, diagnose and treat malnutrition( Reference Kris-Etherton, Akabas and Bales 33 ).
Surprisingly, we observed improvements in the intervention group and in the control group, namely, for two items on the KA questionnaire (see Table 4). This could be partly explained by the impossibility of blinding in the study. The healthcare staff who participated in the study control group knew that they were part of a study on malnutrition as they had to fill out the questionnaires. They did not receive detailed information and received no intervention; however, the knowledge about the study alone may have led to a slight improvement in the KA for these two items. However, the data for the items in the practice questionnaire, as well as the sum scores, did not change significantly between T0 and T1 in the control group. To actually change nutritional practices, this shows that more interventions are necessary than simply knowing that a malnutrition study is being carried out.
Improvements in single items of the practice questionnaire subscore
The P subscore reflects what is actually being done to treat malnourished patients or patients at risk. A significant improvement in four out of seven items was observed in the intervention group. The results show that, after the implementation of the screening tool, the healthcare staff encouraged the patients to eat more frequently and assisted them if they needed help. Furthermore, they encouraged the families to bring food from home more often, checked the patients more often during the meals to see how well they were eating and altered their scheduled tasks more often to avoid interrupting the patients during their meals. Interventions in malnourished patients were not addressed at all in the 45-min workshops before the implementation process. This means that the improvement in nutritional practices was solely achieved by the implementation of the screening tool. It can be assumed that the awareness level of the healthcare staff increased, resulting in better nutritional practices and more frequently conducted interventions, by the process of implementing the screening tool alone.
Implementation process
Even though the results show positive improvement trends for most of the items on the questionnaire, not all items improved significantly in the intervention group. One possible explanation for these results, therefore, could be the low participation in the workshops that were held before the screening tool was implemented. As mentioned in the introduction, the study team recommended that all healthcare personnel involved in the study attend this workshop, but participation was voluntary. Therefore, not even 10 % of these personnel participated. The KAP may have improved even more significantly if all personnel had attended the workshop.
The study revealed that the number of dietitians was limited. Many at-risk patients were identified using the standardised, validated screening tool. These at-risk patients needed to receive a nutritional assessment from the dietitian who was in charge of the patients in the respective wards. If necessary, an individual nutrition plan had to be created by the dietitians. Because so many patients were identified as being at risk of malnutrition, the dietitians were not able to visit all of them owing to limitations in time and human resources. Of course, this had a negative impact on the entire nutrition care process, as some nurses legitimately raised the question of how meaningful it is to screen the patients if the number of dietitians is too limited to treat patients in need of nutritional care. However, these are structural problems and challenges that were revealed during the study, which subsequently led to discussions among healthcare professionals and stakeholders, and these findings are perceived as a positive outcome of the project. These types of organisational challenges have been described in other studies, which reported similar difficulties in clinical practice( Reference Green and James 18 , Reference Eide, Halvorsen and Almendingen 19 , Reference Kurmann, Thilo and Hürlimann 27 , Reference Cooper, Raja and Golder 36 ). Limited time and limited resources, as well as a lack of support from the organisation and stakeholders, have frequently been mentioned as the most important barriers to adequate malnutrition screening( Reference Green and James 18 ). To convince stakeholders to support the implementation of malnutrition screening, it is important to present convincing data and figures, all of which this study aimed to support. Furthermore, it is important to make stakeholders aware of the problem of malnutrition and enable them to realise the importance of nutrition in the health and well-being of patients( Reference Tappenden, Quatrara and Parkhurst 31 ).
The implementation of a malnutrition screening tool is the first step that can be taken towards offering successful nutritional care in hospitals. However, interventions must be carried out after the screening. The roles and responsibilities of members from all professions involved in nutritional care must be clearly assigned, and a structured approach should be adopted in the respective wards. This means that offering successful nutritional care in hospitals involves more than merely implementing a valid and reliable screening tool. The organisational culture towards nutrition needs to change, and nurses/medical managers and healthcare staff must invest significant efforts to achieve long-term changes.
Strengths and limitations
The major strength of this study is its inclusion of the non-equivalent control group and use of the pre-test–post-test design. This can be considered a strong design, because it allowed us to assess whether patients in the two hospitals had similar scores at baseline (T0). Because the intervention and control groups had similar scores at baseline, we can conclude that the pre-test–post-test differences were the result of the implementation of the malnutrition screening tool( Reference Polit and Beck 37 ). Furthermore, a high percentage (70·6 %) of the healthcare staff who participated in the study filled out the questionnaire at both measurement time points (T0 and T1). This made it possible to analyse paired responses, strengthening the results of the study.
The study had certain limitations. It was not possible to randomise the participants either to the control group or the intervention group, because the malnutrition screening tool was implemented in entire wards. We also decided not to randomise the wards to the control group or the intervention group, because this could have influenced the validity of the results. In addition, the two participating hospitals could choose whether they wanted to represent the intervention group or the control group.
The KAP questionnaire is a subjective measurement method. The questions were answered by the participants themselves and, therefore, self-perceived. This is especially relevant with reference to the nutritional practices, as these are self-perceived nutritional practices and not objectively observed practices. Furthermore, we did not assess whether the positive changes in KAP led to improved patient outcomes.
Conclusion
The results of this study show that the implementation of a validated malnutrition screening tool helps improve the KAP of healthcare staff (nurses, nurses’ aides, physicians). KAP are key components for successful nutritional care in malnourished patients, and an improvement in these factors may result in improved patient outcomes. It is of the utmost importance that the healthcare professionals involved in nutritional care are aware of their responsibilities, work together and communicate with all members of the multidisciplinary team. A sufficient number of dietitians should be employed in the hospitals to adequately meet the nutritional needs of patients at risk of malnutrition. The healthcare staff must be provided with enough human and time resources to manage malnourished patients in a successful and multidisciplinary manner. In the future, the KAP questionnaire can, and should, be used to recognise alterations in the KAP of healthcare staff in further studies, as well as in clinical practice projects. Future studies should be conducted not only to measure the outcomes in terms of the KAP of the healthcare staff or processes, but also to measure patient outcomes.
Acknowledgements
The authors thank the medical and nursing managers, as well as all physicians, nurses and nurses’ aides working at the participating hospitals, who made it possible to conduct the study.
The researchers did not receive any specific grant from funding agencies in the public, commercial or not-for-profit sectors.
D. E. designed and conducted the study and wrote the manuscript. R. J. G. H. and C. L. provided constant advice regarding the research (design, data analysis and so on) and edited and reviewed the manuscript.
The authors declare that there are no conflicts of interest.


