


Ultraprocessed foods are defined as industrially manufactured, ready-to-eat/heat formulations made with additives, such as dyes, flavourings and preservatives, that contain little, if any, whole foods. National and international studies have consistently found that diets high in ultraprocessed foods are higher in total energy, total fat, saturated fat, trans-fat, added/free sugars and Na while providing less protein, fibre and several essential vitamins and minerals than diets containing less ultraprocessed foods(Reference Moubarac, Batal and Louzada1–Reference Martinez Steele, Popkin and Swinburn4). Ultraprocessed foods have also been associated with multiple chronic conditions including obesity, type 2 diabetes, hypertension, CVD and cancer(Reference Fiolet, Srour and Sellem5–Reference Juul, Martinez-Steele and Parekh9).
Few studies have investigated changes in diet processing level over time in the USA(Reference Baraldi, Martinez Steele and Canella10–Reference Vandevijvere, Jaacks and Monteiro12). US food purchasing survey data suggest that households’ grocery purchases of highly processed foods, defined as multi-ingredient industrially formulated mixtures, remained stable at about 61 % of purchased energy content from 2000 to 2012, while purchases of minimally processed foods increased slightly(Reference Poti, Mendez and Ng11). In contrast, national retail data show that total volume sales of ultraprocessed foods and beverages decreased by 11·5 % from 2002 to 2016(Reference Vandevijvere, Jaacks and Monteiro12). To date, only one study has evaluated trends in diet processing level using self-reported dietary intake data in a US population. Analyses within the cross-sectional National Health and Nutrition Examination Survey (NHANES) showed that the average consumption of ultraprocessed foods in the general US population aged ≥2 years increased from 57·6 % to 59·7 % of daily energy content between 2007 and 2012, while minimally processed foods, defined as single-ingredient whole foods, only accounted for 27·5 % of daily energy content during this time(Reference Baraldi, Martinez Steele and Canella10). Ultraprocessed food intake was inversely associated with age and income and increased over time among men, adolescents and adults with high-school education(Reference Baraldi, Martinez Steele and Canella10). Older, highly educated and high-income adults consumed less ultraprocessed foods (range: 53–55 % of daily energy content), and their intake levels remained stable over the study period(Reference Baraldi, Martinez Steele and Canella10).
Trends in processed food intakes over longer time periods, and corresponding changes in diet quality, have not yet been evaluated. The objective of the present study was to examine longitudinal trends in food consumption according to degree of processing and diet quality from 1991 to 2008 within an ageing US population, using data from the Framingham Offspring Cohort (FOS). Spanning over a 17-year period, this study uniquely investigates dietary changes during middle through older adulthood, which represents a critical window of exposure to chronic disease risk factors.
Methods
Study population
The Framingham Heart Study (FHS) is an ongoing prospective cohort study in Framingham, MA, initiated by the National Heart, Lung, and Blood Institute with the objective to investigate CVD risk factors(Reference Dawber, Meadors and Moore13). The current study uses data from the FOS, which was enrolled as the second familial generation in 1971–1975 (age range 5–70 years; mean age 36 years), with approximate 4-year follow-up examinations thereafter(Reference Larson, Atwood and Benjamin14,Reference Kannel, Feinleib and McNamara15) . Details regarding FOS have been published previously(Reference Feinleib, Kannel and Garrison16). The FOS was conducted according to the Declaration of Helsinki guidelines, and written informed consent was obtained from all subjects enrolled in the FOS. The current study was approved by the University Committee on Activities Involving Human Subjects at New York University (IRB No.: IRB-FY2017-681).
Analytical data set
Dietary data collection for the FOS was initiated at the 5th examination in 1991–1995, which was considered the baseline for the current analyses. Participants who attended at least three examinations between 1991 and 2008 were eligible for the current analyses (n 3332). We excluded participants with missing or invalid dietary data for two or more examinations (n 439). In accordance with FHS criteria, dietary data were considered invalid if the food frequency questionnaire (FFQ) contained >12 blanks, or if total energy content was <600 (2510·4 kJ), or exceeded 3999 kcal (16731·8 kJ) for females and 4199 kcal (17,568·6 kJ) for males (n 329)(Reference McKeown, Troy and Jacques17). The creation of the analytical data set is presented in Fig. 1.
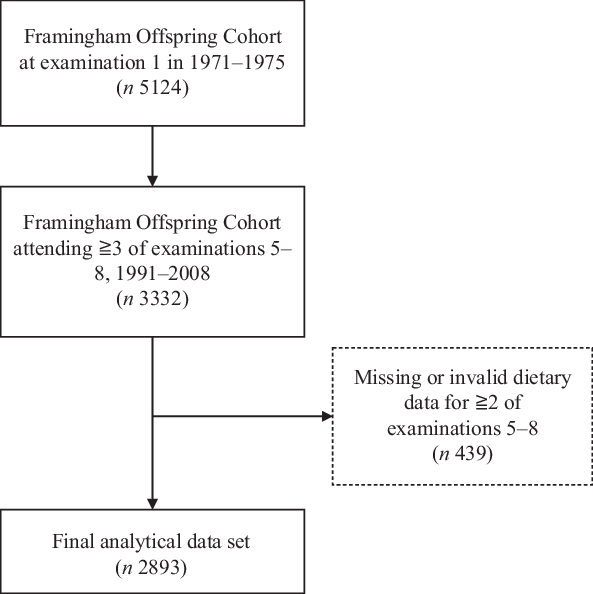
Fig. 1. Creation of the final analytical data set from the Framingham Offspring Cohort (1971–1975). Examination 5 (1991–1995) was used as baseline in the present analyses.
Assessment of dietary intake
Diet was assessed at each examination using the 131-item Harvard semi-quantitative FFQ, which has been validated for forty foods/food groups, energy, macronutrients, fibre, cholesterol, ten vitamins and seven minerals(Reference Hu, Rimm and Smith-Warner18,Reference Rimm, Giovannucci and Stampfer19) . Participants reported the frequency of consumption of specific foods in the previous year, with options ranging from never or <1 serving/month to ≥6 servings/d. Trained study personnel reviewed the FFQ together with participants at each examination to ensure accuracy of self-reported diet. Total energy and nutrient intakes were estimated from the FFQ using the US Department of Agriculture Nutrient Database for Standard Reference, which was updated regularly to reflect changes in the food supply over time(Reference Wolongevicz, Brown and Millen20).
Ascertainment of the exposure
Processing level
All FFQ items were classified based on the extent and purpose of the industrial food processing applied, in accordance with the NOVA food classification(Reference Monteiro, Cannon and Levy21). NOVA (not an acronym) distinguishes four mutually exclusive levels of processing: (1) ‘unprocessed or minimally processed foods’ including fresh, dry or frozen plant and animal foods; (2) ‘processed culinary ingredients’ including table sugar, oils, fats, salt and other constituents used in kitchens to make culinary preparations; (3) ‘processed foods’ including foods such as canned fish and vegetables, simple breads and artisanal cheeses which are manufactured by adding processed culinary ingredients to unprocessed or minimally processed foods and (4) ‘ultra-processed foods’; industrial formulations made with no or minimal whole foods and produced with substances extracted from foods or synthesised in laboratories such as dyes, flavourings and preservatives, often using processing techniques with no domestic equivalent(Reference Monteiro, Cannon and Levy21).
FFQ line items that included foods of potentially different processing levels were classified according to the most frequently consumed form of the food among adult participants in NHANES or based on literature regarding US dietary intakes (n 8, 6·25 %)(Reference Nielsen, Siega-Riz and Popkin22,Reference Martinez Steele, Baraldi and Louzada23) . For example, the FFQ item ‘yoghurt’ was classified as ultraprocessed as 86 % of yogurt consumed by adults in NHANES 2001–2002 was ultraprocessed. Likewise, breads were classified as ultraprocessed as previous investigations in NHANES indicate that the majority of breads consumed in the US population are industrially manufactured and ultraprocessed(Reference Martinez Steele, Baraldi and Louzada23). In cases were the most commonly consumed form could not be determined with certainty (n 2, 1·56 %), we classified the foods as the lowest potential processing level. FFQ items indicated to be homemade (e.g. home-baked cakes, cookies and sweet rolls) or assumed to be homemade due to lack of detailed information (e.g. soup/chowder) were classified as minimally processed foods.
The absolute consumption of foods (servings/d) from each NOVA processing level was calculated for each participant, that is, (1) unprocessed or minimally processed foods, (2) processed culinary ingredients, (3) processed foods and (4) ultra-processed foods. We calculated the weekly consumption of the specific food groups (servings/week) included in each NOVA processing level. An overview of the FFQ items included in each NOVA processing level and food group is presented in online Supplementary Table S1.
Diet quality
Diet quality was assessed using the Dietary Guidelines for Americans Adherence Index (DGAI) 2010(Reference Troy and Jacques24). Similar to the Healthy Eating Index 2010(Reference Guenther, Kirkpatrick and Reedy25), the DGAI-2010 measures adherence to the key recommendations of the 2010 Dietary Guidelines for Americans(Reference Troy and Jacques24). The DGAI-2010 was updated from the previous version, DGAI-2005, which was developed for the FOS in reference to the 2005 Dietary Guidelines for Americans(Reference Fogli-Cawley, Dwyer and Saltzman26). The DGAI-2010 evaluates intakes of fourteen food groups (fruit; dark green vegetables, orange and red vegetables; starchy vegetables; other vegetables; grains; milk; meat, protein and eggs; seafood; nuts; legumes; sugar; variety in protein choices and variety of fruits and vegetables) and eleven healthy choice or nutrient intake recommendations (amounts of total fat, saturated fat, trans-fat, cholesterol, Na, fibre, alcohol; and percentage of protein that is lean, milk that is low-fat, grains that are whole grains, and fruits that are whole fruits)(Reference Sauder, Proctor and Chow27). The maximum score of the DGAI-2010 is 100, and higher scores indicate greater adherence to the dietary guidelines and higher diet quality.
Assessment of other variables
Age, physical activity and smoking status (smokers v. non-smokers) were self-reported during interviews at each examination. Years of education were self-reported once at examination 2 (1979–1983). A physical activity index was calculated by first multiplying the average daily number of hours in each activity (resting or sleeping, or in sedentary, light, moderate or heavy physical activities) with the activity-specific metabolic costs, and then summing the weighted hours, as previously described in FHS(Reference Kannel and Sorlie28). Based on this index, physical activity level was categorised as low (<30), moderate (30–33) and high (>33)(Reference Jonker, De Laet and Franco29). Trained personnel measured weight and height at each clinical examination, using standardised methods. BMI (kg/m2) was calculated from measured height and weight and categorised as normal weight (<25 kg/m2), overweight (25–29·9 kg/m2) and obese (≥30 kg/m2)(30).
Statistical analyses
We calculated descriptive statistics (means, standard deviations for continuous variables and frequencies and percentage for discrete variables) for demographic and clinical characteristics of the sample at baseline (examination 5; 1991–1995). We examined trends in the intake of each NOVA processing level (servings/d), specific food groups within each NOVA processing level (servings/week), total energy content, macronutrients, fibre, Na and diet quality in the full sample, and among males and females separately, using means, standard deviations and P-values for trends over the four examinations (examinations 5–8, 1991–2008). Trends were reported separately for males and females, as previous studies have identified sex differences in dietary patterns in the FOS and the general US population(Reference Juul, Martinez-Steele and Parekh9,Reference Millen, Quatromoni and Gagnon31) . In exploratory analyses, trends in NOVA processing levels were stratified by BMI and smoking status, as food choices and eating patterns may differ between these subgroups. As a sensitivity analysis, we examined trends for participants with and without prevalent chronic diseases (CVD, diabetes and hypertension) to assess whether dietary behaviours may change in response to disease diagnosis. We performed trend analyses using mixed effects models with subject-specific random intercepts to account for within-subject correlation across examinations. Non-linear trends were assessed by adding quadratic or higher-order time variables to the models. Analyses were performed using Stata/se 15.1 (StataCorp).
Results
Participant characteristics at first dietary assessment (1991–1995)
Participant characteristics at the first dietary assessment (examination 5, 1991–1995) are summarised in Table 1. Participants were predominantly middle-aged (mean age = 54·1 years), overweight (mean BMI = 27·3 kg/m2) and college-educated (mean years of education = 14·1). The majority of participants had a high level of physical activity (52·6 %) and were non-smokers (81·8 % and 82·5 % of females and males, respectively). Over a fourth (26·2 %) of males and a fifth of females (20·4 %) had obesity. Prevalence of diabetes (8·1 v. 4·6 %) and CVD (10·2 v. 4·8 %) was significantly higher among males than among females (P < 0·001).
Table 1. Characteristics of participants in the Framingham Offspring Cohort in 1991–1995 (examination 5)
(Mean values and standard deviations, numbers and percentages, n 2741)
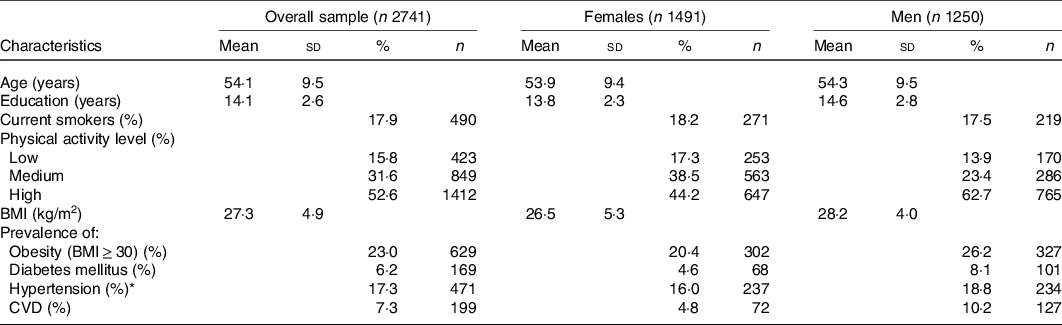
Missing values: Education, n 333; current smoking, n 2; physical activity, n 57; BMI, n 10; diabetes mellitus, n 8; hypertension, n 13.
* % of participants receiving treatment for hypertension.
Trends in food consumption according to processing level among males and females
Trends in food consumption by NOVA processing level in the overall sample and among males and females are presented in Fig. 2. Participants consumed the majority of daily servings in the form of minimally processed foods, followed by ultraprocessed foods in 1991–2008. Compared with men, women consumed significantly more minimally processed foods at exams 5 (P < 0·001) and 8 (P = 0·025) and less processed food and ultraprocessed foods at all time points (P < 0·001). Ultraprocessed food consumption declined significantly in the whole sample and among females and males between 1991 and 2008 (–1·5 servings/d, P trend < 0·001). A trend towards decreased consumption of minimally processed food was also identified in the overall sample and among males and females; however, the magnitude of change was minimal (–0·6 servings/d in the overall sample, P trend < 0·001). In contrast, there was a small yet statistically significant increase in the consumption of processed foods among both females (+0·3 servings/d, P trend < 0·001) and males (+0·1 serving/d, P trend = 0·013). Consumption of culinary ingredients increased minimally among females (+0·2 servings/d, P trend < 0·001), while no change was observed among males (P trend = 0·391).

Fig. 2. Trends in food consumption (servings/d) by NOVA processing level from 1991 to 2008 in (a) the overall sample and in (b) females and (c) males, in the Framingham Offspring Cohort. ![]() , 1991/1995;
, 1991/1995; ![]() , 1995/1998;
, 1995/1998; ![]() , 1998/2001;
, 1998/2001; ![]() , 2005/2008.
, 2005/2008.
Trends in intakes of specific food groups within each processing level
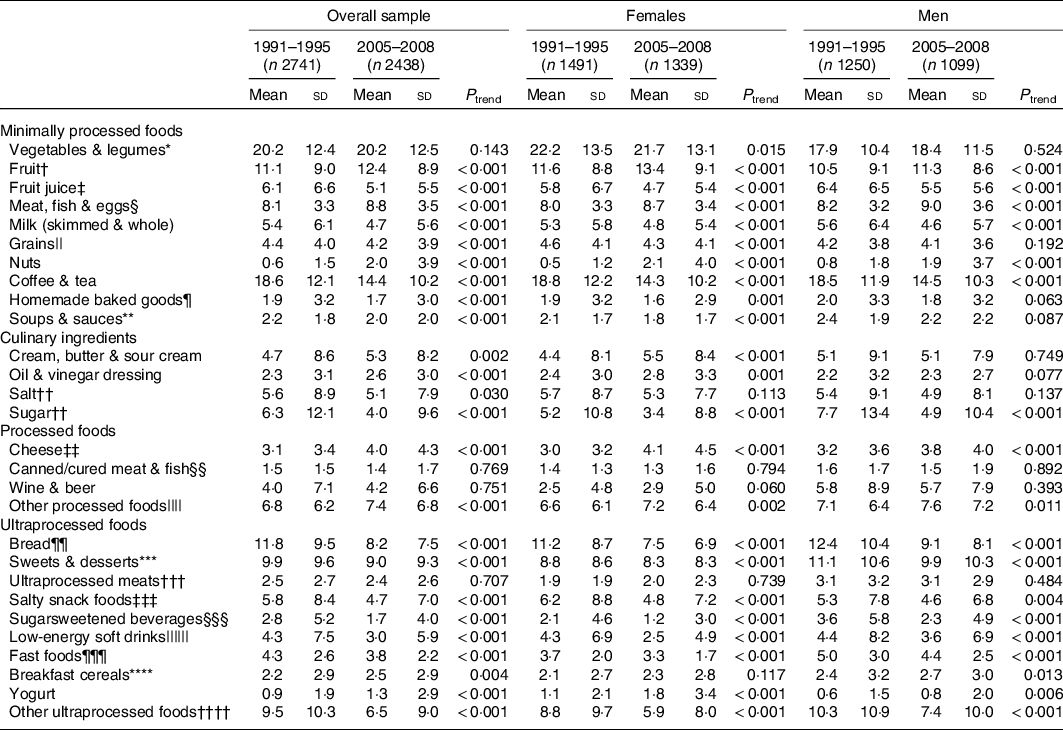
Intakes of foods included within each processing level (servings/week) and P-values for trends over time in the overall sample, and among females and males, are presented in Table 2. Among minimally processed foods, consumption of fruits, nuts, and meat, fish and eggs increased, while intakes of fruit juices, skimmed and whole milk, and coffee and tea decreased in the overall sample and among males and females. Consumption of minimally processed grains, vegetables and legumes also decreased among females, but not among males. Of culinary ingredients, consumption of butter, cream, sour cream and oil and vinegar dressing increased among females only, while the addition of sugar to beverages decreased among both males and females. Intakes of homemade baked goods, soups and sauces decreased among females but not among males. Finally, consumption of all ultraprocessed foods, except for ultraprocessed meat products and yoghurt, decreased in the overall sample, and among females and males. Intake of ultraprocessed breakfast cereals increased among males but not among females.
Table 2. Trends in mean intake of specific food groups (servings/week) by NOVA processing level from 1991 to 2008 among males and females, Framingham Offspring Cohort
(Mean values and standard deviations, n 2893)
* Includes broccoli, cabbage/coleslaw, cauliflower, Brussels sprouts, alfalfa sprouts, carrots (raw/cooked), mixed vegetables, winter squash, summer squash, beets, celery, spinach (raw/cooked), iceberg/head lettuce, romaine/leaf lettuce, tomatoes, yams/sweet potatoes, kale/mustard greens/chard, garlic, beets, maize, potatoes, string beans, peas/lima beans and beans/lentils.
† Includes apples and pears, bananas, raisins, prunes, cantaloupe, watermelon, oranges, grapefruit, strawberries, blueberries and peaches.
‡ Includes orange juice, grapefruit juice, tomato juice, apple juice/cider and other fruit juices.
§ Includes chicken/turkey (with/without skin), liver, meat as main dish, dark meat fish, other fish, shellfish (e.g. shrimp, lobster, scallops) and eggs.
|| Includes oatmeal, rice (brown and white), pasta, bran, wheat germ, minimally processed hot and cold breakfast cereals and other grains.
¶ Includes homemade sweet rolls, cookies, cakes, pies and granola.
** Includes fried food made at home, soup/chowder and tomato sauce (assumed homemade).
†† Added to foods and beverages by participant at time of consumption.
‡‡ Includes cottage cheese/ricotta and other cheese.
§§ Includes canned tuna and bacon.
|||| Includes peanut butter, mustard, jams/jellies, tofu, mayonnaise and processed breakfast cereals (cereals with added salt and/or sugar but without additives).
¶¶ Includes white and dark bread and English muffins/bagels.
*** Includes readymade sweet rolls, pies, cookies, doughnuts, brownies, pancakes/waffles, muffins/biscuits, ice cream, sherbet/ice milk, candy bars, chocolate and candy without chocolate.
††† Includes processed meats (e.g. sausage, bologna, salami), hot dogs and meat sandwiches.
‡‡‡ Includes chips, crackers and popcorn.
§§§ Includes cola and non-cola carbonated drinks with sugar, punch, lemonade and other non-carbonated fruit drinks.
|||||| Includes low-energy cola and non-cola carbonated beverages (with/without caffeine).
¶¶¶ Includes, pizza, hamburgers, French fries and fried foods away from home.
**** Includes breakfast cereals containing additives such as flavours, colours and preservatives not used in domestic cooking.
†††† Includes non-dairy coffee whitener, margarine, cream cheese, liquor and chilli sauce.
Trends in diet quality and energy and nutrient intakes
Trends in energy and nutrient intakes and diet quality in the overall sample and among males and females are presented in Table 3. The DGAI-2010 score increased in the overall sample and among females (62·9–63·9, P trend = 0·013) and males (56·8–58·6, P trend < 0·001) over the study period. DGAI-2010 scores were lower among males than females at all time points (P < 0·001). Total energy intake remained stable between 1991 and 2008, while the percentage of energy provided by total carbohydrates, sucrose and fructose decreased among both females and males (P trend < 0·001). Intake of total sugar (% energy) decreased from 1998 to 2008 among females and males (P trend < 0·001); however, data regarding total sugar intake were not available for 1991–1998. The percentage of energy provided by protein, total fat, saturated fat, monounsaturated fat and polyunsaturated fat also increased among both males and females (P trend < 0·001), while percentage of energy from trans-fat decreased (P trend < 0·001). Fibre intakes increased in the overall sample and among males and females (P trend < 0·001), while Na intakes decreased slightly from 1158·1 to 1083·9 mg/1000 kcal (P trend < 0·001).
Table 3. Trends in mean energy intake, nutrient intakes and diet quality from 1991 to 2008 among males and females, Framingham Offspring Cohort
(Mean values and standard deviations, n 2893)

* Data regarding total sugar intake not available for examinations 5 (1991–1995) and 6 (1995–1998).
† Data regarding trans-fat intake not available for examination 6 (1995–1998).
‡ 2010 Dietary Guidelines for Americans Adherence Index (continuous, range 0–100), higher scores indicate higher diet quality. Data regarding DGAI-2010 were not available for examination 6 (1995–1998).
Trends in food consumption according to processing level and diet quality by BMI category
Over the study period, the consumption of minimally processed foods decreased slightly among participants with normal weight (–0·4 servings/d), overweight (–0·7 servings/d) and obesity (–0·5 servings/d) (P < 0·001) (Fig. 3). The intake of ultraprocessed foods also declined among participants with obesity (–1·9 servings/d), overweight (–1·7 servings/d) and normal weight (–1·2 servings/d) (P trend < 0·001). While the consumption of ultraprocessed foods remained higher among participants with obesity compared with participants with normal weight at all time points (P < 0·001), the magnitude of the difference declined over time (8·3 v. 6·9 servings/d in 1991–1995, and 6·4 v. 5·8 servings/d in 2005–2008). There were trends towards increased consumption of culinary ingredients and processed foods, and decreased consumption of culinary preparations among participants with normal weight, overweight and obesity, but changes in intakes were minor (+/–0·2 or fewer servings/d). Diet quality increased among participants with normal weight (61·8–63·3, P trend < 0·001), overweight (59·9–61·5, P trend < 0·001) and obesity (58·1–59·9, P trend = 0·009) over the study period (data not shown).
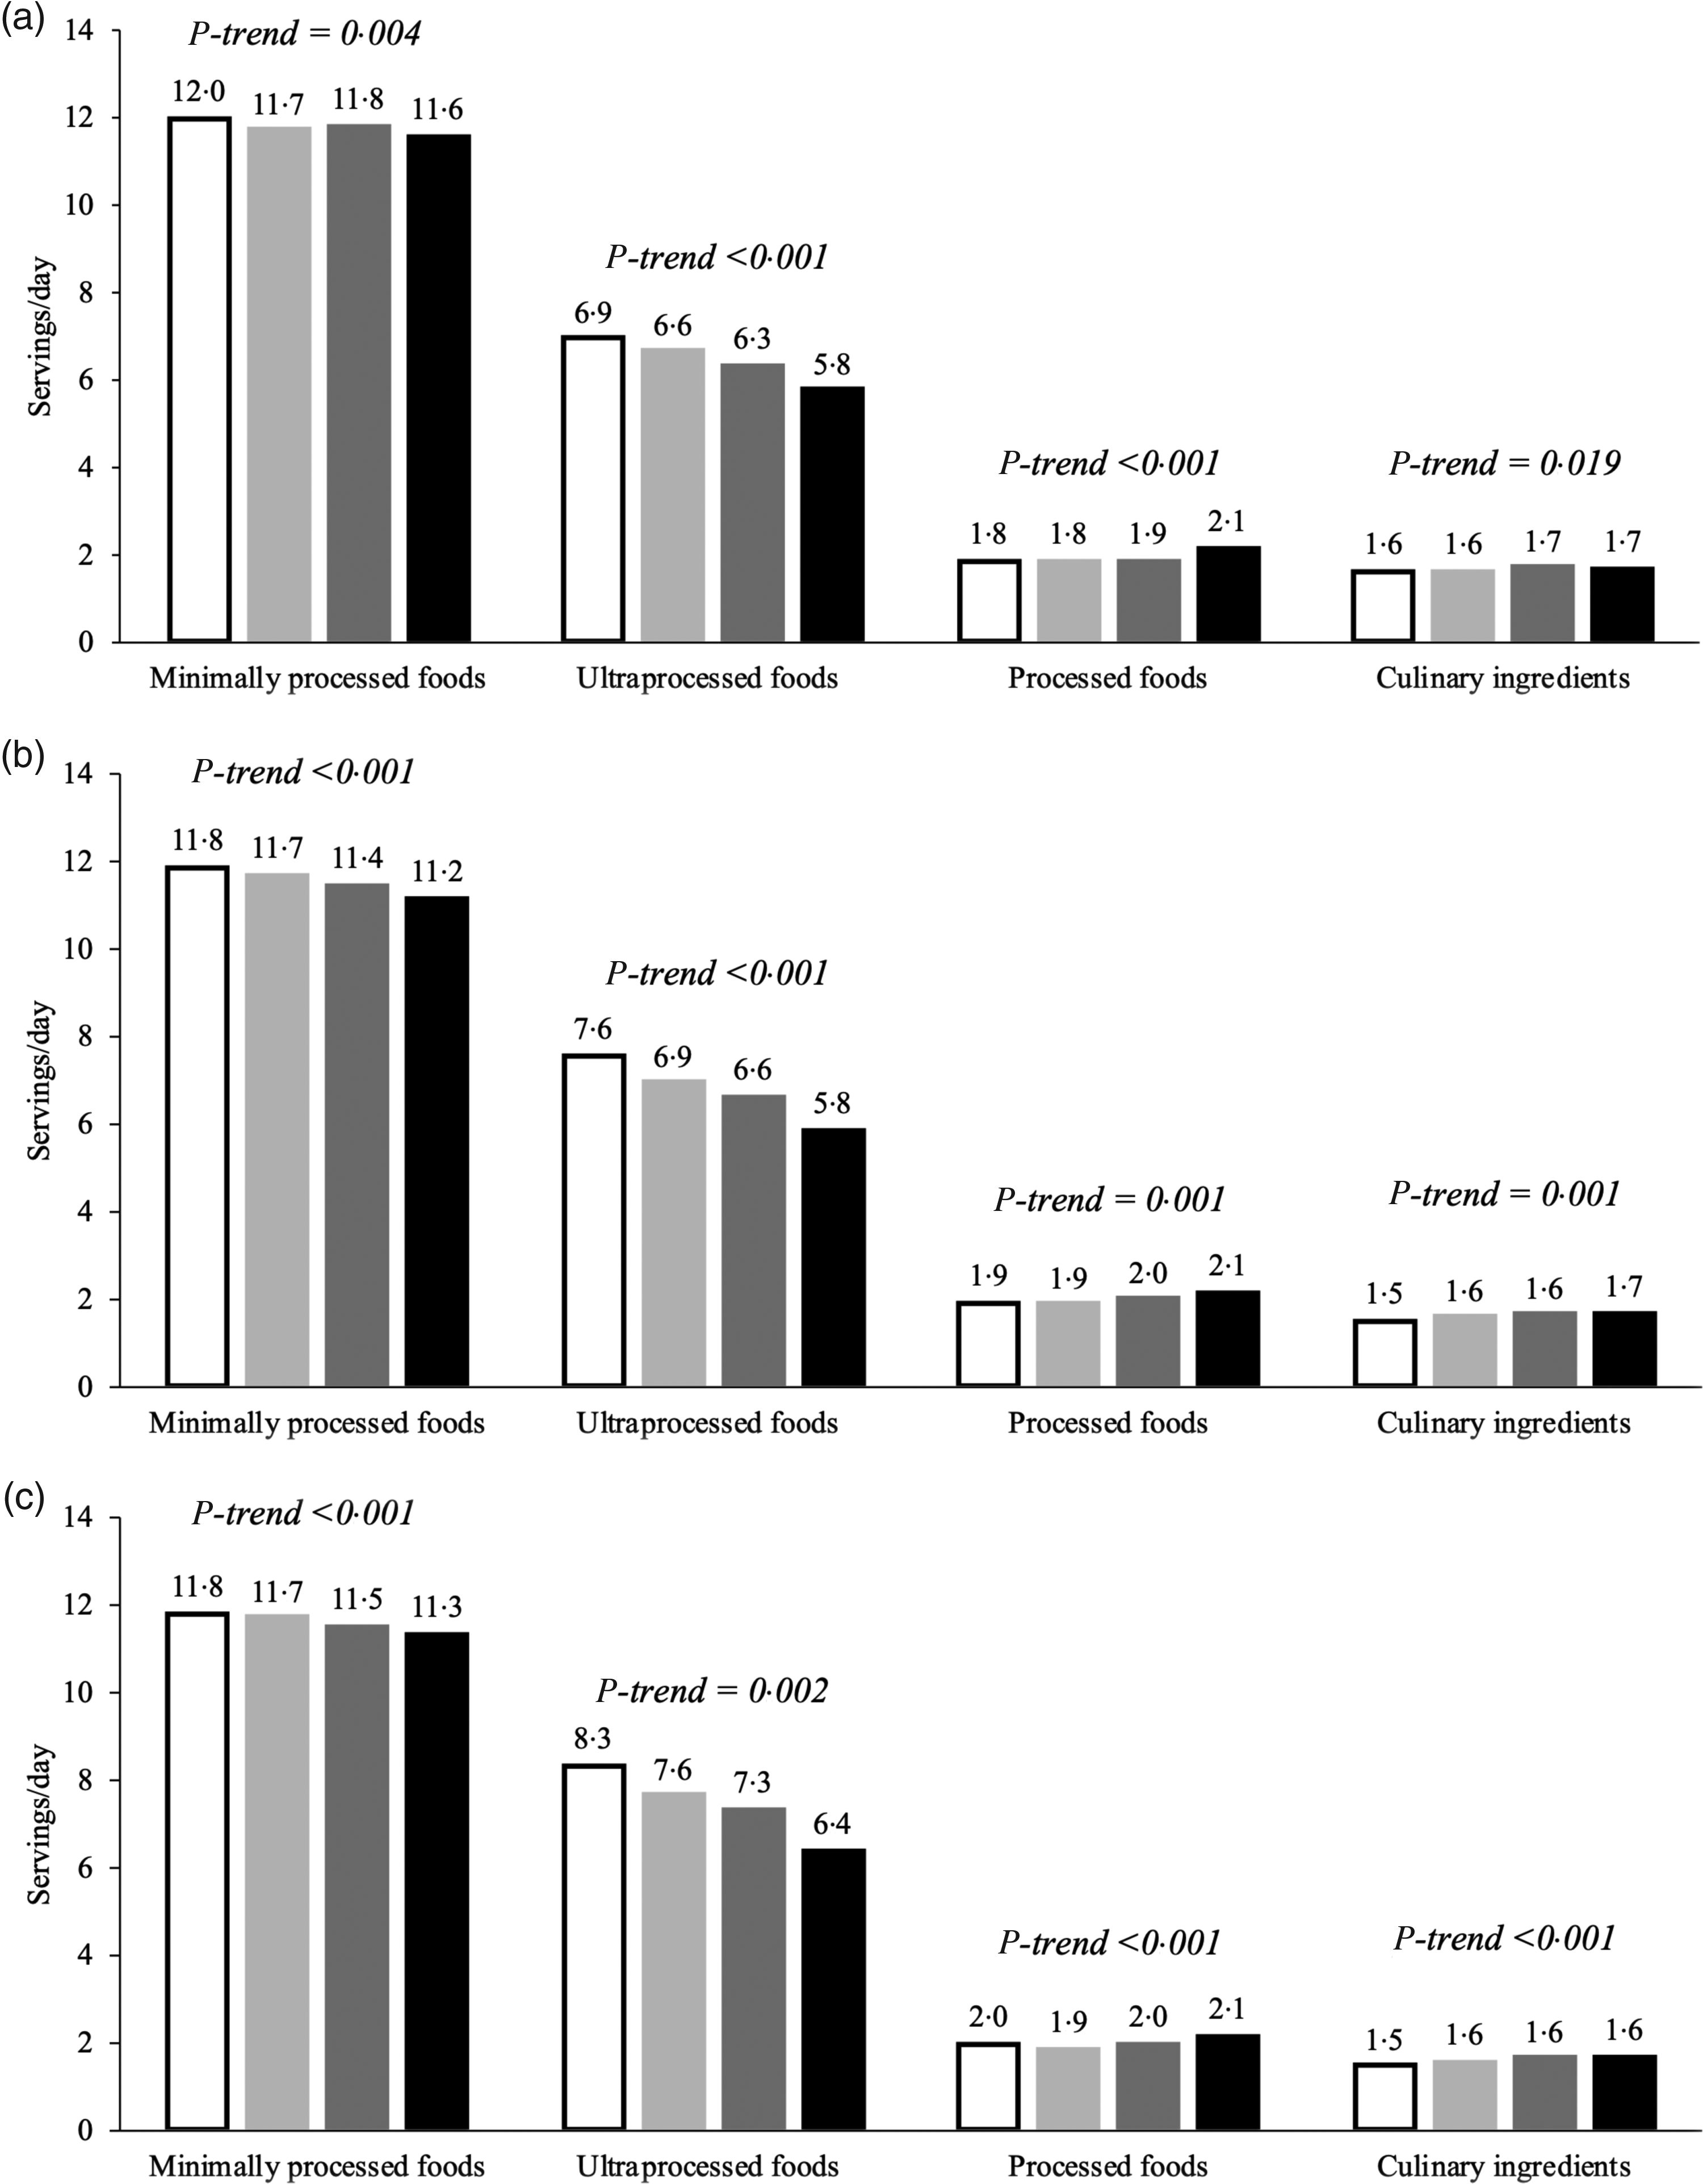
Fig. 3. Trends in food consumption (servings/d) by NOVA processing level from 1991 to 2008 among participants in the Framingham Offspring Cohort with (a) normal weight, (b) overweight and (c) obesity. ![]() , 1991/1995;
, 1991/1995; ![]() , 1995/1998;
, 1995/1998; ![]() , 1998/2001;
, 1998/2001; ![]() , 2005/2008.
, 2005/2008.
Subgroup and sensitivity analyses
Trends in food consumption according to processing level did not differ between smokers and non-smokers and were comparable to those in the overall population (data not shown). Diet quality was higher among non-smokers than smokers at all time points (P < 0·001) and increased among non-smokers (61·4–62·1, P trend = 0·001), but not among smokers (54·4–55·0, P trend = 0·117) over the study period (data not shown). Likewise, trends in diet processing level intake did not differ when the analyses were repeated among individuals with and without chronic diseases (CVD, diabetes mellitus and hypertension) and were similar to those in the overall population (data not shown). Diet quality did not differ between individuals with and without chronic diseases at baseline (P = 0·074) and improved over time among disease-free participants (59·9–62·1, P < 0·001) but not among those with chronic diseases (60·8–61·0, P = 0·878) (data not shown).
Discussion
Ultraprocessed foods were frequently consumed in this predominantly Caucasian population of ageing adults over the 17-year study period (1991–2008), although intakes decreased modestly over time. Trends in diet processing level were similar in males and females and irrespective of weight and smoking status. Diet quality, measured by DGAI-2010, improved modestly over time for the entire study population, except for current smokers and participants with chronic disease.
Our results are consistent with, and extend, findings from NHANES, 2007–2012, showing that ultraprocessed foods provided 55–53 % of energy content in the diet of middle-aged and older US adults (≥40 years of age)(Reference Baraldi, Martinez Steele and Canella10). In the FOS, the observed trend towards reduced consumption of ultraprocessed foods over time is also in line with analyses of Euromonitor volume sales data, documenting that US sales of ultraprocessed foods declined from 401·0 to 354·6 kg per capita between 2002 and 2016(Reference Vandevijvere, Jaacks and Monteiro12). However, analyses within the Nielsen Homescan Panel suggest that US households’ purchases of highly processed foods, defined as multi-ingredient industrially formulated mixtures, remained stable, at approximately 61 % of purchased energy content, between 2002 and 2012(Reference Poti, Mendez and Ng11), a period that coincides with FOS dietary data collection.
In the FOS, the declining intake of ultraprocessed foods occurred in parallel to modest improvements in diet quality and reductions in the intakes of trans fats and Na, as well as sucrose and fructose, the predominant added sugars in the US food supply(Reference Marriott, Cole and Lee32). Our findings align with previous observations in NHANES that the quality of the US diet improved from 1999 to 2011(Reference Wilson, Reedy and Krebs-Smith33). In the FOS, we observed decreased intakes of margarine, fast foods, salty snacks, breads and sweet ultraprocessed foods (baked goods, sweets, desserts and sugar-sweetened beverages), which are major sources of trans fats, Na and added sugars in the US diet(Reference Marriott, Cole and Lee32,34,Reference Kris-Etherton, Lefevre and Mensink35) . Our findings contribute to the existing evidence suggesting that limiting ultraprocessed foods may be an effective strategy to improve diet quality(Reference Martinez Steele, Popkin and Swinburn4).
The observed changes in nutrient intakes in the FOS may reflect shifts in dietary behaviours in response to national dietary guidelines, from recommending low-fat diets (<30 % of energy) in the 1990s to moderate-fat diets (25–35 % of energy) in 2005(36,37) , as well as the growing popularity of low-carbohydrate diets in the early 2000s(Reference Kuchler, Golan and Variyam38). Increased marketing and availability of ultraprocessed low-fat products in the 1990s and low-carbohydrate products in the 2000s may also have promoted and facilitated the observed trends in macronutrient intakes. For example, in 1996, over 3400 novel low-fat or fat-free ultraprocessed products were introduced to the US market, and in 2004, 3400 new ‘low-carb’ and ‘no-carb’ ultraprocessed products were launched(Reference Kuchler, Golan and Variyam38). In this context, the nutrient-focused approach of national dietary guidelines in the 1990s and 2000s may have enabled, and unintentionally promoted, continued high consumption of ultraprocessed foods(Reference Mozaffarian and Ludwig39). While the current DGA (2015–2020) emphasise the importance of healthy dietary patterns based on nutrient-dense foods, processing level is still not explicitly addressed(40). Future investigations should determine if food-based dietary guidelines that distinguish ultraprocessed from moderately and minimally processed foods facilitate healthier food choices and improve diet quality.
The current findings should be interpreted in the light of several limitations. The reduced consumption of ultraprocessed foods over the study period may, in part, be explained by diminishing food intake, as ageing is associated with reduced appetite and decreased energy intake(Reference Giezenaar, Chapman and Luscombe-Marsh41). The Harvard FFQ queries a comprehensive, although not exhaustive, list of foods, and we can only draw conclusions regarding intake trends of foods included in the FFQ. We were unable to calculate the relative energy provided by the foods in each processing level since the FOS only provides data regarding total energy and nutrient intakes per day, and not per food. As a result, consumption estimates are reported in servings/d and are not directly comparable to consumption estimates from NHANES, which are reported as percentages of total energy intake. Although it is well documented that dietary assessment by FFQ provides an imperfect measure of diet(Reference Schatzkin, Kipnis and Carroll42), the Harvard FFQ is widely used in research and has been validated in US populations(Reference Hu, Rimm and Smith-Warner18,Reference Rimm, Giovannucci and Stampfer19) . Processing level may have been misclassified as certain FFQ line items included foods of potentially different processing levels. However, we attempted to minimise misclassification by basing assumptions of processing level of FFQ items on the current literature and on actual consumption data from adults in NHANES 2001–2002 with similar demographics to the FOS cohort. The Harvard FFQ differentiates between homemade and ready-made cookies, cakes, pies and pastries; distinguishes between homemade and commercially prepared fried foods and allow respondents to specify the type and brand of breakfast cereals consumed, which enabled a more precise classification of these foods. Dietary data in the FOS were not available beyond year 2008 at the time of writing. Nevertheless, the FOS is an ongoing cohort study, and more recent dietary data have been collected, which, when made available, will enable determination of consumption trends during the 2010s. Finally, the FOS is an older cohort with higher education and income levels than the average US population, which may limit the generalisability of our findings. Given that age, education and income are inversely associated with ultraprocessed food intake(Reference Baraldi, Martinez Steele and Canella10), consumption may have been lower in the FOS cohort as compared with the average US population. FOS participants may also be more health conscious than the general population given their voluntary participation in a longitudinal health study.
The present study also has important strengths, including its longitudinal design, nearly 20-year follow-up, and serially collected dietary and anthropometric data by trained study personnel during in-person study examinations. Food processing level was determined according to the standardised and objective criteria of NOVA. The NOVA framework is a comprehensive, specific and coherent classification that has been internationally recognised as a valid tool for public health and nutrition research and policy(43). Additionally, diet quality was evaluated using an objective and multi-dimensional index that considers food and nutrient intakes, as well as healthy food choices (e.g. choosing whole grains over refined grains), variety in protein and vegetable intakes, and overconsumption of energy-dense foods and discretionary energy content(Reference Sauder, Proctor and Chow27).
Conclusion
The current study uniquely adds to the literature by describing longitudinal trends in diet processing level and diet quality in an ageing US population, highlighting the longstanding presence of ultraprocessed foods in the American diet. Further research is warranted to elucidate trends in diet processing level in racially/ethnically diverse populations and across socio-economic strata and to clarify the role of diet processing level in existing disparities in diet quality. Given the accumulating evidence of the poor nutritional quality and potential harms of ultraprocessed foods, public health efforts and policies should be designed to limit the consumption of ultraprocessed foods and encourage healthier food choices. It is also imperative to educate health professionals and the population at large about what ultraprocessed foods are in order to enable selection of less processed products.
Acknowledgements
We thank Dr Euridice Martinez Steele for guidance in classifying the dietary data according to the NOVA framework.
The Framingham Heart Study is conducted and supported by the National Heart, Lung, and Blood Institute (NHLBI) in collaboration with Boston University (Contract No. N01-HC-25195). Funding support for the Framingham Food Frequency Questionnaire data sets was provided by ARS Contract No. 53-3k06-5-10, ARS Agreement No.'s 58-1950-9-001, 58-1950-4-401 and 58-1950-7-707. This manuscript was not prepared in collaboration with investigators of the Framingham Heart Study and does not necessarily reflect the opinions or views of the Framingham Heart Study, Boston University, or NHLBI.
The authors’ responsibilities were as follows: F. J. and N. P. designed the overall research plan within the existing dataset; F. J. constructed the analytical data set and performed the statistical analyses; Y. L. and N. P. provided expertise regarding statistical analyses, F. J. took lead in writing the manuscript; Y. L., A. L. D., G. V. and N. P. aided in the interpretation of the data and revised the manuscript for important intellectual content. N. P. oversaw the research project as senior author. All authors have read and approved the final manuscript and take full responsibility for the final content.
The authors declare that there are no conflicts of interest.
Supplementary material
For supplementary material referred to in this article, please visit https://doi.org/10.1017/S000711452100060X


