


Obesity is a cardiovascular risk factor that is also associated with a substantial increase in the risk of type 2 diabetes, hypertension and lipoprotein metabolism disorders. Concerted efforts have been made to establish the relationship between obesity and lipid intake; yet, most of the studies are merely based on the total SFA( Reference Sanz, Lopez-Bote and Menoyo 1 – Reference Timmers, de Vogel-van den Bosch and de Wit 4 ), total unsaturated fatty acid( Reference Sanz, Lopez-Bote and Menoyo 1 – Reference Stachon, Furstenberg and Gromadzka-Ostrowska 5 ), MUFA( Reference Matsuo, Takeuchi and Suzuki 3 ), n-6 PUFA( Reference Matsuo, Takeuchi and Suzuki 3 , Reference Jen, Buison and Pellizzon 6 – Reference Czernichow, Thomas and Bruckert 9 ) and n-3 PUFA( Reference Newman, Bryden and Fleck 8 , Reference Okuno, Kajiwara and Imai 10 – Reference Martinez-Victoria and Yago 12 ) contents of edible oils. In general, a high-SFA-rich diet is perceived to be more obesogenic than diets with lower saturated contents( Reference Sanz, Lopez-Bote and Menoyo 1 – Reference Matsuo, Takeuchi and Suzuki 3 ). However, it has been reported that cocoa butter (COB), a typical saturated fat that contains 63 g SFA/100 g total fatty acids, causes less weight gain when compared with safflower and olive oils( Reference Timmers, de Vogel-van den Bosch and de Wit 4 ). A study carried out by Matsuo et al. ( Reference Matsuo, Takeuchi and Suzuki 3 ) has shown positive correlations of carcass fat content with palmitic, stearic and oleic acids and a negative correlation with linoleic acid in rats. Thus, an excessive intake of MUFA is also postulated to exert detrimental effects on adiposity( Reference Matsuo, Takeuchi and Suzuki 3 ).
There has been some controversy regarding the effect of n-6 PUFA, in particular, linoleic acid, on obesity. In recent studies, linoleic acid has been reported to exert pro-obesity effects using rodents( Reference Stachon, Furstenberg and Gromadzka-Ostrowska 5 , Reference Jen, Buison and Pellizzon 6 ); notwithstanding this, some researchers have postulated n-6 PUFA to be most effective at limiting fat accretion( Reference Matsuo, Takeuchi and Suzuki 3 , Reference Ikemoto, Takahashi and Tsunoda 7 , Reference Newman, Bryden and Fleck 8 ). A recent review article has disclosed that the role of n-6 PUFA in obesity remains vague as no conclusive inference can be drawn from the available epidemiological evidence( Reference Czernichow, Thomas and Bruckert 9 ). Additionally, n-3 PUFA( Reference Okuno, Kajiwara and Imai 10 , Reference Micallef, Munro and Phang 11 ) have also been claimed to reduce fat deposition; yet, no definite results could be obtained by a systematic review evaluating the effect of n-3 PUFA on body-mass gain( Reference Martinez-Victoria and Yago 12 ). It is evident that the reported results contradict each other. Moreover, there is a paucity of information regarding the positional fatty acids of TAG and their associated effects on obesity.
Kojima et al. ( Reference Kojima, Tachibana and Yamahira 13 ) reported that dietary 1(3)-behenoyl-2, 3(1)-dioleoylglycerol, which contains long-chain saturated behenic acid (22 : 0) at sn-1 or sn-3 position, prevents visceral fat deposition. Our recent in vivo study has also revealed that long-chain SFA tend to reduce fat deposition if present at sn-1 and sn-3 positions( Reference Gouk, Cheng and Mok 14 ). An exceptional direct negative correlation has been found between fat/feed and total SFA content at sn-1, 3 positions( Reference Gouk, Cheng and Mok 14 ). If long-chain SFA are present at sn-1, 3 positions, they might not be readily absorbed upon hydrolysis due to the formation of Ca soaps and consequently enter the distal gut and colon, where they are excreted( Reference Mattson, Nolen and Webb 15 , Reference Brink, Haddeman and de Fouw 16 ).
Prior literature has disclosed that the excretion of SFA is also directly related to their chain lengths( Reference Kojima, Tachibana and Yamahira 13 ). Henceforth, we hypothesised that further alleviation of fat deposition might occur if stearic acids rather than palmitic and oleic acids are mainly present at sn-1, 3 positions. In the present study, the effect of common long-chain SFA, namely palmitic acid (16 : 0) and stearic acid (18 : 0), at sn-1, 3 positions of TAG on obesity was investigated using COB, sal stearin (SAL), palm mid fraction (PMF) and high-oleic sunflower oil (HOS). Feed efficiency in terms of fat deposition, i.e. fat/feed, was determined to accurately interpret the diet-induced adipogenic effects of the test oils.
Materials and methods
Diet
Autoclavable standard pellet feeds (digestible energy 14·0 MJ/kg) were purchased from Specialty Feeds. The nutrient composition of the autoclavable standard pellet feeds is given in the Supplementary material (available online). Refined, bleached and deodorised SAL, also known as Shorea robusta, was a gift from Mewah Oil Sdn. Bhd. Refined, bleached and deodorised COB, PMF and HOS were obtained from Intercontinental Specialty Fats Sdn. Bhd. The total and positional fatty acid compositions of dietary oils are given in Tables 1 and 2, respectively. The diets were prepared by fortifying the standard pellet feeds with the test oils at a composition of 150 g/kg diet; subsequently, the mixtures were pelleted into original shape. These diets were left to dry at 30°C overnight before being fed to the mice. All the test diets were isoenergetic (20 MJ/kg; 60 % of energy from fat).
Table 1 Total fatty acid compositions of dietary oils and fats (g/100 g of total fatty acids)
COB, cocoa butter; SAL, sal stearin; PMF, palm mid fraction; HOS, high-oleic sunflower oil; ND, not detected.
Table 2 Positional fatty acid composition (mol/100 mol of total fatty acids) of dietary oils
COB, cocoa butter; ND, not detected; SAL, sal stearin; PMF, palm mid fraction; HOS, high-oleic sunflower oil.
* The cis-11-monoene mainly consists of cis-vaccenic acid (18 : 1n-7)( Reference Cheng, Choo and Ma 19 ).
Animals
A total of forty weaned male C57BL/6 mice were obtained from Monash University. The mice were acclimatised to the environmentally controlled laboratory environment (23 ± 2°C and a relative humidity of 60 %) under a 12 h light–12 h dark cycle. Subsequently, they were randomly divided into four groups of ten mice each and housed individually. The average body masses of the mice did not differ significantly after randomisation (P= 0·089) and were 19·7 (sd 0·9), 19·9 (sd 1·2), 20·3 (sd 0·7) and 19·7 (sd 1·2) g for the COB, SAL, PMF and HOS dietary groups, respectively. Throughout the 15 weeks of the experimental period, the mice were given ad libitum access to water and food. Food intake was determined on a daily basis, whereas the body mass of the mice was recorded weekly. The actual food intake was corrected for spilled food after separating it from the faeces of the mice. Fresh faecal samples were collected daily and stored at − 20°C. The mice were killed by dislocation of the neck. The subcutaneous and visceral adipose tissues were removed from the carcasses, weighed and kept frozen at − 80°C. The relative amount of total fat is expressed as the fat mass percentage in mouse carcass. Data on body-mass gain and mass of fat deposited were subjected to normalisation with total food intake, shorthanded as gain/feed and fat/feed, respectively. All the protocols followed in the in vivo study were approved by the Animal Care and Use Committee, University of Malaya, Kuala Lumpur, Malaysia (ethic no: KIM/22/11/2011/GSW (R)).
Lipid analysis
The extraction and isolation of lipids from adipose tissue and faecal samples were carried out in accordance with a modified method( Reference Folch, Leens and Sloane-Stanley 17 ). The analyses of total fatty acid compositions of the test oils and faecal lipids were carried out in accordance with earlier work( Reference Gouk, Cheng and Mok 14 ). The composition ratio of major NEFA in faeces:individual fatty acids in the test oils was computed to represent the excretion index of each fatty acid. Regiospecific analyses of the test oils and adipose tissue samples were carried out using a JEOL ECA-400 MHz NMR spectrometer (JEOL Ltd) as reported previously( Reference Gouk, Cheng and Ong 18 ). Faecal fatty acids were derivatised, and their absolute amounts were ascertained by GC according to the method of Cheng et al. ( Reference Cheng, Choo and Ma 19 ).
Statistical analyses
All the statistical analyses were carried out using IBM SPSS Statistic 20 (SPSS Inc.). One-way ANOVA was used to assess the significance of differences among the dietary groups, whereas Tukey's honestly significant difference test was used for pairwise comparisons. P values lower than 0·05 were considered significant.
Results
Food intake, body-mass gain and body-mass gain/g of feed
All the mice exhibited comparable total food intake (P= 0·400) throughout the experimental period. Food intake on a weekly basis is given in the Supplementary material (available online). Mice fed the HOS-enriched diet gained significantly higher body mass when compared with those fed the COB-enriched (P= 0·030) and SAL-enriched (P< 0·001) diets (Table 3). Mice fed the SAL-enriched diet also exhibited significantly lower (P= 0·023) body-mass gain when compared with those fed the PMF-enriched diet (Table 3). Normalised data indicated significantly lower gain/feed in the COB (P= 0·002) and SAL (P< 0·001) dietary groups than in the HOS dietary group. In addition, mice fed the PMF-enriched diet had significantly higher gain/feed (P= 0·003) compared with those fed the SAL-enriched diet (Table 3).
Table 3 Effect of dietary oils in C57BL/6 mice after 15 weeks (Means values with their standard errors)

COB, cocoa butter; SAL, sal stearin; PMF, palm mid fraction; HOS, high-oleic sunflower oil.
a,b,cMean values within a row with unlike superscript letters were significantly different (P< 0·05).
* P values were determined by one-way ANOVA.
† Food intake was calculated as the total food intake for each mouse in 15 weeks and then averaged for each group (n 10).
Fat deposition
Mice in the HOS dietary group exhibited significantly higher subcutaneous fat mass when compared with those in the COB (P= 0·004), SAL (P< 0·001) and PMF (P= 0·029) dietary groups (Table 3). Furthermore, the percentage of visceral fat was significantly lower in mice fed the SAL-enriched diet than in those fed the PMF-enriched (P= 0·041) and HOS-enriched (P= 0·010) diets. Overall, the HOS dietary group exhibited significantly higher total fat deposition when compared with the COB (P= 0·017) and SAL (P= 0·001) dietary groups.
With respect to the relative amount of total fat contributing to the final body mass, mice in the HOS dietary group exhibited a significantly higher percentage of subcutaneous fat compared with those in the COB (P= 0·008), SAL (P< 0·001) and PMF (P= 0·036) dietary groups. Furthermore, mice in the SAL dietary group displayed a significantly lower percentage of visceral fat (P= 0·035) compared with those in the HOS dietary group. With respect to the relative amount of total fat in the carcass, mice fed the HOS-enriched diet exhibited a significantly higher percentage compared with those fed the SAL-enriched (P= 0·002) and COB-enriched (P= 0·041) diets.
The mass of fat deposited was further subjected to normalisation with total food intake, shorthanded as fat/feed. Subcutaneous fat/feed (Table 3) of the HOS dietary group was significantly higher than that of the COB (P= 0·001), SAL (P< 0·001) and PMF (P= 0·016) dietary groups. The values of visceral fat/feed and total fat/feed were significantly lower in the SAL (P= 0·007 and P< 0·001, respectively) and COB (P= 0·043 and P= 0·006, respectively) dietary groups than in the HOS dietary group. Furthermore, mice fed the PMF-enriched diet continued to exhibit significantly higher visceral fat/feed (P= 0·029) compared with those fed the SAL-enriched diet (Table 3). It is worth noting that significantly lower amounts (P= 0·037) of total fat deposited per g of feed consumed were observed in the SAL dietary group than in the PMF dietary group. On the other hand, the COB dietary group exhibited non-significant differences for all the parameters when compared with both the SAL and PMF dietary groups.
As shown in Fig. 1, a poor correlation was observed between feed efficiency (fat/feed) and total SFA content at sn-1, 3 positions of TAG in dietary fats (r 0·6847–0·9195). Correlation coefficients for all the parameters were non-significant, as the resultant P values were greater than 0·05. Nevertheless, when fat/feed was plotted against stearic acid content at sn-1, 3 positions, negative linear correlations were observed for subcutaneous fat/feed, visceral fat/feed and total fat/feed (r 0·9693, 0·9989 and 0·9999, respectively) (Fig. 2). Correlation coefficients for both total fat/feed and visceral fat/feed against stearic acid content at sn-1, 3 positions were found to be statistically significant at P values of 0·011 and 0·030, respectively.
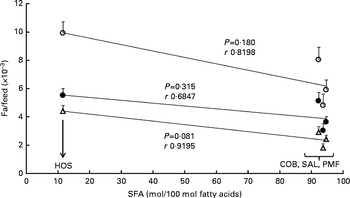
Fig. 1 Effect of SFA content at sn-1, 3 positions of TAG on fat deposition (mass of fat deposited/total feed consumed). Values are means for each group (n 10), with their standard errors represented by vertical bars. Correlation coefficients with P values < 0·05 were considered significant. COB, cocoa butter; SAL, sal stearin; PMF, palm mid fraction; HOS, high-oleic sunflower oil; r, correlation coefficients. ○, Total fat/feed; Δ, subcutaneous fat/feed; ●, visceral fat/feed.
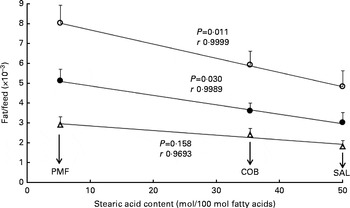
Fig. 2 Effect of stearic acid content at sn-1, 3 positions of TAG on fat deposition (mass of fat deposited/total feed consumed). Values are means for each group (n 10), with their standard errors represented by vertical bars. Correlation coefficients with P values < 0·05 were considered significant. COB, cocoa butter; SAL, sal stearin; PMF, palm mid fraction; r, correlation coefficients. Data obtained for the high-oleic sunflower oil dietary group were not included, as the factor affecting fat deposition was the high MUFA content at sn-1, 3 positions. ○, Total fat/feed; Δ, subcutaneous fat/feed; ●, visceral fat/feed.
Faecal fatty acids
The lipid fraction of mouse faeces mainly contained NEFA, while TAG and other partial acylglycerols remained undetected. The composition of faecal NEFA of each dietary group is given in the Supplementary material (available online). With respect to the absolute amount of faecal fatty acids excreted (Table 4), the SAL dietary group excreted significantly higher amounts of NEFA than the COB (P= 0·038), PMF (P= 0·031) and HOS (P= 0·002) dietary groups. Among the four dietary groups, the HOS dietary group excreted the lowest amounts of faecal NEFA (Table 4).
Table 4 Absolute amount of NEFA in the faeces of mice of different dietary groups (Mean values and standard deviations)
COB, cocoa butter; SAL, sal stearin; PMF, palm mid fraction; HOS, high-oleic sunflower oil.
a,b,cMean values of total fatty acids for each dietary group (n 10) with unlike superscript letters were significantly different (P< 0·05).
The excretion index denotes the relationship between faecal fatty acids and their corresponding composition in the ingested fats (Table 5). The most abundant MUFA, namely oleic acid, is most readily absorbed, as the excretion indices fall in the range of 0·28–0·60. In other words, the relative composition of oleic acid in faeces is lower than that in dietary fats. On the contrary, the major SFA, namely palmitic and stearic acids, are relatively more readily excreted, as their excretion indices are greater than unity. Greater excretion indices were observed for stearic acid (1·32–3·87) than for palmitic acid (1·15–3·33) in all the dietary groups (Table 5).
Table 5 Excretion indices for major fatty acids in the faeces of mice of different dietary groups
COB, cocoa butter; SAL, sal stearin; PMF, palm mid fraction; HOS, high-oleic sunflower oil.
* Excretion index denotes the relationship between faecal fatty acids and their corresponding composition in the ingested fats.
Discussion
In the present study, C57BL/6 mice were employed as this strain has been reported to be a robust and efficient animal model for human obesity and type 2 diabetes as well as to remain lean if the fat content of the diet is limited( Reference Surwit, Kuhn and Cochrane 20 – Reference Winzell and Ahrén 22 ). Most of the animal models do not fulfil these requirements, as they are mainly based on monogenic disorders of limited relevance to human obesity and diabetes. Moreover, C57BL/6 mice exhibit intact leptin signalling and display delayed-onset obesity that can be amplified in response to high-fat diets, making them an ideal model for human obesity studies( Reference Kennedy, Ellacott and King 23 ). In addition, this mouse model has a genetic factor similar to that of humans that causes diabetes after the development of obesity( Reference Surwit, Kuhn and Cochrane 20 ).
The major TAG present in the test oils, namely COB, SAL, PMF and HOS, used in the present study were 1-palmitoyl-2-oleoyl-3-stearoyl glycerol (POSt), 1,3-distearoyl-2-oleoyl glycerol (StOSt), 1,3-dipalmitoyl-2-oleoylglycerol and trioleoylglycerol, respectively( Reference Gunstone, Harwood, Gunstone, Harwood and Dijkstra 24 ). In an effort to examine the obesity-alleviating effect of SFA at sn-1, 3 positions, these positions were varied among palmitic, stearic and oleic acids, whilst sn-2 position was mainly conserved with oleic acid (Table 2). In addition, normalised data, namely gain/feed and fat/feed, were analysed and subcutaneous adiposity and visceral adiposity were used as markers of fat deposition.
Long-chain SFA at sn-1, 3 positions reduce fat deposition
Throughout the 15 weeks of the experimental period, there was no discrepancy in the food intake of all the dietary groups, suggesting that all the test oils exerted similar effects on hunger and appetite. In line with previous findings( Reference Gouk, Cheng and Mok 14 ), the diet enriched with HOS (MUFA mainly present at sn-1, 3 positions) was found to cause higher fat deposition than diets with long-chain SFA at similar positions, as observed in the COB, SAL and PMF dietary groups. Furthermore, significantly greater amounts of faecal fatty acids were observed in the latter groups (Table 4), suggesting that the greater excretion of long-chain SFA at sn-1, 3 positions contributed to the lower fat deposition observed. The amount of resynthesised TAG was reduced, affecting their participation in subsequent metabolism and their distribution in tissues and eventually the extent of fat deposition. Therefore, this further validates our postulation, i.e. when long-chain SFA are present at sn-1 and sn-3 positions, the extent of fat deposition will be alleviated. In contrast, the major MUFA, namely oleic acid, was found to be least readily excreted (excretion indices < 1; Table 5), as it was well absorbed in the intestine.
Stearic acid at sn-1, 3 positions is more efficient than palmitic acid at sn-1, 3 positions at reducing fat deposition
Surprisingly, SAL had been shown to lead to significantly lower gain in body mass as well as visceral and total fat mass compared with PMF, despite their similarity in the positional distribution of long-chain SFA. This observation was concomitant with the significantly higher amounts of faecal NEFA excreted by the SAL dietary group (Table 4), as well as the relatively higher excretion index of stearic acid in comparison with that of palmitic acid (Table 5). In line with the previous literature( Reference Lien, Yuhas and Boyle 25 ), the extent of SFA excretion is related to the chain length, i.e. stearic acid is more readily excreted than palmitic acid. Consequently, this phenomenon has been shown to exert a remarkable impact on fat deposition.
When normalised data (fat/feed) were plotted against total SFA content at sn-1, 3 positions (Fig. 1), the linear correlation as suggested previously( Reference Gouk, Cheng and Mok 14 ) was not observed in the present study. Palmitic acid at sn-1, 3 positions, which was the sole major SFA, was responsible for the notable linear correlation observed in the previous study( Reference Gouk, Cheng and Mok 14 ), while in the present study, varying amounts of stearic and palmitic acids at sn-1, 3 positions were employed for comparison. Therefore, a negative linear correlation with exceptional correlation coefficients was only observed when feed efficiency (fat/feed) was correlated with the amount of individual stearic acids at sn-1, 3 positions (Fig. 2). This suggests that both stearic and palmitic acids exert differential effects on fat absorption and subsequently fat deposition. Data obtained for the HOS dietary group are not shown in Fig. 2, as the factor affecting fat deposition was the high MUFA content at sn-1, 3 positions. Besides the fat-reducing effect of long-chain SFA at sn-1, 3 positions proposed previously( Reference Gouk, Cheng and Mok 14 ), an extended finding is that stearic acid is more efficient at limiting fat deposition than palmitic acid at similar positions.
For efficient intestinal absorption, micelles formed by bile salts transport the non-polar stearic and palmitic acids across the aqueous boundary layer of intestinal wall. The equilibrium between non-polar and aqueous phases and the rate at which the NEFA establish equilibrium between the two phases are crucial for determining the absorption of fatty acids( Reference Freeman 26 ). Poor diffusion of fatty acids into the aqueous phase may inhibit the action of enzymes by blocking the interface. As stearic acid is relatively more apolar than palmitic acid, a lower trend towards intestinal absorption is expected. This has been demonstrated by the remarkably higher amounts of excreted NEFA in the faeces of the SAL dietary group than in that of the PMF dietary group (Table 4). The reduced absorption of stearic acid will subsequently lead to the reduction of resynthesised TAG levels in chylomicron and their distribution in tissues and eventually the extent of fat deposition.
Furthermore, differences in the physio-chemical properties of Ca soaps of fatty acids may give noteworthy insights into their different extent of faecal excretion. For instance, Krafft point for a Ca soap of oleic acid is 31°C, for that of palmitic acid is 65°C and for that of stearic acid is 82°C( Reference Yamaguchi, Kaneda and Kakinuma 27 ). Calcium palmitate and calcium stearate are thus solid at body temperature. Consequently, there is no value for the critical micelle concentration as micelles cannot be formed. In general, Krafft points of all the fatty acids are elevated in the presence of Ca ions( Reference Yamaguchi, Kaneda and Kakinuma 27 ). Furthermore, the solubility of Ca salt of palmitic acid in water has been reported to be 0·012 mg/l, while a lower extent of dissolution, i.e. 0·0007 mg/l, has been observed for calcium stearate at 25°C( Reference Irani and Callis 28 ). Hence, the intestinal absorption of NEFA probably appears to be determined by both hydrophobicity and the Krafft point in aqueous solution. In addition to malabsorption-type effects, the reduced feed efficiency and adiposity observed in the present study may also have occurred as a result of increasing fat oxidation and energy expenditure.
Regiospecific analysis of adipose tissue samples (see Supplementary material, available online) indicated a tremendous depreciation of SFA at sn-1, 3 positions (44·1–64·9 mol%), suggesting the lower intestinal absorption of SFA and de novo synthesis by desaturation. In addition, mead acid (20 : 3n-9), which is an indicator for the deficiency of essential fatty acids, was not detected in the subcutaneous as well as visceral adipose tissue samples of mice of all the dietary groups (see Supplementary material, available online). The present study demonstrates that fats predominantly comprised of high amounts of StOSt and POSt, namely SAL and COB, respectively, are associated with lower visceral adiposity. This finding is crucial as visceral adiposity is associated with various diseases, including CVD, insulin resistance, hypertension and overall mortality( Reference Emery, Schmid and Kahn 29 ). Hence, shea butter and mango fat, which contain comparable major TAG species, are expected to exert similar favourable health effects( Reference Gunstone, Harwood, Gunstone, Harwood and Dijkstra 24 ).
The observation reported in previous literature( Reference Timmers, de Vogel-van den Bosch and de Wit 4 ) that COB is better at preventing fat accretion than palm oil has been successfully elucidated in the present study. Besides this, in our previous work( Reference Gouk, Cheng and Mok 14 ), we observed that dietary oil containing high amounts of linoleic and linolenic acids at sn-1, 3 positions, such as soyabean oil, led to significantly higher fat deposition than the diet enriched with palm olein. With the relatively higher trend exhibited by MUFA and PUFA towards intestinal absorption, diets that contain low amounts of the above-mentioned fatty acids, especially at the sn-1, 3 positions, are expected to lead to a lower risk of body fat deposition. Therefore, we postulate that COB with StOSt and POSt as the major TAG species compared with various food products exhibits a lower tendency to cause obesity and visceral adiposity when compared with highly unsaturated oil products. In conclusion, the encouraging results of the present study may warrant further investigation in human subjects, as well as the synthesis of prospective healthier structured lipids, for instance, 1,3-dibehenoyl-2-oleoylglycerol and 1,3-dilignoceroyl-2-oleoylglycerol, which have the potential to reduce the prevalence of morbid obesity.
Supplementary material
To view supplementary material for this article, please visit http://dx.doi.org/10.1017/S0007114513003668
Acknowledgements
The present study was funded by the Malaysian Ministry of Higher Education (Fundamental Research Grant Scheme) and University of Malaya (Postgraduate Research Fund) through grants FP011/2010A and PV017/2011B, respectively. The Malaysian Ministry of Higher Education and University of Malaya had no role in the design and analysis of the study or in the writing of this article.
The authors' contributions are as follows: S.-W. G. carried out the hands-on experiments, namely the animal study, sample analyses and statistical analyses; S.-W. G. and S.-F. C. wrote the manuscript; A. S.-H. O. and C.-H. C. read and approved the final version. All the authors were responsible for the design and execution of the study.
None of the authors has any conflicts of interest to declare.


