


Studies conducted in the 1950s suggested that α-retinol (αR) (Fig. 1) is a biologically inactive form of vitamin A, with approximately 2 % biopotency being reported by comparing the results obtained in the rat growth and liver storage bioassays of the geometric isomers of vitamin A aldehyde with the US Pharmacopeia Vitamin A Reference Standard( Reference Ames, Swanson and Harris 1 ). Another study reported 2·6 % bioactivity( Reference Goodman, Smith and Hembry 2 ), and Sneider et al. ( Reference Sneider, Rosso and Rogers 3 ) confirmed the lack of bioactivity, but suggested that αR has partial vitamin A function. On more than one occasion, αR's lack of bioactivity was eloquently discussed by Pitt( Reference Pitt 4 – Reference Pitt 6 ). In 1969, it was concluded that αR had only 2·1 % of the activity of retinol (ROH) when assayed for growth-promoting activity in rats( Reference Pitt 6 ). αR has been shown to be very effective at inducing signs of hypervitaminosis A in both in vitro and in vivo models( Reference Houghton 7 ). On the other hand, Shantz & Brinkman( Reference Shantz and Brinkman 8 ) demonstrated that 3,4-didehydroretinol (DR; vitamin A2), which is the predominant form of vitamin A in some freshwater fish, has 40 % biological activity compared with ROH (vitamin A1). Methods to quantify and selectively determine analogue concentrations in tissues were not available when these studies were carried out. A more recent study has quantified αR using HPLC after α-carotene dosing in gerbils and found significant liver αR storage( Reference Tanumihardjo and Howe 9 ). Therefore, it was hypothesised that αR could be used as a chylomicron tag as it appeared to be sequestered in the liver.
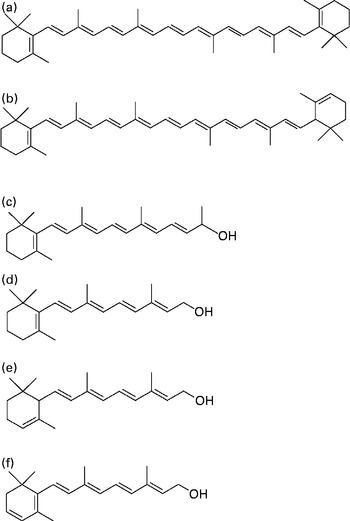
Fig. 1 Chemical structures of (a) β-carotene, (b) α-carotene, (c) C23 alcohol (internal standard; β-apo-carotenol), (d) retinol, (e) α-retinol and (f) 3,4-didehydroretinol.
The difference between the biological activity of αR and that of DR can be partially explained by the inability of αR compared with the ability of DR to bind to the retinol-binding protein (RBP), the specific carrier protein of ROH. RBP is synthesised by hepatic parenchymal cells as a 24 kDa precursor, which is then converted to the RBP by the co-translational removal of a 3·5 kDa polypeptide( Reference Combs 10 ). This protein product is called apo-RBP and holo-RBP when complexed with ROH or an analogue( Reference Mills, Furr and Tanumihardjo 11 ). Moreover, DR is carried by the retinol transporter from the intestine at the same rate as ROH( Reference Dew and Ong 12 ). In 1975, Muhilal & Glover( Reference Muhilal and Glover 13 ) tested the binding affinity of ROH and its analogues to the RBP. Unlike ROH, αR failed to bind in vitro with apo-RBP, but DR did bind at a slower saturation time than ROH did. As a result, they suggested that the fission of the ring as in γ-retinol or changing the double bond from the 5,6-position (in β-retinol) to the 4,5-position as in αR prevents the compound from binding to the RBP.
These discoveries are consistent with the findings of a study carried out by Tanumihardjo & Howe( Reference Tanumihardjo and Howe 9 ), who found that αR is not present in the serum of gerbils fed α-carotene, even though abundant amounts are present in the liver. Liver αR concentration was found to be very similar to the difference in liver ROH concentrations of the α-carotene and control groups, consistent with the central cleavage of α-carotene in the intestinal brush border. In addition, α-carotene may have a negative effect on the absorption of β-carotene in rats( Reference Furusho, Kataoka and Yasuhara 14 ). In rats fed a mixture of α-carotene and β-carotene (1:2), liver ROH stores have been shown to be decreased compared with those fed β-carotene alone( Reference Furusho, Kataoka and Yasuhara 14 ). This suggests a potential interaction or competition between αR and ROH, but the degree and site of interaction have not been clearly defined.
In the present study, we carried out three studies in rats. In study 1, we determined the biopotency of αR and DR compared with that of ROH in a controlled experiment where liver reserves could be accurately quantified with HPLC and ROH fed at a concentration known to keep rats in vitamin A balance, i.e. 50 nmol/d( Reference Green and Green 15 ). In study 2, we investigated the influence of αR on liver ROH storage during graded feeding of αR to the rats while equalising the amounts of ROH across the treatment groups at a level higher than that used in study 1 to allow for some ROH storage. Therefore, the overall influence of physiologically graded doses of αR on the uptake and storage of ROH could be determined. In study 3, we determined the accumulation and disappearance of αR over time and potential liver pathology by feeding large doses of αR to the rats.
Materials and methods
Syntheses of α-retinyl acetate and 3,4-didehydroretinyl acetate
α-Retinyl acetate was synthesised using a previously described method for the synthesis of [13C]retinyl acetate( Reference Tanumihardjo 16 ), except that α-ionone (Sigma Aldrich) was substituted with β-ionone as the starting reagent and 13C was not added. 3,4-Didehydroretinyl acetate was synthesised using previously published methods( Reference Tanumihardjo, Barua and Olson 17 ) and stored at − 70 °C until use. The synthesised acetate esters were purified (>95 %) on 8 % water-deactivated neutral Al2O3 using hexanes and diethyl ether. The purity of both the compounds was confirmed by TLC, UV–visible spectrophotometry and HPLC equipped with photodiode array detection.
Animals and diet
Animal use was approved by the University of Wisconsin (UW)-Madison Animal Care and Use Committee, and all animal procedures were carried out by adhering to the Public Health Service Policy on Humane Care and Use of Laboratory Animals. The facilities of the UW College of Agriculture and Life Sciences are AAALAC (Association for Assessment and Accreditation of Laboratory Animal Care) accredited and frequently inspected internally and externally to ensure compliance. The rats (n 98) were housed individually on aspen bedding in a temperature- and humidity-controlled environment under a 12 h light–12 h dark cycle. Shaven aspen wood was chosen as bedding as it absorbs moisture, eliminates odour and has low nutritional value. Maize cobs, which are another option, would have interfered with this bioassay due to kernel contamination. Upon arrival to the laboratory, the rats were fed a vitamin A-free purified diet ad libitum ( Reference Escaron, Green and Tanumihardjo 18 ). The vitamin A-deficient diet (TD 04 175; Harlan-Teklad) contained the following (in g/kg diet): casein (200); dl-methionine (3); sucrose (280); maize starch (215); maltodextrin (150); cellulose (50); soyabean oil (55); mineral mix AIN-93G TD 94 046 (35); calcium phosphate (3·2); vitamin mix without added A, D, E and choline TD 83 171 (5); vitamin D3 (0·0044); vitamin E (0·242); choline dihydrogen citrate (3·5); tert-butylhydroquinone (TBHQ) (0·01).
Study 1
Rats were chosen for this study because they are a defined model for growth assays and could quickly be made vitamin A deficient as they are born with low stores. For the biopotency study, 21-d-old weanling male Sprague–Dawley rats (n 40) (Charles River) were fed a vitamin A-deficient diet and weighed daily for the duration of the study. At the beginning of week 9, the rats were divided into four weight-matched treatment groups (n 10/group) and orally dosed with 50 nmol retinyl acetate (14·3 μg ROH), α-retinyl acetate (14·3 μg αR), 3,4-didehydroretinyl acetate (14·2 μg DR) or plain cottonseed oil vehicle (negative control group). All the doses were administered in 100 μl cottonseed oil. This dose (50 nmol) was chosen because it maintains vitamin A balance in male rats( Reference Green and Green 15 , Reference Adams and Green 19 , Reference Kelley and Green 20 ). The daily dosing regimen was continued until most of the rats in the control group had abnormal secretions around the eyes and 20 % of these were showing severe signs of vitamin A deficiency (i.e. scruffy coat and swollen ankles). All the rats were killed 5 weeks after the start of supplemental dosing, and tissue samples were collected. Aliquots of serum and weighed samples of liver, kidney, spleen and lung were analysed for ROH, αR and DR by HPLC.
Serum analyses
Serum was analysed using a published procedure( Reference Tanumihardjo and Howe 9 ) with a slight modification. The internal standard C23 alcohol, a synthesised β-apo-carotenol( Reference Tanumihardjo and Howe 9 ) (Fig. 1), was added to 500 μl serum, and an equal volume of ethanol with 0·1 % butylated hydroxytoluene was added to the sample. The sample was extracted three times with 1 ml hexane. Supernatant fractions were pooled and dried under Ar. The extract was reconstituted in 100 μl methanol–dichloroethane (50:50, v/v), and 50 μl were injected into the HPLC system. The isocratic HPLC system included a guard column, a Waters Symmetry® C18 column (3·5 μm, 4·6 × 75 mm), a Waters ResolveTM C18 column (5 μm, 3·9 × 300 mm), a Rheodyne injector, a Shimadzu SPD-10A UV–VIS detector, a Waters Delta 600 pump and controller, and a Shimadzu C-R7A Plus data processor. The mobile phase was acetonitrile–water (87·5:12·5, v/v) with 10 mm-ammonium acetate as a modifier at a flow rate of 0·7 ml/min.
Rat tissue analysis
Liver, kidney, lung and spleen samples were analysed using published methods( Reference Tanumihardjo and Howe 9 , Reference Escaron, Green and Tanumihardjo 18 , Reference Sun, Surles and Tanumihardjo 21 ) with a minor modification. Tissue samples (0·5 g) were ground with sodium sulphate (1·5 g) in a mortar. Purified C23 alcohol was added to determine the extraction efficiency. The tissue samples were extracted repeatedly with dichloromethane to 10 ml; 5 ml were dried under Ar. The film was redissolved in 0·75 ml ethanol and saponified with 0·4 ml potassium hydroxide–water (50:50, w/v) at 45°C for 30 min. The reaction was quenched with 0·5 ml water. The solution was extracted three times with 0·5 ml hexane. The hexane layers were pooled, washed with 0·5 ml water and dried under Ar. The film was redissolved in 100 μl methanol–dichloroethane (50:50, v/v) for the liver samples and 200 μl for the kidney, lung and spleen samples. An aliquot of 50 μl was injected into the HPLC system for the liver samples and that of 25 μl for the other tissue samples. The Waters HPLC system included the columns described above and a Waters 1525 binary HPLC pump, a 717 autosampler and a 996 photodiode array detector. The mobile phase was the same as that mentioned above, but the flow rate was 0·8 ml/min. The results obtained for tissue vitamin A are reported as those for ‘retinol’, which included retinol and retinyl esters because tissues were saponified.
Study 2
For the interaction study, 21-d-old weanling male Sprague–Dawley rats (n 40) were fed a vitamin A-deficient diet for 2 weeks. The rats were divided into four treatment groups (n 10/group). To allow for some liver ROH storage, in this study, a dose of ROH higher than that used in study 1 was used (i.e. 70 nmol as retinyl acetate), which has resulted in adequate liver reserves over time in prior studies( Reference Escaron, Green and Tanumihardjo 18 , Reference Tanumihardjo 22 ). Each group was orally dosed with 70 nmol ROH/d and 0, 17·5, 35 or 70 nmol αR (as α-retinyl acetate) daily. Doses were administered in 100 μl cottonseed oil. All the rats were killed 3 weeks after the start of dosing, and tissues were collected. Serum and liver samples were analysed using the procedures used in study 1.
Study 3
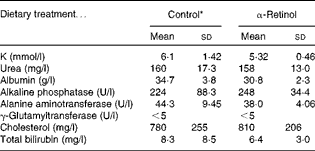
For the toxicity study, 21-d-old weanling male Sprague–Dawley rats (n 18) were vitamin A-depleted for 3 weeks and then given 3·5 μmol α-retinyl acetate/d dissolved in cottonseed oil or cottonseed oil alone (control) for 21 d. The rats (n 5) were killed on days 1, 8 and 15 after the administration of the final dose. The control rats (n 3) were killed on day 1. Serum, liver and kidney samples were collected at each time point. Serum samples collected from both the control and αR groups were analysed for biochemical indicators of liver toxicity, which included K, urea, albumin, alkaline phosphatase, alanine aminotransferase, γ-glutamyltransferase, cholesterol and total bilirubin from a routine chemistry panel. Histological sections of livers were analysed using haematoxylin and eosin stain by the UW School of Medicine and Public Health. Serum analyses were carried out by the UW Veterinary Medical Teaching Hospital Pathology Services.
Statistical analysis
Animal data were analysed using the Statistical Analysis System software (SAS Institute, Inc., version 9.1, 2002-3). The outcomes of interest (i.e. rat weights and serum and tissue ROH, αR and DR concentrations) were evaluated using ANOVA. A test of effect slices was used to determine the day the body weights were different among the groups. The AUC values for body-weight change were calculated by trapezoidal approximation. Values are presented as means and standard deviations. Significance was assessed at α < 0·05.
Results
Study 1
Body weights and weight changes
After the start of dosing, group differences in body weight approached significance (P= 0·054), and the day main effect and the group × day interaction were significant (both P< 0·0001). Using a test of effect sizes for group and day, the difference among the groups was found on day 19, and this was observed until the end of the dosing period (Fig. 2). The final body weights did not differ between the ROH and DR groups, but were lower in the αR and control groups. Interestingly, liver weights were the same in the ROH (19·1 (sd 2·1) g) and DR (20·0 (sd 2·5) g) groups, but were higher than those in the αR (14·6 (sd 1·5) g) and control (13·3 (sd 1·6) g) groups, which did not differ from each other. Kidney weights were highest in the ROH group (3·44 (sd 0·28) g), which differed from the control (3·07 (sd 0·17) g) and DR (3·06 (sd 0·49) g) groups but did not differ from the αR group (3·32 (sd 0·4) g). Kidney weights did not differ among the αR, DR and control groups.
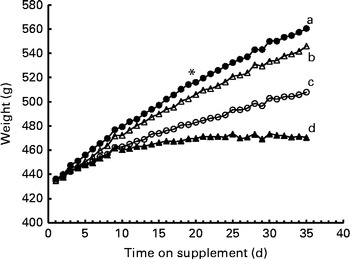
Fig. 2 Growth assay in groups of rats (n 10/group) dosed with 50 nmol/d of α-retinol (○), 3,4-didehydroretinol (●) or retinol (Δ) compared with a negative control (▲, oil) group. Using a test of effect sizes, body weights were found to differ on day 19 after the start of supplementation (denoted by *). The AUC values for growth response differed between the groups. a,b,c,dValues with unlike letters were significantly different (P< 0·05).
Organ retinol concentrations
All the rats in study 1 were severely vitamin A deficient (defined as < 70 nmol ROH/g liver)( Reference Adams and Green 19 ). Despite adequate serum ROH concentrations in the ROH group (1·37 (sd 0·21) μmol/l), liver reserves were fourteen times less than this deficiency cut-off (Table 1; Fig. 3), and the kidney had seven times more ROH than the liver. In fact, in all the treatment groups, kidney ROH concentrations were higher than liver ROH concentrations by five to ten times. Although the same amounts of treatment compounds were fed to the rats, more ROH was stored in the ROH group compared with DR and αR in the DR and αR groups, respectively. ROH was not detected in the lung and spleen of the control, DR and αR groups, which supports the findings of prior work( Reference Sun, Surles and Tanumihardjo 21 , Reference Ross and Li 23 ). DR was detected only in the tissue samples of the DR group that were analysed and αR was detected only in those of the αR group.
Table 1 Concentrations of retinol (ROH), 3,4-didehydroretinol (DR) and α-retinol (αR) in rat liver, kidney, lung, spleen and serum after equimolar oral dosing (50 nmol) for 5 weeks (Mean values and standard deviations, n 10)
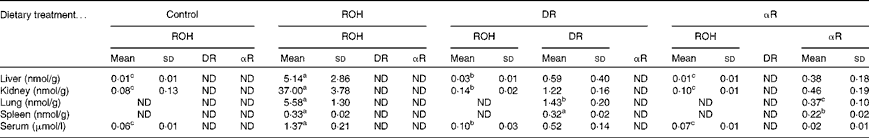
ND, not detected.
a,b,cMean values within a row with unlike superscript letters were significantly different (P< 0·05) between the treatment groups. Comparisons are either for retinol concentrations only (i.e. liver, kidney and serum) or between the test compounds (i.e. lung and spleen).
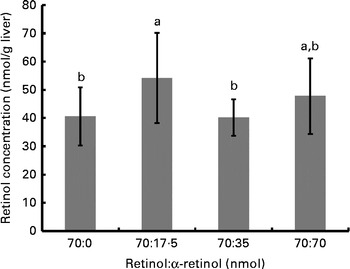
Fig. 3 Liver retinol concentrations for each group of rats (n 10/group) supplemented with different ratios of α-retinol:retinol. Each group was orally dosed with 70 nmol retinol/d (as retinyl acetate) and 0, 17·5, 35 or 70 nmol α-retinol (as α-retinyl acetate). a,bValues with unlike letters were significantly different (P< 0·05).
Much lower concentrations of DR and αR were detected in the liver, kidney, spleen and lung of the DR and αR groups, respectively, compared with ROH concentrations in the ROH group, suggesting an increased utilisation or impaired uptake of these analogues (Table 1).
Serum concentrations
The rats in the ROH group were able to maintain an adequate serum ROH concentration (1·37 (sd 0·21) μmol/l) when fed 50 nmol/d. Serum ROH was detectable but deficient (<0·10 μmol/l) in the control, DR and αR groups. Serum ROH concentrations were slightly higher in the DR group than in the control and αR groups (P< 0·05), which may indicate a sparing effect, considering that the serum DR concentration was high (0·52 (sd 0·14) μmol/l). Serum αR concentrations were measurable but low in the αR group.
Bioactivity
In the classic growth assay, the αR group maintained about 50 % of the growth rate of the ROH group and the DR group maintained >100 % of that of the ROH group (Table 2). Bioactivity was calculated by two methods. In the first, a simple comparison of the final body weights of the control and ROH groups was made. In the second, AUC values were computed, and the values of the control group were subtracted from those of the treatment groups, and these values were compared with those of the ROH group to obtain a percentage difference. The AUC values of all the groups differed (Table 2). Similar values for bioactivity (i.e. within 8–12 %) were obtained using both the mathematical methods (Table 2).
Table 2 Comparison of bioactivities of α-retinol (αR) and 3,4-didehydroretinol (DR) with that of retinol (ROH)* (Mean values and standard deviations, differences and percentages, n 10)
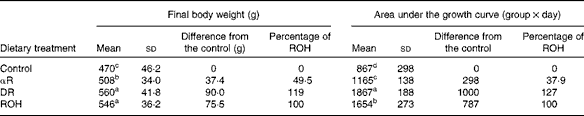
a,b,c,dMean values within a column with unlike superscript letters were significantly different (P< 0·05) between the treatment groups.
* Rats were fed 50 nmol/d of the test compounds for 5 weeks. Body weights were measured daily.
Study 2
The final body weights of rats in study 2 (345·1 (sd 20·4) g) did not differ among the groups and nor did the liver weights (16·2 (sd 1·6) g). Despite adequate serum ROH concentrations (1·21 (sd 0·07) μmol/l), which did not differ among the groups, αR was undetectable. On the other hand, liver ROH concentrations did differ among the groups (P= 0·042); although when corrected for total liver weight, only the difference in total liver ROH concentrations approached significance (P= 0·07). Liver ROH concentrations were highest in the group that received the lowest dose of αR, which did not differ from the group that received the highest dose. As anticipated, liver αR concentrations responded in a dose-dependent manner (i.e. 262 (sd 34), 449 (sd 23) and 893 (sd 138) nmol/liver for the 17·5, 35 and 70 nmol/d doses, respectively; P< 0·0001). These represent total dose liver retentions of 71·3, 61·1 and 60·7 %, respectively.
Study 3
No toxicity was evident in the αR group compared with the control group after 21 d. No stellate cell hypertrophy (Fig. 4) or increases in serum markers of liver toxicity were detected (Table 3). Liver and kidney αR concentrations decreased quickly between day 1 and day 8, but did not change on day 15 (Table 4).
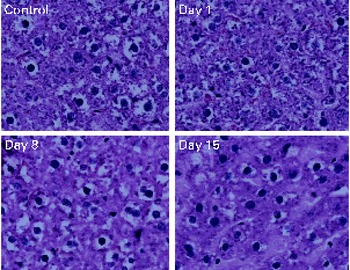
Fig. 4 Haematoxylin and eosin staining of liver sections. No hepatotoxicity was observed with 21 d of α-retinyl acetate dosing (3·5 μmol/d). The rats were killed 1, 8 and 15 d after the administration of the last dose.
Table 3 Comparison of serum chemistry profile of rats dosed with 3·5 μmol α-retinyl acetate/d (n 5) with that of rats dosed with cottonseed oil alone (control, n 3) for 21 d (Mean values and standard deviations)
* Serum was collected 1 d after the administration of the final dose.
Table 4 Total retinol (ROH) and α-retinol (αR) concentrations in rat liver, kidney and serum after dosing with 3·5 μmol α-retinyl acetate/d for 21 d*
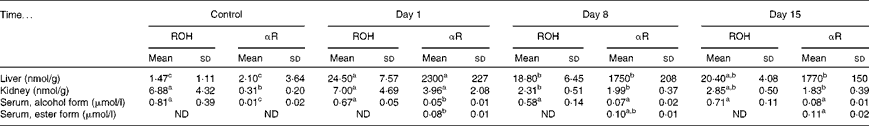
ND, not detected.
a,b,cMean values within a column with unlike superscript letters were significantly different (P< 0·05).
* All the groups were fed a vitamin A-deficient diet for 3 weeks. The rats were killed on days 1, 8 and 15 after the administration of the final dose. The control rats were given cottonseed oil alone. n 5 for the treatment group rats on days 1, 8 and 15 and n 3 for the control group.
Discussion
In the 1950s, the estimates of bioactivity for αR and DR in rats were 2 and 40 % that for ROH, respectively. Bioactivities of 40–50 and 120–130 % were demonstrated for αR and DR, respectively, in the same animal model using an equimolar feeding approach. Large doses of αR were given in prior studies; therefore, sustained chylomicron delivery from repeated dosing to replenish the tissues with small amounts did not occur. Thus, most of the dose was shunted to the liver and not recirculated to meet tissue needs because of the inability of αR to bind to the RBP. The data reported herein on αR are consistent with the finding reported by Clamon et al. ( Reference Clamon, Sporn and Smith 24 ) that α-retinyl acetate sustains the growth of hamsters when given intraperitoneally. In prior studies with DR, the preparation was isolated from crude fish liver oil and a distilled fraction in oil was fed to the rats( Reference Jensen, Shantz and Embree 25 ). Therefore, it is difficult to discern exactly how much 3,4-didehydroretinyl ester was fed during that 28 d study, because only the amount of oil fed was measured and reported. The preparations used in the present study were chemically synthesised and carefully purified, and an accurately measured amount equalised to retinyl acetate amounts known to maintain balance in rats was fed each day.
Quadro et al. ( Reference Quadro, Blaner and Salchow 26 ) have shown that RBP-knockout mice survive well and exhibit little evidence of vitamin A deficiency when fed a vitamin A-adequate diet. Presumably, their extrahepatic tissues obtain enough vitamin A from retinyl esters in lipoproteins to support growth and function. This explains why αR can support growth in rats despite its inability to bind to the RBP. αR can be transported to tissues via chylomicrons and their remnants. It can be utilised as a tag to traffic ROH, but it can be distinguished from ROH that arrives to tissues through the RBP. This concept has recently been applied to a lactating sow-nursing piglet dyad where αR was followed from the mother to the offspring( Reference Dever, Surles and Davis 27 ). Retinol trafficking could be studied during pregnancy with αR and without the use of RBP-deficient animals( Reference Quadro, Hamberger and Gottesman 28 ).
The growth effects of vitamin A are mediated by retinoic acid via retinoic acid nuclear receptor( Reference De Lera, Bourguet and Altucci 29 ), which may indicate that the growth effect of αR is functioning by the same mechanism. The apparent conclusion is that the analogues are oxidised to carboxylic acid analogues and that they bind to retinoid nuclear receptor proteins. This phenomenon might have implications for pharmaceutical or cosmetic applications. Due to the limited knowledge of the role of α-retinoic acid in growth promotion, a future study to determine the interaction of α-retinoic acid with retinoic acid nuclear receptor or perhaps retinoid X receptor( Reference De Lera, Bourguet and Altucci 29 ) is certainly important. 3,4-Didehydroretinoic acid is a known ligand of retinoic acid nuclear receptor-α, -β and -γ with the same affinity as retinoic acid( Reference Sani, Venepally and Levin 30 ). 3,4-Didehydroretinoic acid supports avian growth and development, and binding assays for retinoic acid nuclear receptor-β have been found to be nearly identical for chick and mouse receptors( Reference Repa, Plum and Tadikonda 31 ). Furthermore, at high doses of 3,4-didehydroretinyl acetate and retinyl acetate given to dams, both have been found to cause terata in foetuses but not to the extent of retinoic acid alone( Reference Duitsman and Olson 32 ). These data support similar bioactivities. The finding of a higher growth AUC value for DR should be investigated with 3,4-didehydroretinoic acid compared with retinoic acid in a similarly designed rat study.
Furthermore, the difference between the present study and previous work may be partly due to changes in animal feeding and care since the 1950s. Currently, animal care facilities are often sterile or near-sterile environments behind barriers. Veterinary care and personal protective equipment are commonplace. Considering the severe degree of vitamin A deficiency in the growth assay study, even a mild infection among the rats would have certainly caused death in all the groups. The normal serum ROH concentrations in the ROH-treated rats, which were severely vitamin A deficient based on liver reserves, indicate that the rats were healthy and not suffering from infection, which elicits the acute-phase response reducing serum ROH concentrations( Reference Tanumihardjo 33 ). Moreover, diet formulations have improved over the past few decades and are more than adequate to meet nutritional requirements. Thus, co-nutrient depletion is not a confounder when a diet is designed to be single-nutrient deficient.
One of the notable improvements in the present study over those in the 1950s is that the treatment compounds were fed at equimolar amounts at a level known to keep rats (weight approximately 420 g) in vitamin A balance( Reference Green and Green 15 ). Although this level of ROH resulted in very little ROH storage, it maintained serum ROH concentrations. A disadvantage of the present study is that lower doses of DR and αR were not included. Future studies should investigate lower doses of each of these compounds for the maintenance of rat growth. At the end of the present study, the rats maintained on the various analogues were found to continue growing and, therefore, longer-term studies with lower doses may help to define the value of growth assays v. liver storage assays. Although the storage rates of the compounds were not equal and not included in the estimation of bioactivity reported herein, the severe ROH deficiency in the rats, even in the ROH group, supports a higher bioactivity than previously published for both DR and αR. Furthermore, extreme differences in the liver retention of αR were observed in studies 1, 2 and 3. In study 1, where ROH was not made available, only 0·3 % of the cumulative αR doses were recovered in the liver. This is in stark contrast with study 2, where 61–71 % of the cumulative doses were recovered, further supporting αR bioactivity. The huge decrease in αR concentrations between day 1 and day 8 in study 3 supports utilisation, considering that no ROH was administered during this study. Liver ROH concentrations observed in study 2 suggest that αR does not interfere with ROH in intestinal absorption and hepatic metabolism when fed at physiological levels. However, a sparing effect of ROH may have occurred at the low dose of αR (17·5 nmol/d), which could also be used for growth as shown in study 1.
A notable limitation of the present study is that vision testing was not carried out. Nonetheless, predictions from the literature indicate that the control and αR groups were probably night blind and 3,4-didehydroretinal probably replaced retinal in the rod cells at high serum DR concentrations. Indeed, rats maintained on DR exhibited normal retina integrity( Reference Howell, Thompson and Pitt 34 ). Furthermore, in human subjects fed a fish-oil concentrate, night vision acuity has been shown to shift in favour of red light probably due to 3,4-didehydroretinal (λmax approximately 400 nm) replacing retinal (λmax approximately 370 nm) in the retina( Reference Millard and McCann 35 ).
Significant serum ROH and DR concentrations were detected in rats dosed with retinyl acetate and 3,4-didehydroretinyl acetate, respectively, which is an indication of increased recycling considering low liver storage and comparatively higher concentrations in the kidney. On the other hand, only small amounts of αR were detected in the serum of α-retinyl acetate-dosed rats, supporting previous reports that αR cannot bind to the RBP( Reference Tanumihardjo and Howe 9 , Reference Muhilal and Glover 13 ). Serum DR concentrations in the DR group were 2·6 times less than serum ROH concentrations in the ROH group in study 1, but growth was maintained probably due to the sustained formation of 3,4-didehydroretinoic acid. Serum ROH concentrations drive the utilisation of ROH( Reference Kelley and Green 20 , Reference Green, Green and Lewis 36 ). It appears that the ROH rats maintained a high utilisation rate even though their liver ROH reserves were exhausted. Furthermore, identical serum ROH concentrations in rats given 50 nmol/d in study 1 and those given 70 nmol/d and no αR (data not shown) in study 2 indicate increased recycling by the kidney, given that liver concentrations in study 2 were 9·3 times higher than those in study 1.
The finding that αR did not appreciably affect ROH storage suggests that αR has little influence on ROH metabolism at physiological doses in ratios consistent with typical dietary intake, unlike the finding that α-carotene has a negative effect on β-carotene absorption in rats, which was measured by liver ROH storage( Reference Furusho, Kataoka and Yasuhara 14 ). If α-carotene had been fed to the rats in study 2, the bio potency of αR might have differed from that demonstrated in study 1. α-Carotene may affect β-carotene uptake earlier in the digestion process at the site of absorption or by competition at the carotenoid transporter on the apical surface of enterocytes( Reference During, Dawson and Harrison 37 ), chylomicron assembly, or competition for the 15,15-carotenoid mono-oxygenase cleavage enzyme.
Data on the bioactivity of αR reported herein could change the calculated vitamin A value of some foods, especially orange carrots, which contain substantial amounts of α-carotene. Currently, αR is not considered to have vitamin A activity, yet it clearly supports growth in rats and is not toxic at moderate intakes. During vitamin A deficiency, αR, presumably through the formation of α-retinoic acid as needed, most probably supports functions supported by retinoic acid. Thus, growth assays with α-retinoic acid and retinoic acid should be carried out to determine the difference in bioactivities. The results obtained in the toxicity study suggest that at very high liver αR concentrations, no hepatotoxicity occurs, but that αR is quickly cleared. Nonetheless, at αR concentrations >1·7 μmol/g liver, significant amounts of α-retinyl esters were found to be circulating in the blood (>10 % of total retinol), most probably on lipoproteins. Future studies should determine at what liver ROH concentration this begins to occur, because liver retinyl esters >10 % of total are considered a biomarker of excessive vitamin A status in humans( Reference Penniston and Tanumihardjo 38 ).
Acknowledgements
The authors thank Peter Crump, UW-Madison College of Agriculture and Life Sciences Statistical Consulting Service, for statistical analysis consultation. Part of this work was presented at the Experimental Biology Meeting in 2011, Washington, DC, USA.
The present study was supported by USDA NRI 2007-35 200-17 729, the International Atomic Energy Agency's Nobel Peace Prize Fellowship Program (N. R.) and NIH Grant T32-DK007665 (J. T. D.). The funders had no role in the design and analysis of the work or in the writing of this article.
The authors' contributions are as follows: N. R. conducted the research and serum and tissue analyses, provided input for statistical analysis and wrote the first draft of the paper; J. T. D. conducted study 3; S. A. T. designed the research, provided input for the statistical analysis and revised the paper.
The authors have no conflicts of interest to declare.


