


The habitual daily consumption of vegetables contributes towards a balanced and healthy diet, in line with UK government recommendations to eat five portions of fruit and vegetables (FV) per d(1). The five-a-day message is a practical compromise since research suggests that health benefits are observed in dietary intakes of up to ten FV per d(Reference Aune, Giovannucci and Boffetta2). In 2018, <18 % of UK children aged 5–15 years ate five portions of FV, with the average intake at three portions per d(3). Girls and younger children tend to have larger and more frequent intakes of vegetables than boys and older children(Reference Jones, Steer and Rogers4), and families with lower socio-economic status and low availability or accessibility to vegetables at home have been linked with reduced intake(Reference Rasmussen, Krølner and Klepp5). Additionally, children with eating traits such as high food enjoyment and low food neophobia have associated increased intakes of vegetables(Reference Jones, Steer and Rogers4), whereas children with fussy eating traits consume few vegetables(Reference Van Der Horst, Deming and Lesniauskas6). Low intakes of vegetables track consistently across children’s development(Reference Nicklaus and Remy7,Reference Ventura and Worobey8) .
For adolescents, many of the same reasons for not eating vegetables apply(Reference Pearson, Griffiths and Biddle9), as well as issues around image and gender identity(Reference Krølner, Rasmussen and Brug10). Furthermore, FV are more nutrient dense than other food groups, but less energy dense, leading to weaker feelings of perceived ‘fullness’ or satiation(Reference Krølner, Rasmussen and Brug10); therefore, higher energy-dense foods may be preferred to vegetables. Thus, for older children, social influences(Reference Pedersen, Grønhøj and Thøgersen11) and energy density of vegetables may add to explanations of low vegetable intake.
Research on the environmental context of eating suggests that vegetables are most often eaten as part of a composite meal(Reference O’Brien, Kiely and Galvin12) and that this vegetable consumption at home during family mealtimes is associated with improved dietary quality(Reference Gillman, Rifas-Shiman and Frazier13). At mealtimes, children are often served the same foods as the rest of the family(Reference Sweetman, McGowan and Croker14) and parents have the opportunity to model intake, which is positively associated with child and adolescent vegetable intake(Reference Pearson, Biddle and Gorely15). Furthermore, since fewer vegetables are eaten than recommended, making changes to serving sizes at mealtimes has long been a strategy to change intake for FV. Research that has increased vegetable serving sizes within a meal demonstrates increased intake of vegetables in children(Reference Spill, Birch and Roe16,Reference Miller, Reicks and Redden17) , though this method can also produce increased plate waste. Additionally, overall vegetable intake may be stimulated by variety. Offering a variety of vegetables has been shown to increase consumption(Reference Roe, Meengs and Birch18), but this is mitigated by the presence of other food items(Reference Miller, Reicks and Redden17,Reference Carstairs, Caton and Blundell-Birtill19) .
Little is also known about the relationship between the environmental context, portion sizes and other foods present at separate eating occasions (EO) on children’s habitual daily intake of vegetables. This has been investigated for palatable, high-energy density food items(Reference Blundell-Birtill and Hetherington20), showing that age, time of day and context (television on, at home, out of home) were important determinants of portion size in children and adolescents; however, these relationships have not been determined for vegetables. Therefore, the present study investigated predictors of vegetable intake based on environmental context, time of day and the types of foods that vegetables are eaten alongside. Vegetable consumption is examined without fruits in order to identify differences in intakes and eating contexts compared with previous research examining both food groups together. It is important to examine vegetables separately as vegetables are often rejected or not eaten by children(Reference Cooke, Wardle and Gibson21,Reference Kim, Moore and Galuska22) despite having potentially greater health benefits than fruit(Reference Aune, Giovannucci and Boffetta2,Reference Nguyen, Bauman and Gale23–Reference Yang, Zhang and Feng25) . Therefore, examination of vegetables alone may provide more specific insights to children’s eating habits compared with FV when examined together. This study examined characteristics that predict vegetable intake in children and adolescents aged 1·5–18 years, by conducting secondary analysis of data on the UK National Diet and Nutrition Survey (NDNS). This is a nationally representative sample of 4-d food diaries collected between 2008 and 2017. We examined whether daily intake of vegetables could be predicted by demographic variables, if the environmental context of an EO influenced whether, and how much, vegetables were eaten, and which food groups predict the presence (or absence) of vegetables being eaten in an EO.
Methods
Sample
Secondary data analysis was conducted utilising years 1–9 of the UK NDNS(26) collected between 2008 and 2017. The NDNS is a rolling cross-sectional survey that runs continuously throughout the year to collect detailed information on food consumption and nutritional intakes of the UK population. The survey aims to include about 1000 participants total each year from England, Scotland, Wales and Northern Ireland, with an equal split of 500 children (1·5–18 years) and adults (19+ years). Due to some households containing only adults, at many addresses, only a child participates in order to boost the number of children in the sample to match that of the number of adults. The sample is drawn from the postcode address file of all private households in the UK. Full details of the NDNS design and sampling procedure are reported elsewhere(26).
Data collection for the NDNS is composed of interviewer visits and a nurse visit. During interviewer visits, data are collected from face-to-face interviews, self-completion questionnaires, a 4-d food diary and height and weight measurements. This is followed by a nurse visit which involves taking physical observations and blood samples of the participant, as well as detailed information regarding medication and dietary supplements taken. Field work is conducted throughout the year, to ensure an even representation of months and days of the week. Therefore, the data include potential seasonal variations in food intake, as well as differential intakes during the week compared with weekends. The current analysis considers only data from the interviewer stage of the survey and includes only the subsample of children aged younger than 19 years (n 6548, female = 3197). Full participant characteristics are reported in Table 1.
Table 1. Participant characteristics
(Numbers and percentages; mean values and standard deviations)

Dietary data
During the interviewer phase, the NDNS collects a 4-d estimated food diary to observe dietary habits. Participants are asked to write down everything that they eat and drink over this period, along with the time, who they are with and where they are. Children aged 13 years and older can complete their own diary; however, for children 12 years and under, a parent/carer is requested to complete the diary. The diary is completed at the time of eating rather than from memory, and records should indicate how much food was consumed (not amount served or including leftovers). To assist with amounts of each food eaten, participants are asked to describe food consumption in terms of weight (g) or household measures (e.g. tablespoons, teaspoons, cups, slices, etc.). When reviewing the diary, children are additionally asked to select pictures of portion sizes served and amount of leftovers using the Young Person’s Food Atlas(Reference Foster, Hawkins and Barton27), to complement reported portion size data. To further supplement food data, participants are instructed to keep food packaging and labels with weights and nutrient information for each food. To ensure compliance with this procedure and to allow the participant to ask questions, the interviewer conducts a mid-diary visit, before returning at the end of the 4 d to collect and review the diary. Only children that completed three or four diary days were included in the survey (3 d n 121, 1·85 %, 4 d n 6426, 98·13 %).
Diaries were coded by trained coders and editors from the NDNS research team, and all food intakes were entered into a modified Diet in Nutrient out(Reference Fitt, Cole and Ziauddeen28) assessment system. Each food was given the corresponding food code and portion code from the NDNS nutrient databank. For composite recipes, each food component was assigned a food code. If portion sizes were reported as a weight, this was directly input into the Diet in Nutrient out. Alternatively, if the portion size was described as a household measure, the appropriate weight for each type of food given the measure was selected. Where foods were consumed at school, portion sizes and nutrient information were determined from data collected by school meal surveys.
For this study, all food data were selected from the full NDNS data set (years 1–9, n 6548). Beverages, sweeteners and supplements data were not included in analyses. This is because the NDNS reports sweeteners and supplements in terms of a base unit rather than grams and beverages impact on the overall weight and energy intake at each EO (e.g. water provides no energy content, whereas alcohol provides a large amount of energy). However, beverages were still included in the total energy intake per d for each individual. All other potion sizes of foods were given in grams, which were converted to energy intake by the NDNS research team.
Variables
For each participant, to create the outcome variables of interest, the mean number (absolute count) of vegetables eaten per d was derived from the food diaries. Similarly, the mean portion size (g) of vegetables that were eaten per d was also calculated. Each EO was coded for inclusion of vegetables, and the total portion size (g) of vegetables consumed in each EO was also calculated.
Within the NDNS data set, age in full years and sex were recorded for each participant, as well as the diary month and day number of the diary (1–4). Age was centred, but not scaled, to make parameter estimates easier to interpret. Age squared was also included in models to examine the non-linear fit of age. Participant’s ethnic group, whether they were vegetarian or vegan, BMI category and equivalised household income were also included. BMI was categorised within a range of weight categories from normal weight (including underweight), to having overweight and obesity. These categories utilise the BMI WHO cut-offs (85th/95th centile for 2–3-year-olds (inclusive) and UK90 for 4–18-year-olds. For the 435 children with missing BMI values, these were assigned as healthy weight. Z-score equivalised household income (a measure of household income that is derived from the size of the household and the relationships between the people within) was included; however, this was missing for 526 (8 %) participants. We assume that the data are missing at random because the chance of observing this variable (equivalised income) may depend on its value, as adults were asked about income during interview. Therefore, missing values were estimated using multiple imputation(Reference Rubin29). Demographic variables of adult employment status, number of children under 18 years, ethnic group and known equivalised income values were input into a classification and regression trees algorithm to impute the missing data.
To account for seasonal effects on vegetable consumption, the months of November, December and January were classed as ‘Winter’, February, March and April as ‘Spring’, May, June and July as ‘Summer’ and August, September and October as ‘Autumn’. Where the EO took place and who with were collapsed into fewer categories(Reference Blundell-Birtill and Hetherington20,Reference Ziauddeen, Almiron-Roig and Penney30) . Places were categorised as ‘at home’ for any location within the home, ‘at school or work’ included all locations at school (as well as locations in the workplace for some older children in the sample), ‘food outlet’ including restaurants, cafeterias and any place that food can be brought outside of the home, ‘on the go’ for foods that were consumed outside, on the street or in transportation, ‘leisure’ including leisure centres and leisure activities and all other places were categorised as ‘other’. Similarly, categories for who the individual was eating with were reduced to eating ‘alone’, ‘with parents only’, ‘with children only’, ‘with friends only’ and ‘with multiple groups-family and friends’ and all other EO were categorised as ‘other’. Lastly, food group categories were compressed to those representing mainly ‘vegetables’, ‘fruit’, ‘carbohydrates’ (including rice, pasta, bread, cereal, etc.), ‘protein’ (meat, fish, eggs and nuts and seeds), ‘dairy products’ (not including milk as this was categorised as a beverage) and ‘fats, sugar and salt (FSS)’ (including foods such as puddings, pastries, sweets, biscuits, chocolate, crisps and savoury items). These food groups were guided by those described in the UK Eatwell guide(31). Fats and oils, mainly including butter and cooking oils, were not used in any analyses.
Data analysis
NDNS data sets for years 1–4 (2008/2009–2011/2012), years 5–6 (2011/2012–2013/2014), years 7–8 (2014/2015–2015/2016) and year 9 (2016/2017) were combined. These data sets were weighted to adjust for differential selection probabilities, differences in sample selection between years and non-response to certain NDNS procedures. Weights were calculated for all children (18 years and under) in the sample using NDNS instructions(26), and these weights were incorporated into all analyses. Individual weights for each data collection period (i.e. years 1–4, 5–6, 7–8 and 9) were summed separately. Individual weights were then divided by the sum of weights for that data collection phase and multiplied by the sum of all phase weights. Finally, this was multiplied by the number of years in that phase/total number of survey years (e.g. years 1–4 would have been 4/9, as there were nine total years). We then checked that the sd = 1 and the mean = 0 of all weights combined.
EO that were within 15 min of each other, in the same place and with the same people, were combined into a single EO(Reference Blundell-Birtill and Hetherington20,Reference Ziauddeen, Almiron-Roig and Penney30) . For determining average daily absolute count and average daily consumption (g) of vegetables in the individual, data were analysed at the person level (n 6548) using linear models. Two multiple regression analyses were conducted predicting daily vegetable consumption in both counts and total portion size. Demographic variables including age, age2, sex, ethnicity, equivalised income, parental employment status and BMI category were used as predictors, along with vegetable variety index (number of different vegetables eaten across diary days), vegetarian or vegan status, season (winter, spring, summer and autumn), year of NDNS and number of children in the household were included in the model.
For analyses to determine the outcome of vegetable portion size consumed at a single EO, portion size of vegetables (g) was totalled for each EO. Data were analysed only for EO that included vegetables (n 25 059), using multilevel linear models. The intercepts were allowed to vary by participant. This analysis included the predictor variables age, sex, BMI category, weekday, location of meal, who with, time of day, daily energy intake (kcal) and vegetarian or vegan status, along with amounts (g) of each food group in the meal and interactions of each predictor with age.
Lastly, analyses were conducted to determine which food groups predict the presence of vegetables within an EO. Data were analysed using all EO, apart from those that only included vegetables (n 124 023), using multilevel logit models. Binary variables were created for whether the EO contained each food group type, and main effects and interaction terms for each food group were added to the model.
For all models, data were split into model building and test data sets (all 50:50 split) using different pseudo-random seeds for each analysis. All predictors that significantly added to the model in the model building phase were included in the model testing phase, whereas predictors that did not add to the model were left out of the testing phase. An α level of 0.01 was used to determine significant predictors. Only results of test data sets are reported here as the predictors all had significant main effects in the model building samples.
Data analyses were conducted using RStudio 1.1.383, with R (version 3.5.2, Eggshell Igloo), tidyverse 1.3.0, haven 2.2.0, lme4 1.1-21 and lmerTest 3.1-0.
Results
Across the 4-d food diaries, there were 307 205 food entries (after removing beverages, sweeteners and supplements), for 6547 children (one person did not consume any food, only beverages, during all days of the diary and therefore does not appear in any analyses). Of these, 6184 children consumed at least one vegetable 54 989 times. There were 116 vegetarians and five vegans in the sample. Food entries made up 124 436 unique EO, 25 059 of which included at least one vegetable. However, in only 413 EO were vegetables eaten alone, with 489 different counts of vegetables eaten. When vegetables were eaten on their own, raw carrot was the most popular (n 116), followed by raw cucumber (n 61) and raw tomatoes (n 44). Children consumed vegetables on average eight times over diary days (mean = 8·40, median = 7, sd = 7·01) with an average variety intake of 5–6 different types of vegetable (mean = 5·59, median = 5, sd = 3·79). A total of fifty-eight different types of cooked (count = 37 880) and forty-seven different types of raw (count = 17 109) vegetables were eaten by the participants. Table 2 presents the most commonly consumed vegetable types eaten both cooked and raw.
Table 2. Top ten most consumed cooked and raw vegetables over 4-d food diaries and their absolute counts for number of times eaten

Demographic predictors of vegetable intake
Individual intake of vegetables, average daily absolute counts and average daily weight (g) of vegetables consumed were examined. Regression analyses revealed that older children ate fewer absolute counts of vegetables per d; however, when they did eat vegetables, they had larger portions. Ethnicity also affected both amount and absolute counts of vegetables eaten, with white British children tending to eat fewer absolute counts of vegetables than Black and minority ethnic children, yet consuming a larger amount of these vegetables per d. Additionally, vegetarians and vegans (although small in number) ate more vegetables and had a higher intake than those classed as neither, and eating a wider variety of vegetable types in general increased both the count and gram intake of vegetables per d. Lastly, average daily energy intake suggests that children who consume more energy daily generally tend to eat larger amounts of vegetables per d, although this did not predict counts of vegetables eaten per d. Sex of the child, season (time of year), year of NDNS and number of children in the household did not significantly add to the model and neither did any interaction terms. Table 3 shows the model estimates for each predictor on vegetable intake for the individual. Fig. 1 displays the median amount of vegetables (g) that were eaten per d for each age group. This suggests that only one portion of vegetables is achieved by children per d.
Table 3. Parameters for linear models predicting average daily absolute counts of vegetables and average daily intake (g) of vegetables consumed
(Estimates and standard errors)
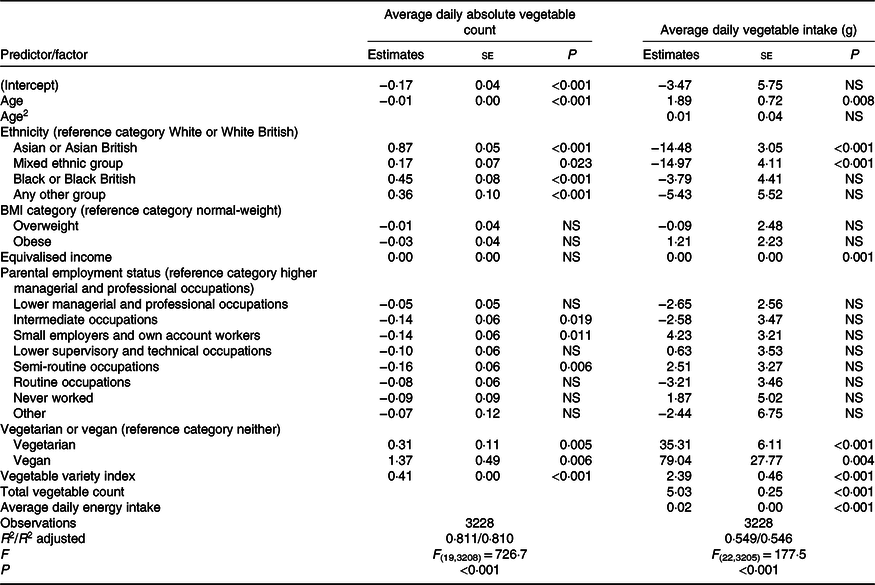
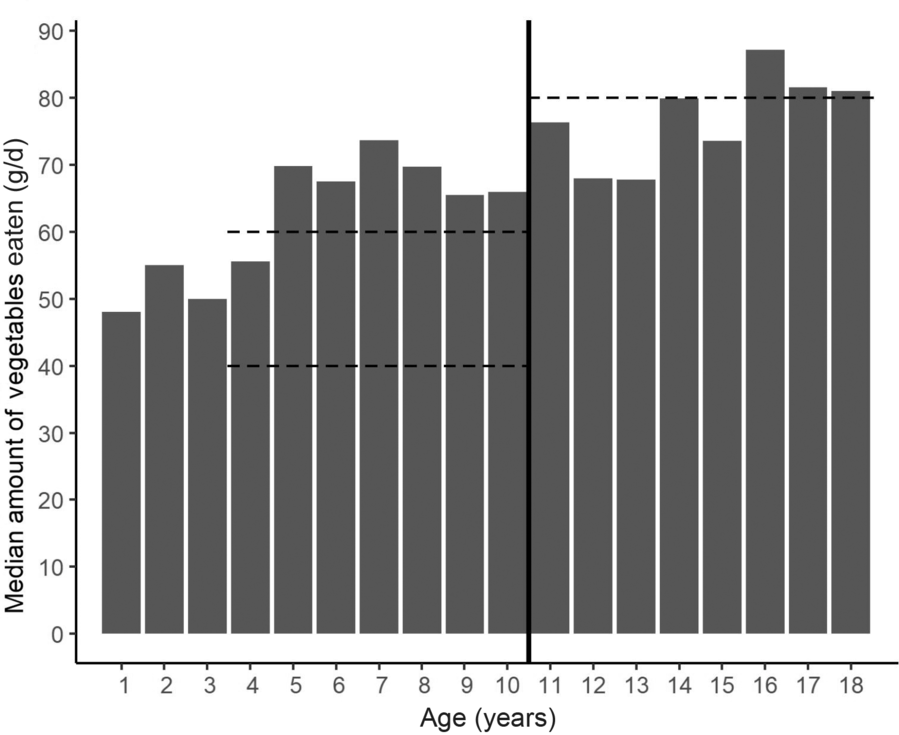
Fig. 1. Median amount of vegetables (g) eaten per d by age group. The vertical centre line divides 4- to 10-year-olds from 11- to 18-year-olds as government recommendations for vegetable portion sizes change from 40–60 g (4- to 10-year-olds) to 80 g for 11- to 18-year-olds indicated by the horizontal dashed lines.
Frequency of vegetable consumption
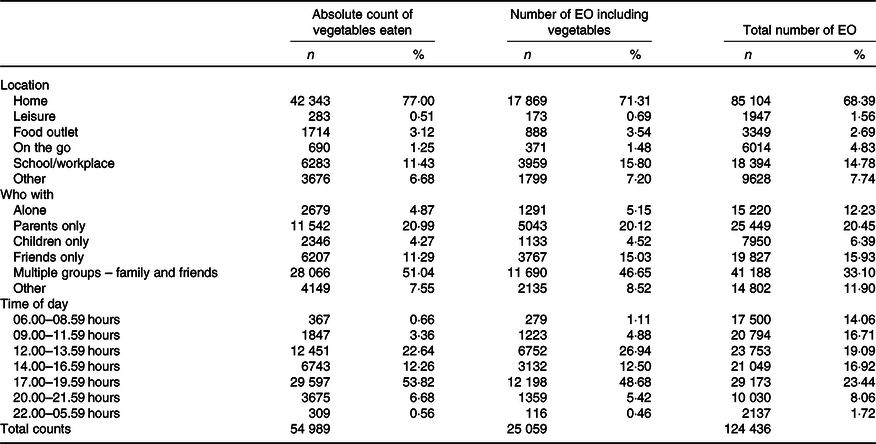
Table 4 reports the frequency (with percentage of total absolute counts) that vegetables were eaten by location, with whom eating occurred and time of day. It also reports the number of EO that included vegetables and the total number of EO for comparison. Vegetables were consumed mostly at home, with family members at typical dinner (17.00–20.00 hours) and lunch (12.00–14.00 hours) times. School (and workplace) was the location with the second highest intake of vegetables, although intake was far less frequent than that at home. Vegetables were generally not eaten on the go, at food outlets or at places of leisure. Children also ate fewer vegetables when eating alone or with other children and at times of the day not associated with lunch and dinner. However, there was a small peak in eating vegetables between 14.00 and 17.00 hours, in the transition period between typical lunch and dinner times.
Table 4. Total number of absolute counts and total eating occasions (EO) (and percentage of the total) that vegetables were consumed by location, who the child was eating with and time of day
(Numbers and percentages)
Predictors of portion size (g) of consumed vegetables
To examine if environmental features influenced portion sizes of vegetables (g) at each EO, predictors were entered into a linear multilevel model as fixed factors, with the individual as a random factor. The model shows that the average portion size of vegetables (when they are eaten) is 40 g. It is demonstrated that larger portion sizes of vegetables are eaten as the child becomes older, when vegetables are eaten at home and at the weekend. Total vegetable portion sizes are 20–40 g smaller outside of the home depending on location, even at school. Children ate larger portions of vegetables at typical evening meal times between 17.00 and 20.00 hours, and vegetable portions were also slightly larger if the child ate a wider variety of vegetables over the NDNS diary period. Interactions between age and location, age and with whom vegetables were eaten as well as age and time of day all significantly improved the model and so were retained in the final model. Sex and BMI category did not add to the model to predict vegetable portion sizes. Overall, 82 % of the variance explained by the model is due to within-person variation, suggesting that vegetable portion sizes vary little between children, but vary to a larger degree within an individual based on the context of the eating situation. The final model with all predictors and interactions is presented in Table 5.
Table 5. Results of ANOVA by Satterthwaite’s method, and parameters from multilevel modelling for portion sizes of vegetables
(Estimates and standard errors; confidence intervals)
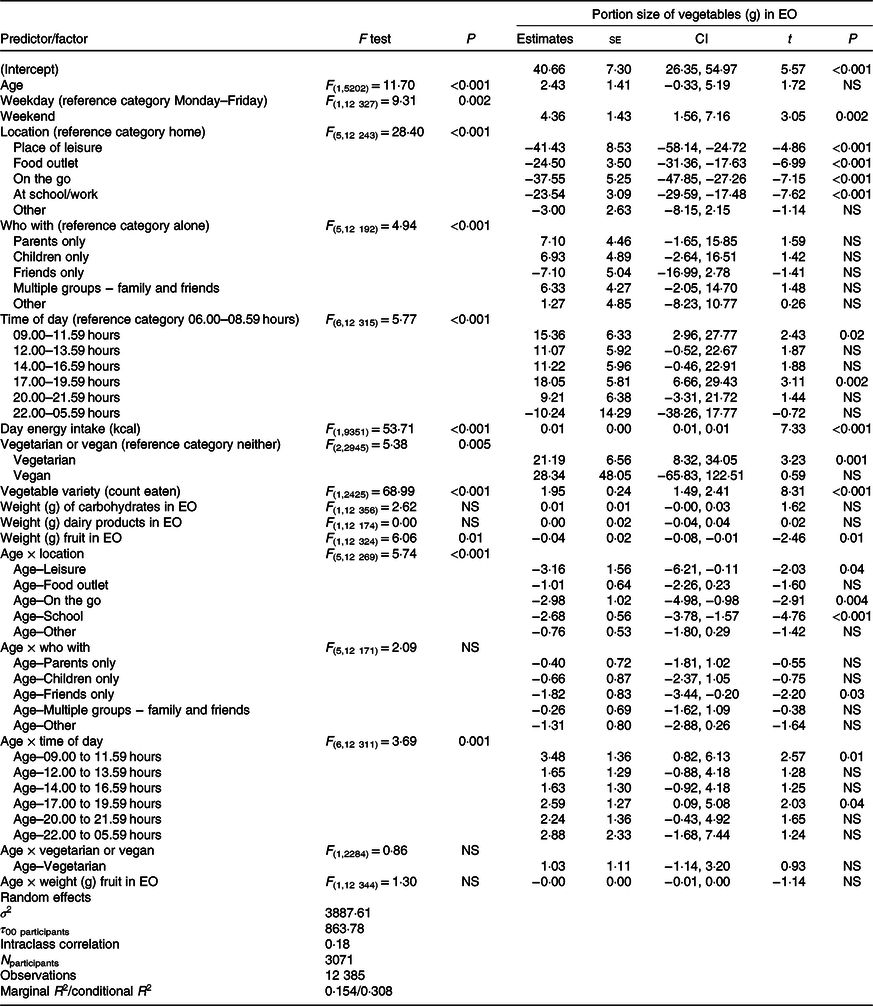
EO, eating occasion.
Food groups as predictors of vegetable presence
To explore whether certain food groups and combinations of food groups predict vegetable presence (or absence) within an EO, each EO was classed as either including vegetables or not. All other food groups were likewise classed as either being present in the meal or not and were used as binary predictors of vegetable presence in the meal. Table 6 presents findings from a multilevel logit regression model and reports OR of vegetables being present for each combination of food groups in an EO. The results illustrate that all food groups alone (carbohydrates, protein, dairy products, fruit and FSS items), without further information of other combinations of food groups present, predicted a lower odds of vegetables being present within the EO. However, for different combinations of these food groups, the likelihood of vegetables being present varied. When carbohydrates were eaten together with protein at an EO, it was twelve times more likely that vegetables were present. Similarly, combinations of protein with dairy products and carbohydrates with fruit predicted a higher odds of vegetables being present. In contrast, some combinations predicted the absence of vegetables. EO that included FSS food items unaccompanied by a carbohydrate or protein were thirty-three times less likely to contain a vegetable. Together, combinations of food groups and individual variability between children explains 57 % of the variance in the model for when vegetables are likely to be present. Of this variance explained by the model, 87 % is due to within-person variation, suggesting that combinations of food groups that predict the presence (or absence) of vegetables vary little between children. There is a larger degree of variation within individuals based on the different food groups eaten.
Table 6. Results of analysis of deviance with type II Wald χ 2 tests method, and parameters from multilevel logit modelling for whether vegetables are included in the eating occasion (EO) or not
(Odds ratios and confidence intervals; standard errors)
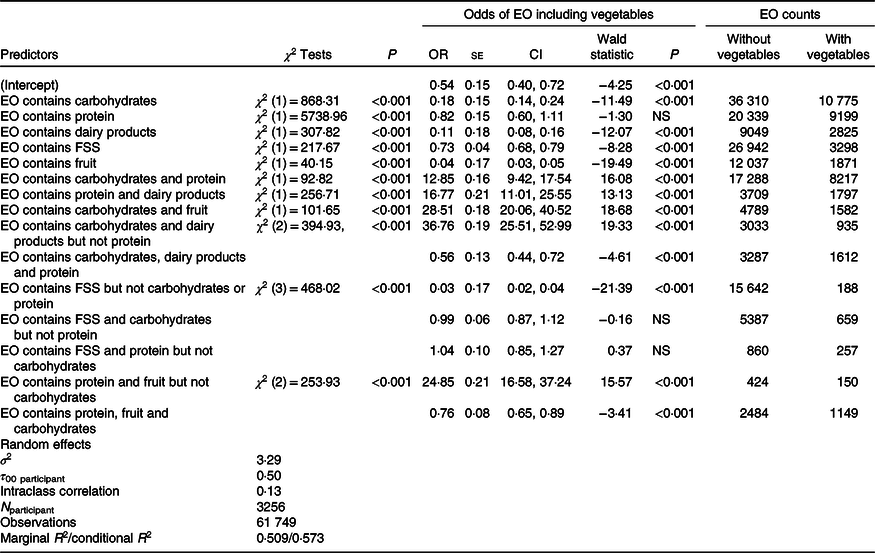
EO count, total number of eating occasions with this combination and with vegetables; FSS, foods high in fats, sugar and salt (e.g. puddings, pastries, sweets, biscuits, crisps, savoury items and chocolate).
Discussion
This study conducted secondary analyses of the UK NDNS data set years 1–9 to investigate predictors of vegetable intake in children and adolescents. Findings indicate that daily vegetable intake (g) is predicted by age, ethnicity and variety of vegetables eaten. These vegetables are most often consumed at home, with family members and at times that are usually associated with meals in the evening (17.00–20.00 hours) and early afternoon (12.00–14.00 hours). When vegetables are eaten, they are rarely eaten alone, do not often meet recommended portion sizes and are likely to be eaten alongside foods that are carbohydrates and proteins, but much less likely to be eaten alongside foods that are high in fats, sugars and salt.
Age was an important predictor of both daily intake and portion sizes of vegetables, indicating that older children tend to eat larger amounts of vegetables than younger children. The median amount of vegetables (g) eaten per d for each age group was only enough weight to equal one vegetable portion. This was found again when examining portion sizes of vegetables when they were eaten at a single EO. The intercept for vegetable portion size per EO was between 26 and 55 g, and estimates of portion size increased by 2–3 g for each additional year of age. This suggests that on average, only enough weight for one vegetable portion was eaten at an EO, and this portion is likely to be the only portion consumed per d. It is also important to note that portion sizes in this study were cumulative of all vegetables eaten within the EO, and not for each vegetable served, meaning that this portion may be composed of multiple vegetable types. Therefore, not enough variety of vegetables are consumed by children, as well as amount, to meet recommendations for daily intake.
Government recommended vegetable portion sizes for children vary by age, body size, activity levels and the food type. For 4–10-year-olds, the guidelines are between 40 and 60 g for a portion of raw or cooked vegetables and 80 g for 11–18-year-olds(32). Although between the ages of 3 and 18 years we observe an estimated 45 g increase in vegetable intake at an EO, we did not observe an increase of 40 (g) in portion size for children between 10 and 18 years (the age at which the portion size recommendation changes). This suggests that although older children ate a larger amount of vegetables, this was rarely at the recommended level. However, due to the observational nature of the data, it cannot be commented whether vegetable intake was low because serving sizes were small, or whether serving sizes were larger but not eaten, therefore producing wasted or leftover food.
Individual food groups were good predictors of whether vegetables were eaten or not. We found that vegetables were less likely to be eaten alongside foods high in FSS, ingredients associated with high palatability. This is consistent with previous research interventions which have suggested that vegetables were often not eaten due to competition from other foods(Reference Osborne and Forestell33–Reference Ishdorj, Capps and Storey35). However, it does not explain why vegetables are more likely to be eaten with carbohydrates and proteins. It is possible that the configuration of different foods together either increases or decreases vegetable intake. As the majority of vegetable intake comes from composite meals made of several foods(Reference O’Brien, Kiely and Galvin12), a finding that we replicate in this study, certain flavours or textures may enhance vegetable intake or vegetable taste in meals(Reference Meinert, Frøst and Bejerholm36) (e.g. by masking or enhancing the taste utilising food–food interactions) and decrease intake in other meals(Reference Hoppu, Puputti and Sandell37) (e.g. because other foods are more palatable). Whilst it is not possible to provide evidence for this explanation using diary data, in future research, it may be important to consider the potential competition of other food groups present when promoting vegetable intake by children. However, a further explanation for these food groups being commonly eaten together is due to cultural habit. This is regarding how meals are constructed in the UK and how parents present foods to their children within familiar meals, recipes and composite foods. If children are not presented with vegetables alongside fruit, or foods high in FSS, then children may never have the opportunity to eat these foods together, which may be reflected in these findings.
Vegetable portion size was predicted by EO occurring in the early evening, which is likely because the evening is when the majority of daily energy intake is consumed(Reference Diederichs, Perrar and Roßbach38). Vegetables might also be eaten more often within meals as part of a planned and prepared meal(Reference Monsivais, Aggarwal and Drewnowski39). This was evident as vegetables were eaten alongside cooked items high in carbohydrates and proteins (e.g. pasta, potatoes, meats and fish). Additionally, vegetables were rarely eaten at other times of day or on their own, suggesting that vegetables are not usually eaten as snacks. Overall, vegetable intake appears to require planning since they need to be prepared, chopped, peeled and cooked. Since preparation takes time, and parents are often responsible for children’s intake, the time available for parents to prepare these foods may be in the early evening, after the child’s school and parental work commitments(Reference Monsivais, Aggarwal and Drewnowski39). This may also partly explain the weekend effect, why more vegetables were eaten on the weekend compared with weekdays, as there may be more time available for planning and preparation of meals. However, this does not explain smaller vegetable portion sizes at school.
Interestingly, although the proportion of meals including vegetables at school was similar to that at home (20 % of total EO at school included a vegetable), vegetable portion size during EO in school was much lower than that at home. Given the limited opportunities to eat at school (mainly lunch and break times), this could mean that children do not have the opportunity to eat vegetables at schools, either through packed lunches(Reference Evans, Greenwood and Thomas40) or school meals(Reference Prynne, Handford and Dunn41), or that children do not eat vegetables served to them at school(Reference Upton, Upton and Taylor42). Certain age groups are supported in the UK for food intake, such as free school meals for 4–6-year-olds. The UK also has a school FV scheme(43) where 4–6-year-olds are entitled to a free piece of fruit or vegetable per d. Yet, we found little evidence of eating recommended portion sizes of vegetables at school. One reason for this could be that these schemes are not available to all age groups, though it is important for all age groups to eat FV regularly. Secondly, fruit is selectively chosen when FV are offered in class(Reference Ransley, Greenwood and Cade44). Therefore, simply offering vegetables to children as a snack at school is not enough to encourage intake, and this may need to occur alongside a tailored intervention(Reference Appleton, Hemingway and Saulais45–Reference Evans, Christian and Cleghorn47).
Eating vegetables mostly at home in the early evening accords with findings associating dietary quality with family mealtimes(Reference Gillman, Rifas-Shiman and Frazier13) and children eating the same foods as their parents(Reference Sweetman, McGowan and Croker14). We found that vegetable consumption occurred mostly with family, including parents and multiple groups of family members and friends. Given that vegetable portion sizes generally increased with family members present compared with eating alone, this illustrates the importance of social learning(Reference Pedersen, Grønhøj and Thøgersen11,Reference Suggs, Della Bella and Rangelov48) . Suggs et al. (Reference Suggs, Della Bella and Rangelov48) also found that most vegetable intake for Swiss children occurred at home during family meals using 7-d food diaries. Their conclusion was that eating was better for children at home with the family, meaning that this location has a positive influence on children’s eating behaviours and diet. As children spend much of the day at school and parents have many other responsibilities such as work, this conclusion could add further responsibility onto the parents to provide all recommended portions of vegetables for children per d. Since our findings suggest that vegetables are mainly eaten at mealtimes, this means that children would have to eat at least three recommended portions of vegetables in one sitting (assuming the other two portions are fruit and eaten outside of mealtimes). Yet, we found that only enough for one portion of vegetables is usually eaten at a single EO. Therefore, promoting vegetable intake outside of family evening mealtimes, such as at breakfast, as snacks and in schools at lunch times (where average portion size intake is lower than at home) could be an appropriate solution. Furthermore, if child preference is for smaller vegetable portion sizes(Reference Colapinto, Fitzgerald and Taper49), eating vegetables in small portions throughout the day may be a more suitable alternative for children, than having all recommended portions in one meal.
For children under 10 years, the importance of context for eating FV has previously been highlighted within the NDNS data set(Reference Mak, Prynne and Cole50). However, differences between the current and previous study are likely due to inclusion of fruit intake. Findings from Mak et al. (Reference Mak, Prynne and Cole50) show that fruit intake is more likely to occur outside of the home, meaning that there may be different contexts for eating FV. As we found no clear relationship of eating FV together, there is reason for assessing intake of these foods individually. Fruit is often eaten at different times, including as a snack or after meals as dessert(Reference Zellner and Cobuzzi51), but generally not within composite meals(Reference O’Brien, Kiely and Galvin12). Therefore, it has been suggested that fruits could be targeted separately from vegetables in national campaigns(Reference Glasson, Chapman and James52). This may help to promote the importance of increasing amounts of vegetables eaten daily, as fruit intake is usually higher than vegetable intake in children(Reference Kim, Moore and Galuska22). Few countries, such as Australia and the Netherlands, have implemented this separate message with ‘Go for 2 & 5’ and ‘2 + 2’ campaigns, respectively.
Strengths
A multiple perspective approach to examining vegetable consumption patterns in children was taken. Previous studies have highlighted numerous predictors of vegetable intake, but seldom use national dietary data to observe eating habits further than asking whether children meet the five-a-day guidelines. The current study not only looked at average intake and absolute counts of vegetables eaten per d as predicted by demographic factors, but also examined the effects of environmental context on portion size and food groups that are eaten together. This is important because child healthy eating is complex and multifaceted, and by taking this approach, we can observe another viewpoint of what vegetables children are habitually eating and when.
As a large amount of data was available using the UK NDNS, the statistical models were built on one set of data and then tested on another sample of participants. This reduces the exploratory nature of the research and allows confirmation of models rather than a single exploratory analysis. In particular, this is useful because the EO analyses for vegetable portion sizes initially showed that some food group weights (e.g. the weight (g) of carbohydrates, dairy products and fruit in the EO) were found to add to the model, but this was not confirmed in the test data set. This means that there is either a small or no effect of amounts of other food groups eaten on vegetable portion sizes eaten. Nonetheless, in the logit models, it shows that these food groups do matter for whether any vegetables are eaten or not.
Limitations
The limitations of using food diaries and estimated intake have been noted extensively elsewhere(Reference Dhurandhar, Schoeller and Brown53). Estimates of energy intake may be both under- and over-estimated. However, the present study attempts to limit this problem by examining counts of vegetables eaten and which food groups were present at EO. Even if portion size estimates are not accurate, they are supplemented by counts of whole foods and whole food groups. Whilst this mitigates against the limitations of dietary diaries, exploring food groups also introduces its own constraints. Many foods cannot be sorted into groups that are agreed upon. For example, nuts and seeds are sometimes grouped with fruits, and other times with protein(54). Thus, configurations of food groups could be ambiguous, as some foods within the food group may be better predictors of vegetable intake than others. Furthermore, whilst large-scale diary data are useful for information regarding what children eat (and sometimes how they eat), it is not helpful to answer questions relating to why children are eating particular foods or meals. Research questions regarding choice and palatability of preferred foods cannot be answered, and therefore, explanations for why children eat certain foods together and in specific contexts are limited.
Future research
Ethnicity predicted that higher counts of vegetables are eaten per d by Black and minority ethnic children, which may relate to cultural recipes for meals and ingredients used. The study also shows that there are multiple opportunities to increase vegetable intake throughout the day. When looking to different cultures, traditional breakfasts in Asian countries tend to include rice, noodles or soup in the morning complemented by vegetables(Reference Howden, Chong and Leung55). Therefore, future research could investigate increasing vegetable intake outside of home evening meal times by encouraging eating vegetables at breakfast and snack times, as well as in smaller portions throughout the day.
Conclusion
This study examined children’s vegetable intake using the UK NDNS years 1–9. It was found that daily vegetable intake was predicted by age, ethnicity and variety of vegetables eaten. When vegetables are eaten, they are usually consumed at home, with family members and at evening meals. Portion sizes of vegetables were often smaller than recommended, and vegetables were rarely eaten alone. Vegetable presence within an EO was predicted by other food groups present, such as carbohydrates and proteins, whereas foods high in fats, sugars and salt predicted absence of vegetables. Future research may investigate different contexts and opportunities to eat vegetables, whilst considering other foods available, such as eating vegetables with less ‘competitive’ palatable foods, offering them at breakfast and as snacks.
Acknowledgements
L. R. C. is in receipt of a research studentship funded by the White Rose Doctoral Training Pathway (WRDTP) and Economic and Social Research Council (ESRC) collaborative award. The ESRC had no role in the design, analysis or writing of this article.
Conceptualisation and study design, L. R. C., P. B.-B. and M. M. H.; data curation, L. R. C.; formal analysis, L. R. C.; writing-original draft, L. R. C.; writing-review and editing, L. R. C., P. B.-B. and M. M. H.
There are no conflicts of interest.


