


Colorectal cancer (CRC) is the third most frequent malignant carcinoma( Reference Arnold, Sierra and Laversanne 1 ). Its prevalence in China has been increasing in the last few years( Reference Chen, Zheng and Baade 2 ). Damage to the intestinal mucosa epithelial barrier and inflammatory processes usually occur during CRC development and progression. The intestinal mucosa mainly consists of three parts: outer mucus, central epithelial cell, and inner lamina propria layers( Reference Vancamelbeke and Vermeire 3 ). Mucus proteins play a defensive function in the intestinal epithelium. Mucin 2 (MUC2) is the most abundant mucus protein secreted by goblet cells in the large intestine. Trefoil factor 3 (TFF3), also secreted by goblet cells, belongs to a highly conserved family of peptides and is considered the main component of intestinal mucus. The combination of MUC2 and TFF3 plays a key role in maintaining the integrity of the gastrointestinal mucosal surface( Reference Specian and Oliver 4 ). Several studies have demonstrated that both MUC2 and TFF3 are involved in the development and progression of CRC( Reference Betge, Schneider and Harbaum 5 , Reference John, El-Rouby and Tomasetto 6 ). The epithelial cells form important physical barriers through junctional complexes, which comprise of tight junctions, adherens junctions, and desmosomes. Claudin-1 is an important tight junction protein central to the maintenance of cell polarity and is located around the apical cell membrane( Reference Turksen and Troy 7 , Reference Wang, Tully and Ngo 8 ). E-cadherin is the key adhesion junction protein essential for maintaining the structural integrity of the epithelial cell layer. Huo et al. ( Reference Huo, Kinugasa and Wang 9 ) found that the expression of claudin-1 was remarkably increased in CRC tissues, whereas E-cadherin was decreased in CRC tissues. Damage to the intestinal mucosal barrier may result in increased inflammatory signalling, whereas several inflammatory factors, such as TNF-α and IL-1β, can alter the expression of tight junction proteins and induce damage to the intestinal mucosal barrier( Reference Wells, Brummer and Derrien 10 ). Both the defect of the intestinal mucosal barrier and inflammation contribute to gastrointestinal disease pathogenesis, including CRC( Reference Vancamelbeke and Vermeire 3 , Reference Diakos, Charles and McMillan 11 ).
Phytic acid (PA) has been shown to inhibit colon carcinogenesis and may play a critical role in the chemoprevention of the disease( Reference Silva and Bracarense 12 ). PA, also known as inositol hexaphosphate, is a natural compound with six phosphate groups in soyabeans, oil seeds, nuts and grains( Reference Graf, Empson and Eaton 13 ). PA was considered as an antinutrient given its ability to reduce the absorption of several minerals. However, it was later demonstrated to have anticarcinogenic actions in the 1980s. Research shows that diets rich in PA, rather than fibre, may inhibit colonic carcinogenesis( Reference Graf and Eaton 14 ). Several studies have proven that PA has inhibitory actions in several cancers( Reference Nawrocka-Musial and Latocha 15 ). Numerous animal studies and clinical trials have shown that dietary supplementation with PA can provide substantial protection against CRC( Reference Druzijanic, Juricic and Perko 16 – Reference Norazalina, Norhaizan and Hairuszah 18 ). The mechanisms underlying the anticancer effect of PA involve inhibition of cancer cellular proliferation and modulation of immunity and inflammation( Reference Henderson, Ollila and Kumar 19 ). In addition, several findings suggest that PA has an influence on the intestinal mucosal barrier in vivo ( Reference Okazaki and Katayama 20 ) and in vitro ( Reference Pacheco, Silva and Pinton 21 , Reference Fu, Wang and Xia 22 ). PA can improve intestinal mucosal barrier function by modulating mucins in rats fed a high-fat diet( Reference Okazaki and Katayama 20 ). PA can also adjust tight junctions and affect the intestinal mucosal barrier in the human intestinal Caco-2 cell line( Reference Fu, Wang and Xia 22 ). Collectively, we put forward the hypothesis that PA may have a protective effect on the intestinal mucosal barrier and, in turn, reduce the expression of serum inflammatory factors during the development of CRC. To verify this hypothesis, we developed a CRC rat model induced by 1,2-dimethylhydrazine (DMH). In the present study, we evaluated to what extent PA influenced the intestinal mucosal barrier and serum inflammatory cytokines in rats with CRC.
Methods
Materials
Sodium phytate was purchased from Huamaike Boitechology Co., Ltd. AIN 93G and AIN 93M( Reference Reeves, Nielsen and Fahey 23 ) were purchased from Trophic Animal Feed High-tech Co., Ltd. DMH was purchased from Tokyo Chemical Industry. TRIzol reagent was purchased from Invitrogen. RT-PCR FastQuant RT Kit (KR106) and SuperReal PreMix Plus (SYBR Green FP205) were purchased from Tiangen Biotech Company. The following antibodies were used in the Western blot analysis: rabbit anti-MUC2 (Abcam), claudin-1 (Novus), TFF3 (Novus) and E-cadherin (Danvers). The secondary antibodies were purchased from Merck Millipore.
Animals
A total of sixty Wistar male rats weighing 70–110 g and aged 3–4 weeks were purchased from Shandong Lukang Pharmaceutical Co., Ltd, with a certificate of quality number: SCXK Lu 20130001. Given the homology of heredity, rats in the inbred strain were found to have the same phenotype. Phenotypic uniformity allows a relatively small sample to be taken in animal experiments, thereby improving statistical accuracy. If the sample size is more than six in the conventional animal experimentation, individual differences can be eliminated. In view of our long experimental period, accidental death may be possible during the experimentation. We deemed that twelve rats in each group were sensible. There were five groups in our study, with the total sample of sixty rats. The rats were raised in an adequately ventilated laboratory, with a room temperature of 24±2°C and relative humidity of 52±8 %, with light and dark cycles at 12 h, respectively. This study was approved by the medical ethics committee of Qingdao University Medical College (reference no. 20151222, 2015).
Tumour induction
DMH was dissolved in 0·9 % NaCl solution and pH was regulated to 6·5–7·0 by sodium bicarbonate. To induce colorectal tumours, the rats were given DMH injections at a dosage of 30 mg/kg of body weight through a subcutaneous route once a week for 18 weeks.
Experimental procedures
The rats were randomly distributed into five groups: control group (CG), model group (MG), low-PA-dose group (LPG), middle-PA-dose group (MPG), and high-PA-dose group (HPG). The rats were initially fed the AIN 93G diet before reaching 20 weeks old and later fed the AIN 93M diet. During the whole experiment, rats in the LPG, MPG and HPG were administered PA by gavage at dosages of 0·25, 0·5 and 1·0 g/kg per d, respectively. According to the ratio of body surface area between human and animals, the ratio between humans at a body weight of 70 kg and rats at a weight of 200 g is 56·0. Accordingly, the corresponding ‘safe’ PA doses for a 70 kg body weight human are 2·8, 5·6 11·2 g/d. The rats in the CG and MG received saline by gavage at the same volume. After 4 weeks of PA treatment, all rats except those in the CG were given DMH subcutaneous injections at a dosage of 30 mg/kg of body weight once a week for 18 weeks. The rats in the CG were injected the same volume of saline subcutaneously. All rats were anaesthetised with Nembutal and killed 16 weeks after the end of DMH administration. The experiment lasted 39 weeks. During the experimental period, a total of thirteen rats died due to reasons such as intussusception, cachexia or faulty gavage. At the end of the experiment, forty-seven rats remained alive.
Pathological histology
The normal colon tissue from the CG and colon tissue 1 cm adjacent to the tumours from the other groups were collected and fixed in 10 % formalin immediately. Subsequently, the tissues were processed routinely. In brief, the tissues were dehydrated, embedded into paraffin, cut into sections, and deparaffinized. The sections were stained with haematoxylin–eosin (H&E), and slides were analysed by an optical microscope under 400× magnification.
Real-time PCR analysis of mRNA expression
Total RNA was extracted from the tissues using a TRIzol reagent. An IMPLEN NanoPhotometer P-330 nucleic acid detector was used to measure mRNA concentration and purity. The purity of total RNA was determined by A260:280 ratios. In the present study, the A260:280 ratios ranged from 1·90 to 2·00, which demonstrated good sample quality. A Primer Script RT Reagent Kit and a Bio-Rad MyCycler PCR instrument were used to reversely transcribe total RNA (2 µg). The PCR primer sequences and the sizes of the resulting PCR product are shown in Table 1. PCR was operated in a 20-µL reaction volume through an Eppendorf Mastercycler EP Gradient System (Eppendorf) according to manufacturer instructions. A two-step PCR cycling protocol was then performed, consisting of a denaturation step at 95°C and a combined annealing/extension step at 60°C. The protocol was useful for primers with a Tm under 60°C. As an internal reference gene, β-actin was needed to standardise the expression of the target genes. The relative levels of gene expression were enumerated using the comparative formula
 $$2^{{{\minus}\Delta \Delta C_{t} }} $$
. These experiments were replicated in triplicate.
$$2^{{{\minus}\Delta \Delta C_{t} }} $$
. These experiments were replicated in triplicate.
Table 1 Real-time PCR primer sequences used and the sizes of the products obtained
MUC2, mucin 2; TFF3, trefoil factor 3.
Western blot analysis of protein analysis
The total proteins in the tissues were extracted using a RIPA buffer that included phenylmethanesulfonyl fluoride. The lysed tissues were centrifuged at 12 000 g at 4°C for 5 min. A BCA Protein Assay Kit was used to evaluate protein concentrations. The extracted proteins (50 µg) were disassociated using 12 % SDS-PAGE, and polyvinylidene difluoride membranes were used to transfer membrane proteins. The membranes were sealed in a TRIS-buffered saline Tween with 5 % defatted milk powder for 2 h and subsequently hatched with the following primary antibodies at 4°C overnight: anti-MUC2 (diluted 1:1000), anti-TFF3 (diluted 1:1000), anti-claudin-1 (diluted 1:1000), anti-E-cadherin (diluted 1:1000) and anti-β-actin (diluted 1:1000). Membranes were then incubated for 2 h using a secondary antibody (diluted 1:5000). Vilber Fusion FX5 with a BeyoECL Plus Kit was used to perform chemiluminescent detection of the bound antibodies. Bands from Fusion FX5 were determined and quantified using the Vilber FusionCapt Advance software program.
ELISA
Serum LPS levels were evaluated by the LPS enzyme ELISA Kit (catalogue no. E-EL-0025c; Elabscience) according to manufacturer protocols using competitive-ELISA methodology. Serum d-lactate (D-LA) levels were measured using the ELISA Kit (catalogue no. EIA06607r; Elabscience) according to manufacturer protocols. Serum TNF-α, IL-1β and IL-6 levels were measured using the ELISA Kit (catalogue no. SEA133 Ra; SEA563 Ra, SEA079 Ra; USCN) according to manufacturer protocols. The methodology utilised in these kits was the double antibody sandwich technique.
Statistical analysis
Data were expressed as means and standard deviations. A Student’s t test was performed to assess the differences between the CG and MG. One-way ANOVA by the least significant difference method was performed to compare the differences among the different PA groups and MG with a significance level of P<0·05. SPSS software for Windows version 19.0 (SPSS Inc.) was selected to perform all statistical analysis.
Results
Changes in body weight and food intake
The mean body weight of the rats was observed to increase steadily, with no significant differences among the five groups in the first 38 weeks (Fig. 1). However, the rise was then followed by a gradual decrease over time. At the 32nd week of the experiment, a decrease in body weight was observed in the MG. Simultaneously, the body weight of rats in the PA treatment groups was observed to fluctuate. At the end of the experiment, the body weight of rats in the CG showed an increasing trend, whereas the body weight of rats in the other four groups showed a declining trend. The final body weight of rats in the MG was significantly lower than that in the CG, LPG, MPG and HPG. There were no significant differences in the body weight among three PA treatment groups. We also measured the food intake of the rats from the 2nd month to the end of the experiment (online Supplementary Fig. S1). No significant differences in the food intake were observed among rats in the five groups during the first five months. The food intake of rats in the MG was lower than that in the CG after five months of the experiment. Regarding daily food intake, a regular pattern was observed, whereby the rats in the tumour groups usually ate less on the day of the DMH injection than on the other days.
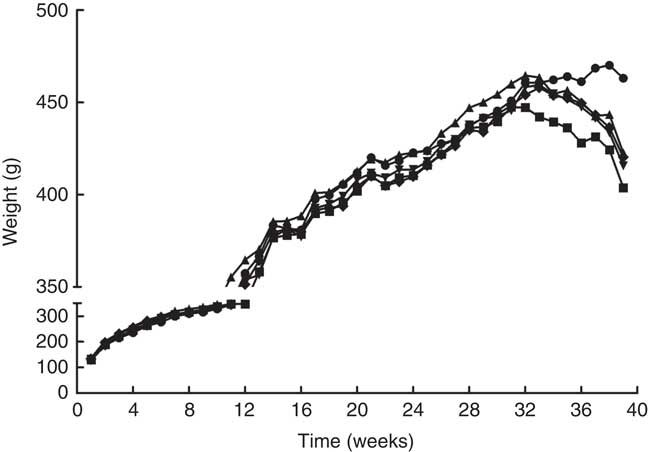
Fig. 1 Changes of mean body weight in the different groups. ![]() , Control group;
, Control group; ![]() , model group;
, model group; ![]() , low-phytic acid-dose group;
, low-phytic acid-dose group; ![]() , middle-phytic acid-dose group;
, middle-phytic acid-dose group; ![]() , high-phytic acid-dose group.
, high-phytic acid-dose group.
Occurrence of tumours and histomorphology of the colonic wall
Details of the tumours in the five groups are shown in Table 2 and Fig. 2. Tumour incidence in the MG and LPG was higher than that in the MPG and HPG. Rats in the HPG had the lowest tumour incidence, which indicated that PA may have inhibited tumour development. Fig. 3 indicated histomorphology of the colonic wall by H&E staining. As indicated in Fig. 3(a), the structure of epithelial cells containing abundant goblet cells was normal. Also, the intestinal gland was in order and the mucosal muscle was complete. These results indicated a normal colon. As indicated in Fig. 3(b), epithelial cell structure was incomplete, goblet cells were significantly reduced, the intestinal gland was destroyed, aberrant crypt foci had appeared, and the mucosal muscle was incomplete. As shown in Fig. 3(c)–(e), after the different dosage of PA treatment, the condition of the colonic wall was found to be improved as compared with MG, demonstrating that PA may reduce the damage to intestinal gland structure.
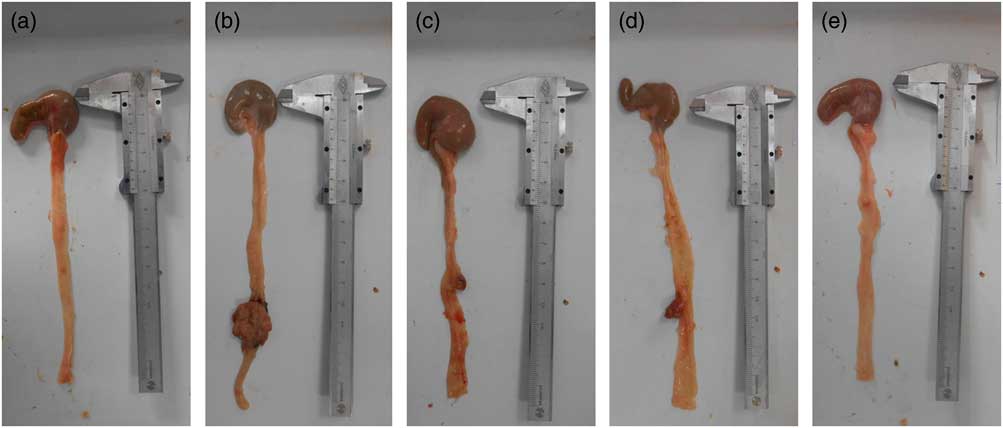
Fig. 2 Representative pictures of colon tumours in the different groups. (a) Control group, (b) model group, (c) low-phytic acid-dose group, (d) middle-phytic acid-dose group, (e) high-phytic acid-dose group.
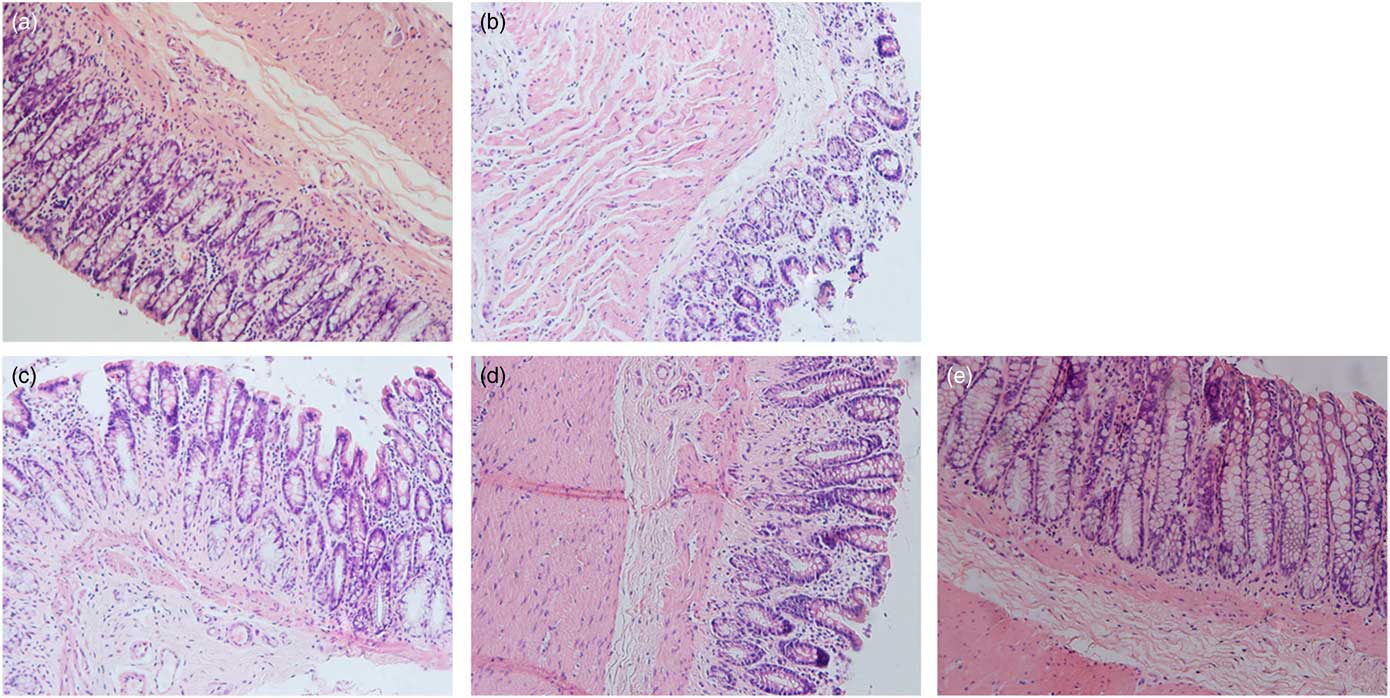
Fig. 3 Representative sections stained with haematoxylin–eosin showing the histopathology of the colonic wall in the different groups. The magnification is 400×. (a) Control group, (b) model group, (c) low-phytic acid-dose group, (d) middle-phytic acid-dose group, (e) high-phytic acid-dose group.
Table 2 Occurrence of tumours in experimental animals
CG, control group; MG, model group; LPG, low-phytic acid-dose group; MPG, middle-phytic acid-dose group; HPG, high-phytic acid-dose group.
mRNA expression of mucin 2 and trefoil factor 3 in colon tumour tissue
Fig. 4 displays the mRNA expression levels of MUC2 and TFF3 to further analyse to what extent PA affects mucus layer products in CRC rats. The mRNA expression level of MUC2 and TFF3 in the MG were significantly reduced (P<0·05) compared with the CG. MUC2 and TFF3 mRNA expression levels in the LPG, MPG, and HPG were obviously higher than those in the MG (P<0·05). The difference in MUC2 mRNA expression level between the MPG and HPG was not found to be statistically significant (P>0·05).
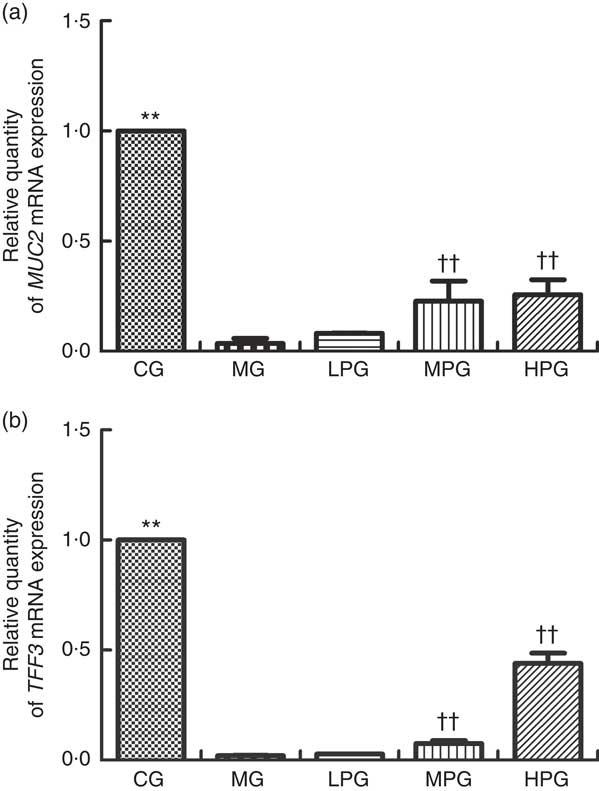
Fig. 4 Real-time PCR analysis of mucin 2 (MUC2) (a) and trefoil factor 3 (TFF3) (b) mRNA expression levels. The normal colon tissues were selected in the control group (CG) and the colon tumour tissues were selected in the other groups. β-Actin was used as a loading control. MG, model group; PA, phytic acid; LPG, low-PA-dose group; MPG, middle-PA-dose group; HPG, high-PA-dose group. **P<0·01, CG compared with the MG; †† P<0·01, PA treatment groups compared with the MG.
mRNA expression of claudin-1 and E-cadherin in colon tumour tissue
Fig. 5 presents the mRNA expression levels of claudin-1 and E-cadherin to determine if PA can influence tight and adhesion junction proteins. Compared with the CG, the mRNA expression level of claudin-1 in the MG was significantly increased (P<0·05). The claudin-1 mRNA expression of the MPG and HPG were significantly lower than that in the MG (P<0·05). The difference in claudin-1 mRNA expression between the LPG and MG was not found to be statistically significant (P>0·05). The mRNA expression level of E-cadherin in the MG was significantly lower than that in the CG (P<0·05). After PA treatment, E-cadherin mRNA expressions in the LPG, MPG and HPG were higher than that in the MG (P<0·05), especially in the MPG and HPG (P<0·01).
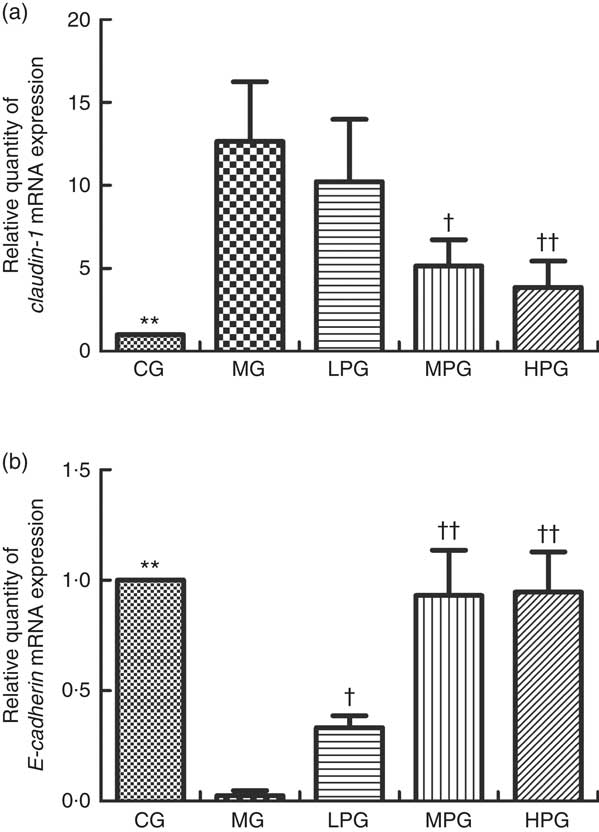
Fig. 5 Real-time PCR analysis of mRNA expression of claudin-1 (a) and E-cadherin (b). The normal colon tissues were selected in the control group (CG) and the colon tumour tissues were selected in the other groups. β-Actin was used as a loading control. MG, model group; PA, phytic acid; LPG, low-PA-dose group; MPG, middle-PA-dose group; HPG, high-PA-dose group. ** P<0·01, CG compared with the MG; † P<0·05, †† P<0·01, PA treatment groups compared with the MG.
Protein expression of mucin 2 and trefoil factor 3 in colon tumour tissue
As indicated in Fig. 6, the Western blotting results of MUC2 and TFF3 demonstrated the extent to which different doses of PA altered protein expressions. MUC2 and TFF3 expression were significantly reduced in the MG compared with the CG (P<0·05). PA was found to increase the level of MUC2 and TFF3 protein expression. The MUC2 expressions in the LPG, MPG, and HPG were significantly higher compared with those in the MG (P<0·05). The difference of MUC2 expression between the MPG and HPG groups was not found to be statistically significant (P>0·05). TFF3 expressions in the MPG and HPG were significantly increased compared with the MG (P<0·05). There was no significant difference of TFF3 expression between MPG and HPG (P>0·05).
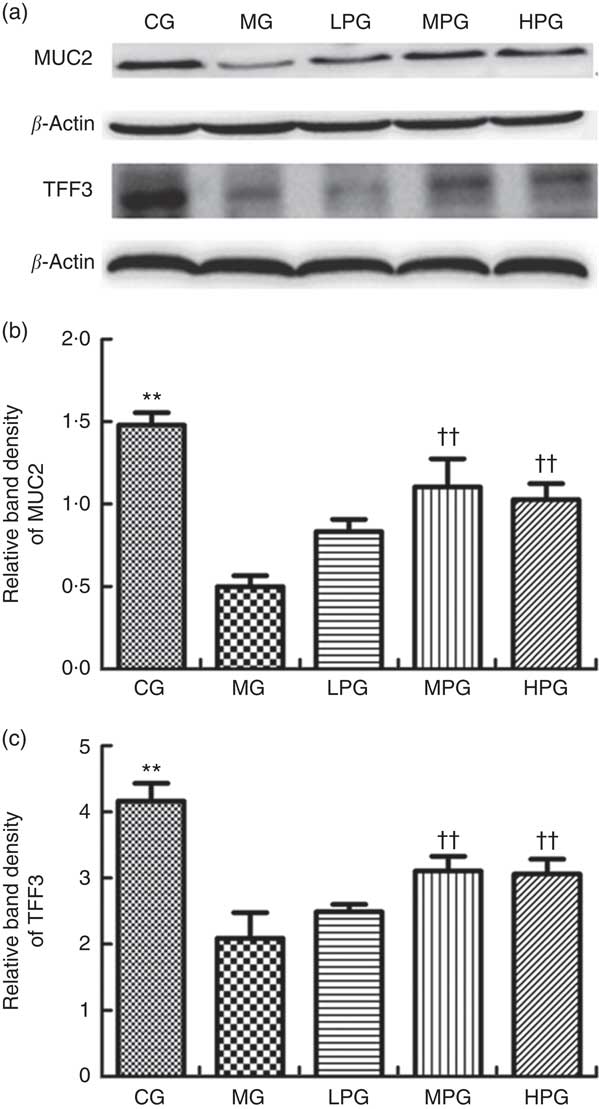
Fig. 6 Western blot analysis of mucin 2 (MUC2) and trefoil factor 3 (TFF3) protein expression. The normal colon tissues were selected in the control group (CG) and the colon tumour tissues were selected in the other groups. β-Actin was used as a loading control. (a) Representative blots from one of three separate experiments; (b) relative band intensities of MUC2 based on densitometry; (c) relative band intensities of TFF3 based on densitometry. MG, model group; PA, phytic acid; LPG, low-PA-dose group; MPG, middle-PA-dose group; HPG, high-PA-dose group. ** P<0·01, CG compared with the MG; †† P<0·01, PA treatment groups compared with the MG.
Protein expression of claudin-1 and E-cadherin in colon tumour tissue
Fig. 7 shows the Western blotting results of claudin-1 and E-cadherin to investigate the extent to which PA influenced tight and adhesion junction proteins. As indicated in Fig. 7(b), claudin-1 expression was significantly elevated in the MG compared with the CG (P<0·05). PA was found to reduce the level of claudin-1 expression. Although there were no differences in claudin-1 expression between the MG and LPG (P>0·05). Claudin-1 expressions in the MPG and HPG were significantly down-regulated compared with those in the MG (P<0·05). As indicated in Fig. 7(c), the protein expression of E-cadherin in the MG was significantly lower than that in the CG (P<0·05). Following PA treatment, E-cadherin expressions in the LPG, MPG, and HPG were significantly elevated than that in the MG (P<0·05).
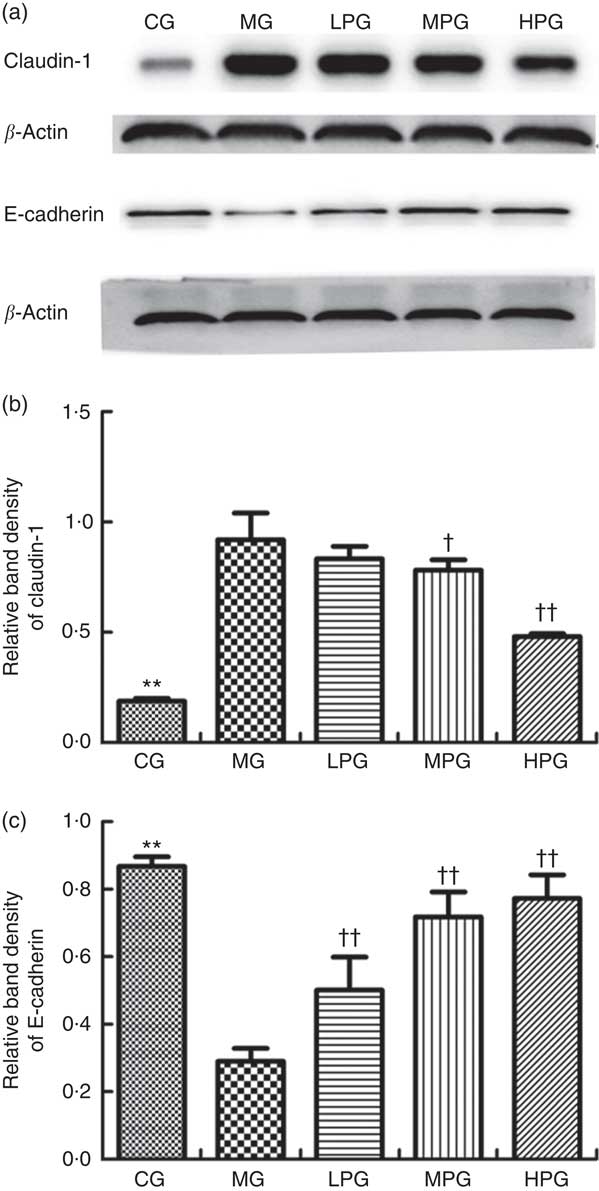
Fig. 7 Western blot analysis of claudin-1 and E-cadherin protein expression. The normal colon tissues were selected in the control group (CG) and the colon tumour tissues were selected in the other groups. β-Actin was used as a loading control. (a) Representative blots from one of three separate experiments; (b) Relative band intensities of claudin-1 based on densitometry; (c) Relative band intensities of E-cadherin based on densitometry. MG, model group; PA, phytic acid; LPG, low-PA-dose group; MPG, middle-PA-dose group; HPG, high-PA-dose group. ** P<0·01, CG compared with the MG; † P<0·05, †† P<0·01, PA treatment groups compared with the MG.
Concentrations of D-lactate and lipopolysaccharide in serum
Fig. 8 shows D-LA and LPS concentrations in the serum as measured by ELISA. The levels of D-LA and LPS were found to have similar trends. The serum concentrations of D-LA and LPS in the MG were significantly higher than those in the CG (P<0·05). In the LPG, MPG, and HPG, D-LA and LPS concentrations were significantly lower in comparison with the MG (P<0·05). In addition, the differences among the LPG, MPG and HPG were observed to have statistical significance (P<0·05).
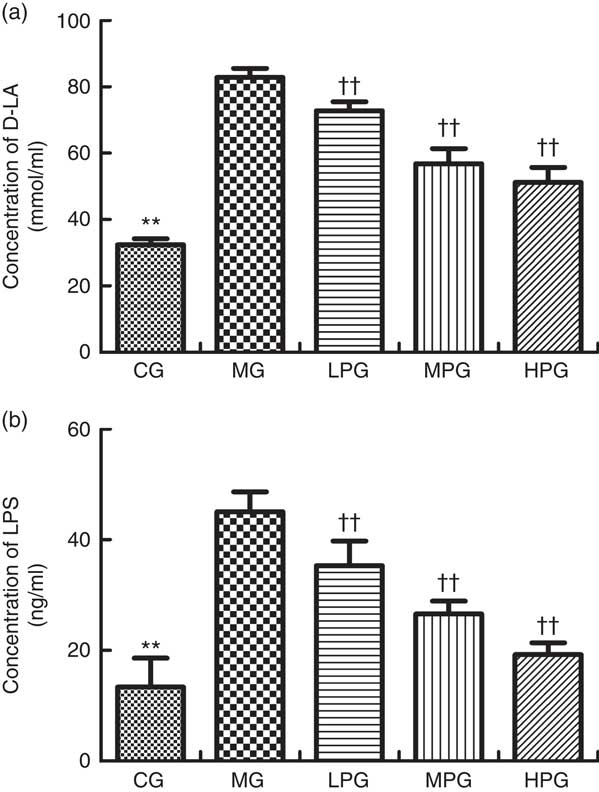
Fig. 8 ELISA was used to detect the D-lactate (D-LA) (a) and lipopolysaccharide (LPS) (b) concentrations in the serum. CG, control group; MG, model group; PA, phytic acid; LPG, low-PA-dose group; MPG, middle-PA-dose group; HPG, high-PA-dose group. ** P<0·01, CG compared with the MG; †† P<0·01, PA treatment groups compared with the MG.
Concentrations of TNF-α, IL-1β and IL-6 in serum
The serum concentrations of proinflammatory cytokines TNF- α, IL-1β and IL-6 were evaluated by ELISA. As indicated in Fig. 9, the concentrations of TNF-α, IL-1β, and IL-6 were significantly higher in the MG than that in the CG (P<0·05). PA down-regulated the serum concentrations of TNF-α, IL-1β and IL-6 in the LPG, MPG and HPG compared with the MG (P<0·05), especially in the MPG and HPG (P<0·01).
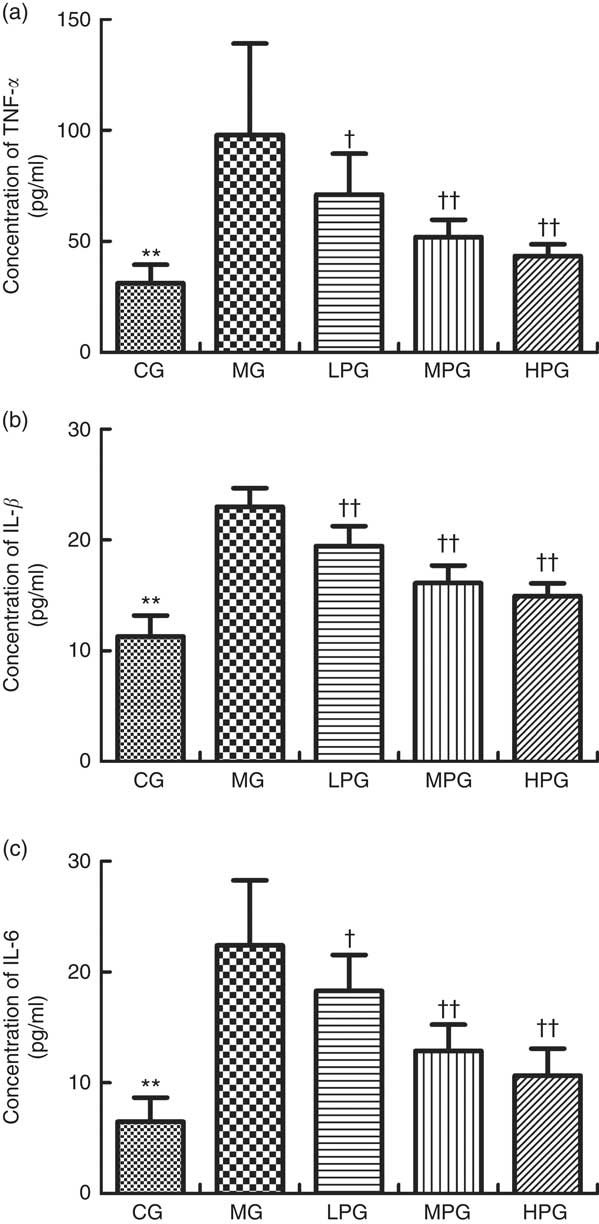
Fig. 9 ELISA was used to detect TNF-α (a), IL-1β (b) and IL-6 (c) concentrations in the serum. CG, control group; MG, model group; PA, phytic acid; LPG, low-PA-dose group; MPG, middle-PA-dose group; HPG, high-PA-dose group. ** P<0·01, CG compared with the MG; † P<0·05, †† P<0·01, PA treatment groups compared with the MG.
Discussion
The present study showed that PA could reduce the incidence of CRC. Specifically, PA was not observed to possess any impact on both the weight and food intake of the rats, indicating no obvious adverse effects. PA treatment in DMH-induced CRC rats improved intestinal barrier function. This was characterised by up-regulation of MUC2 and TFF3, inhibition of claudin-1 overexpression and E-cadherin low expression, and the down-regulation of D-LA and LPS. In addition, PA inhibited the expression of the proinflammatory cytokines TNF-α, IL-1β and IL-6 in the serum. Collectively, these results suggest that PA alleviates DMH-induced CRC through the improvement of intestinal barrier function and reduction of inflammation.
PA has been confirmed to provide substantial protection against experimentally induced colon cancer( Reference Latifah, Armania and Tze 17 , Reference Norazalina, Norhaizan and Hairuszah 18 , Reference Saad, Esa and Ithnin 24 ). The intestinal tract may suffer different degrees of disorder during CRC, including increased intestinal mucosal permeability, intestinal mucosal immune dysfunction, and intestinal microbial ecological unbalance. Intestinal barrier function relies on many elements, including the normality of the mucus layer and the integrity of epithelial cells. In the present study, we evaluated the effect of PA on MUC2, TFF3, claudin-1, E-cadherin, D-LA and LPS.
Mucins play an essential role as a protective layer in intestinal epithelial tissues. It is generally accepted that depletion of mucin and aberrant expression of mucin in non-conventional locations can occur during carcinogenesis. As the main mucin in the colon, MUC2 forms the major component of the intestinal mucus lining( Reference Kufe 25 ). Several studies have found that high expression of MUC2 is indicative of a lower risk of colon cancer( Reference Velcich, Yang and Heyer 26 , Reference Shan, Hsu and Lai 27 ). Shan et al. ( Reference Shan, Hsu and Lai 27 ) found that a decreased expression of MUC2 was closely correlated to an increased secretion of proinflammatory factor IL-6 in a colon animal model. In the present study, expression of MUC2 in rats with CRC was reduced significantly compared with normal rats, which is consistent with the previous study( Reference Kuugbee, Shang and Gamallat 28 ). Our results showed that PA improved the level of MUC2 mRNA and protein in rats with CRC, but no obvious dose–response trend was observed. Okazaki & Katayama( Reference Okazaki and Katayama 20 ) also found that PA up-regulated the secretion of mucins in the high-fat diet rats. Several studies show that acetate and butyrate can stimulate mucin production in the gut of rats( Reference Barcelo, Claustre and Moro 29 , Reference Shimotoyodome, Meguro and Hase 30 ) and PA can promote the production of organic acids( Reference Okazaki and Katayama 20 ). The up-regulation of MUC2 by PA may be related to the increased production of organic acid.
As the main mucus component, TFF3 is predominantly produced by goblet cells in the small and large intestine( Reference Podolsky, Lynch-Devaney and Stow 31 ), which can combine with mucins to enhance the protective function of the intestinal mucosal barrier. The expression of TFF3 and MUC2 in goblet cells is considered to be coincident( Reference Longman, Douthwaite and Sylvester 32 ). It is well known that TFF3 plays a critical role in enhancing mucus viscosity and in the restitution of the intestinal epithelium. Previous research has demonstrated that the expression of TFF3 is negatively related to colon cancer cell development and its invasive behaviours( Reference Uchino, Kataoka and Itoh 33 – Reference Taupin and Podolsky 35 ). In the present study, the goblet cells in the MG decreased significantly, and the expression of TFF3 in the MG was reduced significantly compared with CG rats. PA reduced the damage of goblet cells and increased the expression level of TFF3 mRNA and protein in rats with CRC.
The connections between cells are very important for normal cell function. For intestinal epithelial cells, tight and adherens junctions play a critical role in the defensive function of intestinal epithelial cells. In the present study, we evaluated the effect of PA on tight junction protein claudin-1 and adherens junction protein E-cadherin. As a member of the claudin family, claudin-1 plays a pivotal role in maintaining epithelial barrier function. Previous studies have shown that up-regulation of claudin-1 expression was related to CRC( Reference Pope, Ahmad and Bhat 36 – Reference Kinugasa, Huo and Higashi 38 ). These studies suggested that claudin-1 is pivotal in the process of cellular transformation and invasion in CRC. Overexpression of claudin-1 could induce abnormal intestinal epithelial cell differentiation, which may lead to the decrease of goblet cells and the low expression of MUC2( Reference Pope, Bhat and Sharma 39 ). Our study found that claudin-1 was increased in rats with CRC, which was consistent with previously reported data( Reference Kinugasa, Akagi and Yoshida 40 ). After PA treatment, the expression of claudin-1 was down-regulated in rats with CRC, which suggests that PA effects tight junction integrity to protect the intestinal mucosal barrier.
As a key component of adherens junction protein, E-cadherin can be considered a prerequisite for the normal structure and function of the intestinal epithelial barrier. A deficiency of E-cadherin may contribute to the decrement of cell adhesion, which in turn can promote the progression of cancer, including CRC( Reference Shiozaki, Oka and Inoue 41 , Reference Ngan, Yamamoto and Seshimo 42 ). Our study showed that the expression of E-cadherin in CRC was significantly lower in the CG. PA could increase E-cadherin expression, which indicated that it had a protective effect on adhesion molecules. E-cadherin can exert normal cell-cell adhesion function among intestinal epithelial cells mainly by the E-cadherin/β-catenin complex. Previous studies have shown that a deficiency of E-cadherin-mediated adhesion junction may lead to the release and nuclear localisation of β-catenin. This would activate the canonical Wnt signalling pathway, a contributor for carcinogenesis in several malignancies, including CRC( Reference Heuberger and Birchmeier 43 , Reference Konze, van Diepen and Schröder 44 ). In the present study, the expression of E-cadherin was significantly down-regulated in the MG. It was found that if the E-cadherin/β-catenin complex was disassembled, higher levels of β-catenin would be released. PA can inhibit the expression of β-catenin in a CRC animal model( Reference Yu, Liu and Li 45 ). Therefore, we speculate that after PA treatment, cleavage of E-cadherin/β-catenin complex may be partly restored by suppressing the overexpression of β-catenin and degradation of E-cadherin. In other words, PA may maintain the stability of the E-cadherin/β-catenin complex to protect the damage of the intestinal mucosal barrier.
In addition, we evaluated to what extent PA affects the expression of D-LA and LPS. D-LA is the product of intestinal bacteria, and under physiological circumstances, it is present in serum at low level. LPS, also known as endotoxin, is a toxin present on the outer membrane of certain Gram-negative bacteria. In normal circumstances, it is difficult for D-LA and LPS to traverse the intestinal mucosal barrier into the blood stream. However, when the intestinal mucosal barrier is damaged and permeability increases, serum D-LA and LPS can reach a relatively high level. Several studies suggest that D-LA can be considered as a sensitive biomarker for intestinal mucosal permeability, which can indirectly reflect damage to the intestinal mucosal barrier( Reference Tan, Yu and Yu 46 , Reference Xu, Lei and Shi 47 ). LPS could not only indirectly represent the damage of the intestinal mucosal barrier, but also induce systematic inflammation( Reference Bein, Zilbershtein and Golosovsky 48 ). In our study, serum D-LA and LPS were significantly increased in rats with CRC, which showed that their intestinal mucosal mechanical barrier was seriously damaged. After PA treatment, the levels of D-LA and LPS were down-regulated. The extent of the reduction was significantly increased with rising concentration of PA. Therefore, this suggested that PA improved intestinal barrier function.
Furthermore, damage to the intestinal barrier can promote susceptibility to CRC by activating inflammation( Reference Grivennikov, Wang and Mucida 49 ). In the present study, after observing changes in the intestinal mucosal barrier of the rats, we detected the expression of proinflammatory cytokines TNF-α, IL-1β and IL-6. These were used to monitor the inflammation process. Malfunction of the intestinal mucosal barrier can occur before inflammatory reaction during carcinogenesis( Reference Sánchez de Medina, Romero-Calvo and Mascaraque 50 ). The reduction of goblet cells can lead to the deficiency of MUC2 and TFF3, and damage to tight and adherens junctions can enhance intestinal permeability. This can induce and promote the inflammation process. In vivo and in vitro studies have demonstrated that PA has a chemopreventive action in CRC due to its anti-inflammatory property( Reference Cholewa, Parfiniewicz and Bednarek 51 – Reference Shafie, Mohd Esa and Ithnin 53 ). Our results showed that the serum expressions of TNF-α, IL-1β and IL-6 in the MG were significantly higher than those in the CG, which indicated that inflammation played a critical role in CRC. Moreover, PA could inhibit the high expression of TNF-α, IL-1β and IL-6 observed in the tumour groups, which demonstrated that PA had an inhibitory effect on the inflammation process. These results are consistent with Okazaki’s study( Reference Okazaki and Katayama 20 ).
There were some limitations in our study. Firstly, during the whole experiment period of 39 weeks, damage to the intestinal mucosal barrier and the inflammation process at certain intervals were not evaluated. Accordingly, we cannot verify whether any defect of the intestinal mucosal barrier occurred before the inflammation process. In addition, the expressions of other tight junction proteins, such as ZO-1 or occludin, were not observed. Therefore, it is our aim to design a more detailed study to understand further the pathological processes involved during the carcinogenesis of CRC.
In conclusion, our findings proved that PA improved intestinal mucosal barrier injury and inhibited the inflammation process during the occurrence of CRC. Therefore, the administration of PA may act as a promising intervention for CRC because it would help to preserve the intestinal mucosal barrier and inhibit inflammation.
Acknowledgements
The authors thank the teachers and students of the School of Public Health, Qingdao University, for the assistance.
This work was supported by the National Natural Science Foundation of China (no. 81373001).
C. L. designed the research, performed the animal experiment, analysed the data and wrote the article; C. C. and F. Y. designed the research study and processed the data; X. L. and L. C. performed the animal experiment, Western Blot and PCR experiments; Y. S. designed the research and modified the article.
The authors declare that there are no conflicts of interest.
Supplementary material
For supplementary material/s referred to in this article, please visit https://doi.org/10.1017/S0007114518001290


