


Fish are recognised as a healthy food, as they are an excellent source of high-quality protein and lipids in the human diet. Among lipids, dietary n-3 long-chain PUFA (LC-PUFA) have a range of beneficial effects in several pathological conditions, including CVD and neurological diseases, and some cancers( Reference Gil, Serra-Majem and Calder 1 – Reference Raatz, Silverstein and Jahns 7 ). The beneficial effects of fish have been generally attributed largely to the presence of n-3 LC-PUFA; however, fish provide significant levels of a number of other potentially protective components such as Se, a trace element that is essential for human health. Fish, especially marine species, are a major source of highly bioavailable dietary Se, with average contents of about 0·27 μg/g( Reference Fox, Van den Heuvel and Atherton 8 ). As a constituent of selenoproteins (SEP), Se has structural and enzymatic roles; for instance, it is an essential component of the antioxidant enzyme glutathione peroxidase (GPX) and participates in the production of thyroid hormones. It is also necessary for the proper functioning of the immune system and has been shown to give protection from some cancers( Reference Rayman 9 ). Recommendations for adequate intakes of Se are provided by the European Food Safety Authority( 10 ) and indicate that an intake of Se of 70 μg/d is required for adults, which is increased by further 10–15 μg/d for pregnant and lactating women.
Feeds for carnivorous species such as salmonids have traditionally included high proportions of fishmeal (FM) and fish oil (FO). However, the finite and limited supply of these marine ingredients, as well as the continued increase in aquaculture production, has resulted in a research for alternative raw materials for aquafeeds( Reference Bell, McEvoy and Tocher 11 – Reference Betancor, Sprague and Usher 14 ). In this context, considerable research has focused on sustainable alternatives such as terrestrial plant sources( Reference Gatlin, Barrows and Brown 15 , Reference Hartviksen, Bakke and Vecino 16 ), which have been demonstrated to be suitable for Atlantic salmon (Salmo salar L.) growth( Reference Bell, McEvoy and Tocher 11 , Reference Torstensen, Lie and Frøyland 17 – Reference Liland, Rosenlund and Berntssen 20 ). A considerable body of literature exists regarding the effect of FM/FO substitution on the n-3 LC-PUFA content of fish, although limited attention has so far been focused on the effect of this substitution on other beneficial nutrients such as Se. Se contents in plant proteins (PP) are highly variable depending on the soil composition in which the crops are grown, which varies geographically( Reference Mahalingam, Vijayalakshmi and Prabhu 21 ). For instance, in some areas of China, Finland and New Zealand, the levels of Se in the soil are very low (<0·05 parts per million (ppm)), whereas higher concentrations (>5 ppm) of this element are found in Canada, Ireland and some regions of the Western USA( Reference Aro, Afthan and Varo 22 ). In addition, Se incorporation into plants depends on other factors such as soil pH, rainfall, land contour and microbial activity( Reference Alloway 23 ). Thus, the inclusion of dietary PP as substitutes for FM, which are naturally rich in Se, may lead to a reduction in the content of this nutrient in the flesh of the farmed fish, which, in turn, will reduce its nutritional value to human consumers. In addition, Se is also an essential nutrient for fish as it is for humans. Because of the high contents of n-3 LC-PUFA in fish, which are highly susceptible to oxidation owing to their high degree of unsaturation, Se exerts a pivotal role as an antioxidant nutrient, and its deficiency results in altered oxidative status( Reference Betancor, Caballero and Terova 24 – Reference Ribeiro, Ribeiro and Saele 26 ).
Teleost fish possess the highest number of SEP of any organisms, and a total of thirty-eight have been identified in zebrafish (Danio rerio)( Reference Mariotti, Ridge and Zhang 27 ). Among them, selenoprotein K (SEPK) has a role in the immune system( Reference Verma, Hoffmann and Kumar 28 ), whereas selenoprotein N affects Ca homoeostasis( Reference Shchedrina, Everley and Zhang 29 ) and selenoprotein P (SEPP) has an antioxidant protection function( Reference Conrad, Schneider and Seiler 30 ). Moreover, transfer RNA (tRNA) selenocysteine 1-associated protein 1b (SECP43) has a major role in SEP synthesis by inserting selenocysteine into SEP( Reference Small-Howard, Morozova and Stoytcheva 31 ). The most studied SEP family is that of the antioxidant GPX, which has four members GPX1, GPX2, GPX3 and GPX4( Reference Herbette, Roeckel-Drevet and Drevet 32 ). GPX4 is a phospholipid hydroperoxidase with a unique catalytic activity protecting cell membranes as it acts on hydroperoxides derived from oxidation of phospholipids and cholesterol. This suggests that GPX4 may be an important antioxidant enzyme in marine fish that accumulate high tissue levels of LC-PUFA that are highly susceptible to oxidative damage( Reference Song, Fujimoto and Miyazawa 33 ). In addition, other antioxidant enzymes found in most fish species studied to date( Reference Rudneva 34 ) include catalase (CAT) and superoxide dismutase (SOD), which inhibit the lipid peroxidation catalytic cycle by preventing oxidation reactions, and by intercepting and inactivating the reactive intermediates( Reference Arteel and Sies 35 ).
The overarching objective of the present study was to determine how sustainable aquafeeds, with increased levels of plant ingredients, affect Se contents and metabolism in order to better understand the potential effects of this substitution on fish, as well as the human consumer. To achieve this, a long-term feeding trial was performed on Atlantic salmon from 100 to 3000 g using three increasing levels of PP and vegetable oil (VO) substitution. Levels of Se in liver, muscle, kidney, anterior intestine, gill and brain were determined. In addition, levels of thiobarbituric acid-reactive substances (TBARS), indicators of lipid peroxidation, were determined in muscle and liver. Analyses of the expression of genes of several SEP and antioxidant enzymes in liver and brain provided new insights on the potential effects of altered Se contents on SEP functions and synthesis, as well as their role in the maintenance of oxidative homoeostasis.
Methods
Experimental diets and fish
The trial was carried out in Atlantic salmon at Marine Harvest Scotland Feed Trial Unit facilities in Ardnish (Scotland, UK). Three different isolipidic (increasing from approximately 22 % at 100 g to 31 % at 3000 g) and isoproteic (decreasing from approximately 42 % at 100 g to 36 % at 3000 g) feeds were formulated by including equal amounts of FM/PP and FO/VO. Feeds contained decreasing levels of FM and FO to give low (LV), medium (MV) or high (HV) levels of substitution of marine ingredients with plant products and were fed from smolt input (about 100 g) until harvest (about 3000 g) (Table 1). Soya protein concentrate, maize and wheat gluten, pea protein and sunflower expeller were used as PP sources, and rapeseed oil was used as the VO source. The experimental feeds were formulated and produced by BioMar Ltd, and they were based on current commercial specifications (Table 1) to satisfy the nutritional requirements of salmonids, using standard commercially available feed materials and without Se supplementation. Diets were tested in triplicate pens over a period of 265 d. Replacement of FM and FO with PP and VO resulted in increased proportions of oleic acid (OA; 18 : 1n-9) and decreased percentages of EPA, DPA and DHA (Table 2). The peroxidation index (PIn) of the feeds was related to the dietary content of LC-PUFA and decreased with increasing substitution with plant products and was consistent in the different feed pellet sizes. The Se concentration was higher in the LV diet than in MV and HV diets. Dietary Se content also decreased with the progressive decline in FM levels in all feeds as pellet size increased throughout the seawater production cycle. Thus, Se concentrations were 1·2 and 0·7 µg/g in LV and HV diets, respectively, at the start of the trial, whereas they decreased to 1·0 and 0·6 µg/g in LV and HV diets, respectively, in the final pellet size before harvesting (Table 2).
Table 1 Formulation of experimental diets (all values are g/kg)

LV, MV, HV, feeds with low, medium and high levels of plant protein (PP)/vegetable oil in three feeding periods, as described in the ‘Methods’ section; LT, low temperature; FM, fishmeal.
* PP concentrates comprising soya protein concentrate, maize gluten and pea protein in a similar ratio across diets independent of fishmeal level.
† Proprietary blend of vitamins and minerals sufficient to meet nutrient requirement( 57 ).
Table 2 Proximate and fatty acid composition (percentage of total fatty acids) of the experimental feeds used in the present study
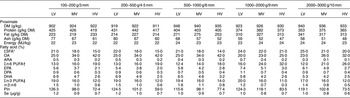
LV, MV, HV, feeds with low, medium and high levels of plant protein/vegetable oil in three feeding periods, as described in the ‘Methods’ section; DM, dry matter; OA, oleic acid; ARA, arachidonic acid; PIn, peroxidation index.
* Contains 14 : 0, 15 : 0, 16 : 0, 18 : 0, 20 : 0, 22 : 0 and 24 : 0.
† Contains 18 : 2n-6, 18 : 3n-6, 20 : 2n-6 and 20 : 3n-6.
‡ Contains 18 : 3n-3, 18 : 4n-3, 20 : 3n-3 and 20 : 4n-3.
A total of 2250 Atlantic salmons with average mean initial weight of 108·0 (sd 1·5) g were randomly distributed into nine sea pens, 5·5×5·5 m wide and 5 m deep. The seawater temperature ranged from 7·7 to 14·7°C during the experimental period. Fish were fed twice daily to apparent satiation, using a combination of automatic feeders and hand feeding, with monitoring. Feed waste was collected an hour after the end of each meal, and mortalities were checked three times per week. Fish were treated in accordance with British national ethical requirements, and the experiment was conducted under the UK Government Home Office Project Licence number PPL 60/03969 in accordance with the amended Animals Scientific Procedures Act 1986 implementing EU directive 2010/63.
Growth and survival rate
All fish were anaesthetised before handling using 60 mg/litre metacaine sulphonate (MS-222) dissolved in seawater. Bulk weighing was conducted at the start of the trial when the fish were small, whereas individual fish were weighed on an electronic top-loading balance at the end of four feeding phases from 100 to 500, 500 to 1000, 1000 to 2000 and 2000 to 3000 g to monitor growth performance. Final survival was determined by counting the total fish at the beginning and end of the trial.
Sample collection and management
At the end of each feeding phase, eight fish per pen were collected and euthanised by an overdose of MS-222. Flesh was sampled by collecting the Norwegian quality cut (NQC), the region between the dorsal and ventral fins; the steaks were skinned and boned, and they were homogenised in a large blender (R23 Robot Coupe; Ultra). The homogenate was immediately frozen and stored at −20°C before further analysis. In addition, at the final sampling (3000 g), samples of flesh (NQC), brain, head kidney, gill, anterior intestine and liver were excised, pooled per pen and frozen for total Se determination (three per treatment). Approximately 100 mg of liver and brain from two fish per pen (six per treatment) were placed in RNAlater (Sigma-Aldrich) and frozen at −20°C for total RNA extraction.
Proximate composition of diets
The nutrient compositions of experimental diets were determined by proximate analysis (Table 2). Moisture was determined by weighing three replicates of between 0·3 and 1·0 g into pre-weighed crucibles using a microbalance (AC100; Mettler Toledo) and placing them in an oven at 105°C overnight. After cooling in a desiccator for 1 h, moisture was expressed as a percentage of wet weight (w.w.). Crude protein was determined by Kjeldahl analysis (N×6·25; Tecator Kjeltec Auto 1030 analyzer; Foss). Crude fat content was determined after acid hydrolysis using a Soxhlet lipid extraction system (Tecator Soxtec 2050 Auto Extraction apparatus, Foss). Ash content was determined by heating in a porcelain crucible in a muffle furnace at 600°C overnight. All proximate analysis methods were based on those of the Association of Official Analytical Chemists( 36 ).
Lipid extraction
Total lipid of flesh and liver samples was extracted using a modified Folch method( Reference Folch, Lees and Sloane-Stanley 37 ). Samples of homogenised NQC of approximately 1 g were weighed in duplicate (0·5–1 g) into 50-ml quickfit tubes and homogenised in 20 volumes of ice-cold chloroform–methanol (2:1, v/v) using an Ultra Turrax tissue disruptor (Fisher Scientific). Potassium chloride (0·88 %) was added to the homogenised samples, mixed and centrifuged at 1500 rpm for 7 min to separate different layers. The upper aqueous phase was removed by aspiration, and the bottom layer containing the lipid extract was filtered (Whatman No. 1) and transferred to pre-weighed tubes. The lower solvent phase was evaporated on a N evaporator and desiccated overnight before re-weighing. Chloroform–methanol (2:1, v/v) containing 0·01 % (w/v) butylated hydroxytoluene (BHT) was used to resuspend total lipid at a concentration of 10 mg/ml. Total lipids were stored under N at −20°C until subsequent analysis. The accepted variance in measured lipid content between samples was ±10 %.
Fatty acid composition
Fatty acid methyl esters (FAME) were prepared by acid-catalysed transesterification of total lipid, as described by Christie( Reference Christie 38 ). Approximately 1 mg of dry total lipids was incubated at 50°C for 16 h after the addition of 1 ml of toluene and 2 ml of 1 % (v/v) sulphuric acid in methanol. The methylation reaction was terminated using 2·5 ml of 2 % aqueous KHCO3 (w/v), and FAME extraction was performed with 5 ml of iso-hexane–diethyl ether (1:1, v/v) containing 0·01 % (w/v) BHT and again with 5 ml of iso-hexane–diethyl ether (1:1, v/v) without BHT( Reference Tocher and Harvie 39 ). Methyl esters were purified by TLC by loading onto 20×20 cm plates (Merck) and were fully developed with iso-hexane–diethyl ether–acetic acid (90:10:1, v/v) as solvent system. Plates were sprayed with 1 % (w/v) I in chloroform to visualise FAME, bands were marked and scraped into test tubes and eluted from silica with 10 ml of iso-hexane–diethyl ether (1:1, v/v)+0·001 % (w/v) BHT and resuspended in iso-hexane+0·01 % BHT at a concentration of 1 mg/ml. FAME were separated and quantified by GLC using a Fisons GC-8160 (Thermo Scientific) fitted with an on-column injector and flame ionisation detector, and equipped with a 30 m×0·32 mm i.d.×0·25 µm ZB-wax column (Phenomenex). H2 was used as the carrier gas at a flow rate of 2·5 ml/min, with an initial oven thermal gradient from 50 to 150°C at 40°C/min and then to a final temperature of 225°C at 2°C/min. Peak area was processed by using Chrom-Card for Windows software (version 1.19; Thermoquest Italia S.p.A.). Individual FAME was identified by comparison of the retention time and known standards (Supelco 37-FAME Mix; Sigma-Aldrich Ltd).
Selenium determination
Total Se concentrations were measured in feeds, muscle, brain, head kidney, gill, anterior intestine and liver according to the method established in Betancor et al.( Reference Betancor, Caballero and Terova 24 ). Dried samples were weighed in three replicates between 0·04 and 0·1 g and digested in a microwave digester (MARSXpress; CEM) with 5 of 69 % pure nitric acid in three steps as follows: 21–190°C for 10 min at 800 W and then 190°C for 20 min at 800 W and finally a 30-min cooling period. The digested solution was poured into 10-ml volumetric flasks and made up to volume with distilled water. A total of 0.4 ml of this solution was added to 10 ml tubes before 10 µl of internal standard (Gallium and Scandium, 10 ppm, BDH) and 0.2 ml of methanol were added. The tube was made up to volume with distilled water, and total Se was measured in a reaction cell by inductively coupled plasma MS (XSeries2 ICP-MS; Thermo Scientific) using Ar and H2 as carrier gas.
Thiobarbituric acid-reactive substances
TBARS were determined in total lipid extracts (10 mg/ml) of liver and brain at each sampling point according to a modification of the protocol of Burk et al.( Reference Burk, Trumble and Lawrence 40 ). Briefly, 50 μl of 0·2 % (w/v) BHT in ethanol was added to 200 mg of lipid samples followed by 0·5 ml of 1 % (w/v) thiobarbituric acid and 0·5 ml of 10 % (w/v) TCA; both solutions were freshly prepared. The reagents were mixed in a stoppered test tube and heated at 100°C for 20 min. After cooling, particulate matter was removed by centrifugation at 2000 g , and absorbance in the supernatant was determined in a spectrophotometer at 532 nm against a blank sample. The concentration of TBARS, expressed as mmol malondialdehyde/g lipid, was calculated using the absorption coefficient 0·156 μm −1×cm−1.
RNA extraction and quantitative real-time PCR
Liver and muscle from six individual fish per dietary treatment were homogenised in 1 ml of TRI Reagent® (Sigma-Aldrich) RNA extraction buffer using a bead tissue disruptor (BioSpec). These two tissues were chosen because liver is the main metabolic tissue and muscle is the most abundant tissue in whole fish. Total RNA was isolated according to the manufacturer’s instructions, and quantity and quality were determined by spectrophotometry using a NanoDrop ND-1000 (Labtech International) and electrophoresis using 200 ng of total RNA in a 1 % agarose gel. Expression of genes of interest (Table 3) was determined by quantitative PCR (qPCR) from fish fed all diets. Results were normalised using reference genes, elongation factor 1α and cofilin 2, which were chosen as the most stable according to GeNorm. Complementary DNA (cDNA) was synthesised using 2 μg of total RNA and random primers in 20-μl reactions and the high-capacity RT kit without RNase inhibitor according to the manufacturer’s protocol (Applied Biosystems). The resulting cDNA was diluted 20-fold with milliQ water (Biocel water purification system; Millipore). The efficiency of the primers for each gene was previously evaluated by serial dilutions to ensure that it was close to 100 %. qPCR was performed using a Biometra TOptical Thermocycler (Analytik Jena) in ninety-six-well plates in duplicate 20-μl reaction volumes containing 10 μl of Luminaris Color HiGreen qPCR Master Mix (Thermo Scientific), 1 μl of the primer corresponding to the analysed gene (10 pmol), 3 μl of molecular biology-grade water and 5 μl of cDNA, with the exception of the reference genes, which were determined using 2 μl of cDNA. In addition, amplifications were carried out with a systematic negative control (non-template control) containing no cDNA. Standard amplification parameters contained a uracil-DNA glycosylase (UDG) pre-treatment at 50°C for 2 min, an initial denaturation step at 95°C for 10 min, followed by thirty-five cycles: 15 s at 95°C, 30 s at the annealing temperatures and 30 s at 72°C.
Table 3 Details of PCR primers used in the present study for real-time quantitative PCRFootnote *
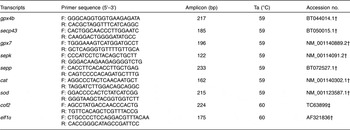
gpx4b, glutathione peroxidase 4b; F, forward; R, reverse; secp43, transfer RNA selenocysteine 1-associated protein 1b; gpx7, glutathione peroxidase 7; sepk, selenoprotein K; sepp, selenoprotein P; cat, catalase; sod, superoxide dismutase; cof2, cofilin 2; elf1α, elongation factor 1α.
* The data include sequences and annealing temperatures (Ta) for primer pairs, amplicon size and accession number.
† GenBank (http://www.ncbi.nlm.nih.gov/).
‡ Atlantic salmon Gene Index (http://compbio.dfci.harvard.edu/tgi/).
Calculations
PIn was used as an estimate of susceptibility of lipids to oxidation and was calculated using the following formula: PIn=0·025×(percentage of monoenoics)+1×(percentage of dienoics)+2×(percentage of trienoics)+4×(percentage of tetraenoics)+6×(percentage of pentaenoics)+8×(percentage of hexaenoics)( Reference Witting and Horwitt 41 ). Specific growth rate (SGR)=100×(lnWf−lnW0)/t, where Wo is the initial weight (g) and Wf the final weight (g) at time t (d). Thermal growth coefficient (TGC)=(Wf1/3−Wo1/3)×(1000/DD), where Wf and Wo are as previously addressed for SGR, and DD is the thermal sum (feeding days×average temperature). Feed conversion ratio (FCR)=(wet feed intake (kg))/(w.w. gain (kg)).
Statistical analysis
All the data were presented as means with their standard errors. Percentage data for survival rate, total lipid content and fatty acid composition were all arcsin-transformed before statistical analysis. Data were tested for normality and homogeneity of the variances with Levene’s test. Normal distribution data were analysed by one-way ANOVA followed, when appropriate, by a Tukey’s comparison of means test. Two-way ANOVA was used to determine the interaction between dietary treatments and sampling point (weight). Significant differences were accepted at P≤0·05. All statistical analyses were performed using Minitab (version 16.1; Minitab Inc.). Gene expression results were analysed using the relative expression software tool (Qiagen, http://rest.gene-quantification.info/) with efficiency correction( Reference Pfaffl, Morgan and Dempfle 42 ) to determine the statistical significance of expression ratios (gene expression fold changes) between the three treatments.
Results
Growth and survival rate
All experimental feeds were well accepted by the fish. The average survival rate of fish fed the three dietary treatments throughout the experimental period was high (>98 %) and was not affected by dietary treatments (P>0·05). In terms of growth performance, SGR and TGC were not affected by dietary treatment over the 265-d feeding period (P>0·05). However, FCR of fish fed the LV and MV diets were lower than that of fish fed the HV diet (P≤0·05; Table 4), although differences were only observed at the final sampling point (2·0–3·0 kg; Supplementary Fig. S1).
Table 4 Growth performance at the end of the experimental period (Mean values with their standard errors, n 3)

LV, MV, HV, feeds with low, medium and high levels of plant protein/vegetable oil in three feeding periods, as described in the ‘Methods’ section; SGR, specific growth rate; TGC, thermal growth coefficient; FCR, feed conversion ratio.
a,b Mean values with unlike superscript letters were significantly different as determined by one-way ANOVA followed by Tukey’s test (P<0·05).
Nutritional composition of muscle and liver
Increasing inclusion of plant ingredients in the diets had no significant effect on the lipid content of salmon muscle (flesh) within each sampling period (P>0·05; Table 5). In addition, flesh lipid levels of fish fed all three dietary treatments tended to increase with increasing fish weight, although size did not influence total lipid deposition (Table 6). The total lipid content in flesh was lowest at the 1000-g sampling point at 8·0–9·0 % (w.w.), and it was highest at 11·3–12·7 % (w.w.) in harvest size (Table 5), albeit not significant (P>0·05). Fatty acid compositions of the flesh were influenced by those of the diets; OA increased, whereas EPA and DHA were significantly reduced with increased inclusion of PP and VO in the feeds (P≤0·05; Table 5). Furthermore, the n-3:n-6 PUFA ratio of flesh in each feeding phase tended to decrease with increasing inclusion of plant ingredients, although significant differences were only present for 2 and 3 kg of fish (P≤0·05; Table 5). The n-3:n-6 PUFA ratio was also related to weight gain, with a tendency to increase with increasing weight in fish fed the LV diet, whereas it decreased with increasing weight in fish fed the MV and HV diets (P≤0·05; Table 5). Thus, the ratio increased in fish fed the LV diet, as the dietary oil had high FO (high n-3 LC-PUFA), whereas the MV and HV diets had higher n-6 PUFA and so the n-3:n-6 ratio declined as dietary lipid was accumulated in the flesh.
Table 5 Selected fatty acid compositions, peroxidation index (PIn) and thiobarbituric acid-reactive substance (TBARS) content of the flesh (Norwegian quality cut (NQC)) of Atlantic salmon at 1000, 2000 and 3000 g fed three experimental feeds with reducing levels of fishmeal and oil and increasing levels of vegetable oil and meal (Mean values with their standard errors, n 3 for fatty acids; n 6 for TBARS)

LV, MV, HV, feeds with low, medium and high levels of plant protein/vegetable oil in three feeding periods, as described in the ‘Methods’ section; OA, oleic acid; ARA, arachidonic acid; MDA, malondialdehyde.
a,b,c Mean values within a row with unlike superscript letters were significantly different among diets for a given sampling point. Statistical differences were determined by one-way ANOVA with Tukey’s comparison test (P<0·05).
* Contains 14 : 0, 15 : 0, 16 : 0, 18 : 0, 20 : 0, 22 : 0 and 24 : 0.
† Contains 18 : 2n-6, 18 : 3n-6, 20 : 2n-6 and 20 : 3n-6.
‡ Contains 18 : 3n-3, 18 : 4n-3, 20 : 3n-3 and 20 : 4n-3.
Table 6 Effects of the dietary treatment, fish weight and their interaction on flesh and liver selected fatty acids, peroxidation index (PIn) and thiobarbituric acid-reactive substances (TBARS) of Atlantic salmon fed increasing substitution levels of vegetable oil and meal

W, weight; D, diet; OA, oleic acid; ARA, arachidonic acid.
* P<0·05; ** P<0·01; *** P<0·001.
In contrast to muscle, liver total lipid content did not increase with time; indeed, a decrease in the fat content was observed, particularly in fish fed diets with high levels of substitution, although significant differences were only found in 2 kg of fish (HV; P≤0·05; Table 7). No differences in the fatty acid profile were found in 1 kg of fish among the three different dietary treatments, although clear differences were found at the other two sizes. In this sense, and similar to flesh, inclusion of high levels of plant ingredients led to increased levels of OA and n-6 PUFA, whereas n-3 LC-PUFA decreased (P≤0·05; Table 7). The factor ‘diet’ had a marked effect on the fatty acid profile of both tissues, affecting all the studied fatty acids (Table 6). In addition, the factor ‘size’ had a greater effect on liver than on flesh, affecting all of the evaluated fatty acids except total SFA and n-3:n-6 ratio (Table 6). An interaction between size at sampling and dietary treatment on total lipids and fatty acid profile only occurred for n-3:n-6 ratio for flesh and total n-6 PUFA and EPA for liver (Table 6).
Table 7 Selected fatty acid compositions, peroxidation index (PIn) and thiobarbituric acid-reactive substance (TBARS) content of the liver of Atlantic salmon at 1000, 2000 and 3000 g fed the three experimental feeds with reducing levels of fishmeal and oil and increasing levels of vegetable oil and meal (Mean values with their standard errors, n 3 for fatty acids; n 6 for TBARS)

LV, MV, HV, feeds with low, medium and high levels of plant protein/vegetable oil in three feeding periods, as described in the ‘Methods’ section; OA, oleic acid; ARA, arachidonic acid; MDA, malondialdehyde.
a,b,c Mean values within a row with unlike superscript letters were significantly different among diets for a given sampling point. Statistical differences were determined by one-way ANOVA with Tukey’s comparison test (P<0·05).
* Contains 14 : 0, 15 : 0, 16 : 0, 18 : 0, 20 : 0, 22 : 0 and 24 : 0.
† Contains 18 : 2n-6, 18 : 3n-6, 20 : 2n-6 and 20 : 3n-6.
‡ Contains 18 : 3n-3, 18 : 4n-3, 20 : 3n-3 and 20 : 4n-3.
Tissue selenium content
Increased inclusion of plant ingredients had significant effects on Se concentrations in all the studied tissues (Fig. 1(A)). Liver had the highest average Se content (3·09 μg/g), followed by head kidney (0·99 μg/g) and intestine (0·49 μg/g), whereas brain and gill displayed the lowest contents (0·26 and 0·16 μg/g, respectively). There was a strong correlation between dietary Se content and the concentration of this trace element in the different tissues. This was particularly true for liver, head kidney and brain, in which differences were found in Se contents between fish fed the MV and HV diets, whereas in gills and intestine these differences were not as obvious (Fig. 1(A)). Both factors, size at sampling and diet influenced the flesh Se content, although an interaction between both factors was also evident, albeit not as significant (P=0·025). Se content of the flesh over the entire growth cycle reflected dietary content of Se, with decreased Se content in fish fed diets with higher levels of terrestrial plant ingredients. In addition, interaction was found between dietary treatment and duration of feeding in tissue Se concentrations (P≤0·05). The amount of Se in flesh decreased (P≤0·05) with increasing fish weight, which is in agreement with reduced Se levels in the diets, with the average Se content in fish at the 1000-g sampling point being 0·45 µg/g in fish fed the LV diet, whereas at harvest size the level was 0·29 µg/g in flesh of fish fed the lowest substitution levels (LV; Fig. 1(B)).
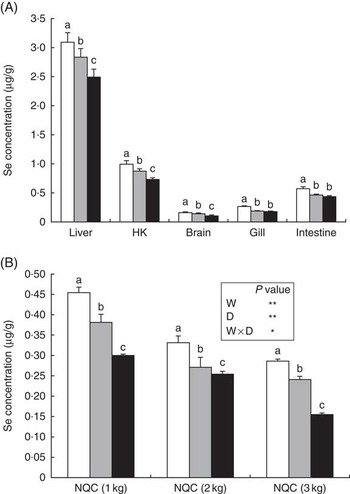
Fig. 1 Selenium content (µg/g) in liver, head kidney (HK), brain, gill and anterior intestine of Atlantic salmon fed diets with differing contents of plant protein (PP)/vegetable oil (VO) after 9 months of feeding (3000 g) (A), and in flesh of fish fed the three dietary treatments at each sampling point (B). Values are means, with their standard errors represented by vertical bars. a,b,c Mean values with unlike letters were statistically significant between the three dietary groups at the final time point of finishing feeding period identified by one-way ANOVA. The inset table presents P values for the effect of weight (W), diet (D) and their interaction of the selenium content of the flesh: * P<0·05; ** P<0·01. NCQ, Norwegian quality cut; ![]() , feed with low levels of PP/VO (LV);
, feed with low levels of PP/VO (LV); ![]() , feed with medium levels of PP/VO (MV);
, feed with medium levels of PP/VO (MV); ![]() , feed with high levels of PP/VO (HV).
, feed with high levels of PP/VO (HV).
Thiobarbituric acid-reactive substance content and peroxidation index in flesh and liver
Analysis of lipid peroxidation products in liver and muscle showed differences between the two tissues and among dietary treatments. Muscle exhibited higher TBARS content than liver for all diets and sampling points (P≤0·05; Tables 5 and 7). For both tissues, TBARS increased from 1000 to 2000 g fish, although TBARS values were reduced in 3000 g of fish (P≤0·05; Tables 5 and 7). In liver, no differences were observed between fish fed the LV and MV diets (P=0·061), and 1000 g of fish only displayed differences between fish fed the MV and HV diets (P≤0·05; Table 7). Conversely, flesh of 1000 g of fish fed LV feeds did not show differences in TBARS content with HV-fed fish (P≤0·01; Table 5). Furthermore, fish fed the LV diet had the highest TBARS contents at 2000 and 3000 g. In contrast, TBARS contents were correlated with tissue PIn and DHA contents both in flesh and liver (Tables 5 and 7). The higher dietary plant ingredient levels led to decreased contents of LC-PUFA that translated to lower peroxidation risk, and thus lower levels of lipid peroxidation products (TBARS). No interactions between fish size and diets were observed in either tissues for PIn and TBARS, whereas diet did influence these values (Table 6). Fish size influenced PIn and TBARS contents in liver but not in flesh (Table 6).
Gene expression in liver and brain
Differing levels of plant ingredients did not elicit a differential response in the studied genes in liver (P>0·05; Fig. 2), whereas significant differential expression of some of the genes was observed in brain (Fig. 3). Generally, brain showed higher expression of both SEP and oxidative stress-related genes than liver. The general pattern of SEP gene expression in both tissues was up-regulation with increased dietary plant ingredients. Thus, salmons fed the LV diet showed the lowest expression of glutathione peroxidase 4b (gpx4b) (P=0·04) in brain when compared with fish fed MV and HV diets, whereas glutathione peroxidase 7, sepp and sepk showed variable expression with no clear dietary effects on the expression of these genes in either tissue (P>0·05; Fig. 3). With oxidative stress-related genes, both cat and sod showed variable expression in brain and liver, and the only statistically significant difference was lower sod gene expression in brain of fish fed the LV diet (P=0·043). In addition, secp43 also showed the lowest expression in brain when fish were fed the LV diet (P=0·028; Fig. 2 and 3).

Fig. 2 Selenoprotein and other antioxidant stress gene expression measured by quantitative PCR in Atlantic salmon liver after 9 months of feeding (3000 g). Diets LV, MV and HV represent feeds with increasing levels of low, medium and high levels plant protein/vegetable oil in three feeding periods, as described in the ‘Methods’ section. Data are normalised expression ratios of the expression of these genes fed different diets in relation to fish fed the LV diet. Values are means (n 6), with their standard errors represented by vertical bars. sepk, selenoprotein K; sepp, selenoprotein P; secp43, transfer RNA selenocysteine 1-associated protein 1b; gpx4b, glutathione peroxidase 4b; gpx7, glutathione peroxidase 7; cat, catalase; sod, superoxide dismutase.

Fig. 3 Selenoprotein and other antioxidant stress gene expression measured by quantitative PCR in Atlantic salmon brain after 9 months of feeding (3000 g). Diets LV, MV and HV represent feeds with increasing levels of low, medium and high levels plant protein/vegetable oil in three feeding periods, as described in the ‘Methods’ section. Data are normalised expression ratios of the expression of these genes fed different diets in relation to fish fed diet LV. Values are means (n 6), with their standard errors represented by vertical bars. a,b,c Mean values with unlike letters were statistically significant between the three dietary group identified by one-way ANOVA. sepk, selenoprotein K; sepp, selenoprotein P; secp43, transfer RNA selenocysteine 1-associated protein 1b; gpx4b, glutathione peroxidase 4b; gpx7, glutathione peroxidase 7; cat, catalase; sod, superoxide dismutase.
Discussion
The current increasing substitution of high levels of dietary marine ingredients by terrestrial plant products in aquafeeds because of sustainability and availability issues may lead to altered nutritional value of the final farmed fish products. A large body of data are available regarding the effect of substitution of FM and FO by plant products on the n-3 LC-PUFA content of fish flesh in several species( Reference Menoyo, López-Bote and Obach 43 – Reference Hixson, Parrish and Anderson 45 ). Nevertheless, fish provide many other key nutrients components including vitamins D and B12, I, taurine and Se, whose levels could be affected by the origin of the raw materials used in the formulation of aquafeeds. In the present report, we focused on the effect of inclusion of plant ingredients on Se status in Atlantic salmon, because fish is an ideal package to deliver this essential micronutrient to human consumers. In addition, a reduction in the intake in certain nutrients may lead to adverse health status of the fish itself.
In the present study, increasing levels of plant ingredients in feeds led to decreased concentrations of Se in all the studied tissues in salmon. Six tissues including liver, brain, gill, head kidney, intestine and muscle were chosen in the present study based on the different roles they play in the absorption and incorporation of Se, as well as in biosynthesis of SEP. Fairweather-Tait et al.( Reference Fairweather-Tait, Bao and Broadley 46 ) indicated that liver is the primary organ involved in Se metabolism, where SEPP is synthesised before uptake by kidney and brain via the apoE receptor 2 and megalin. The results of the present study showed that the highest Se content was found in the liver (3·09 µg/g) of fish fed the LV diet, slightly higher than levels reported in a previous study (2·33 µg/g)( Reference Lorentzen, Maage and Julshamn 47 ). Furthermore, the Se content of liver was three and seven times higher in comparison with the kidney and muscle, respectively, whereas the lowest Se concentrations were found in brain and gill. This is in agreement with Burger et al.( Reference Burger, Jeitner and Donio 48 ) who indicated that levels of Se were similarly low in brain and gill of bluefish (Pomatomus saltatrix), but in the previous study the highest Se content was found in head kidney.
It was noteworthy that increased inclusion of PP and VO in the diets markedly reduced the Se content in flesh of fish fed the HV diets at all three sampling points. Se concentration in flesh of fish fed the HV diet was 2-fold lower than fish fed the LV diet after the 9-month feeding period. The present study showed that a portion of fish (130 g) of the commercial size (3 kg) fed the LV diet can supply 28·6 µg of Se, which covers 41 % of the recommended daily intake of Se. In contrast, a 130-g portion of fish fed the HV diet can supply only 22 % of the recommended Se intake. Despite the reduction in flesh Se content, salmon could still contribute highly to the overall Se intake for humans. For instance, in the UK, one hen egg (60 g) provides only 6·6 μg of Se (9·4 % of the recommended intake), and 100 g of bread contains only 9 μg of this essential micronutrient (12·8 % of the recommended intake)( Reference Reiley 49 ). This highlighted that substitution of marine ingredients by terrestrial plant products leads to a substantial decrease in Se in flesh, reducing the ability of farmed fish to supply an adequate Se dose to human consumers. Therefore, it would be interesting to study the possible restoration of Se content by returning fish to a ‘finishing’ diet containing higher levels of FM and FO for a period of time before harvest, as has been shown for n-3 LC-PUFA( Reference Bell, Tocher and Henderson 50 – Reference Trushenki, Lewis and Kohler 52 ). Alternatively, the supplementation of aquafeeds with organic sources of Se (Se-enriched yeast), less likely to cause toxicity than inorganic sources, could be used as a measure to maintain adequate Se levels in salmon flesh, as shown for several other fish species( Reference Cotter, Craig and McLean 53 – Reference Le and Fotedar 56 ). In addition, the use of processed animal proteins such as poultry by-product meal with an average Se content of approximately 0·78 mg/kg( 57 ) could supply Se of high digestibility for aquafeeds. In addition, it was perhaps surprising to observe a reduction in Se contents in muscle as fish size increased. However, previous studies have shown that in certain marine fish species such as yellowfin tuna (Thunnus albacares) or windowpane flounder (Scopthalmus aquosus) a significant negative correlation exists between muscle Se contents and fish size( Reference Burger and Gochfeld 58 ), similar to that found in the present study. Although dietary Se content reduced slightly with increasing pellet size, levels in feeds used during the periods in which samplings were performed (from 500 to 3000 g) did not vary in LV feeds (1·0 μg/g), indicating that the reduction in Se in the different tissues was mainly related to fish size/age.
The use of high levels of terrestrial plant products did not cause any noticeable adverse effects on fish physiology. Fish grew adequately on diets with high substitution levels, and only FCR was slightly increased in fish fed the HV diet. One of the first symptoms of Se deficiency in fish is reduced growth, which was not observed in the present study with increased dietary terrestrial plant ingredients. Similarly, a limited response was observed in the expression of several SEP and oxidative stress-related genes. Differences were only found in the expression of secp43 and antioxidant enzymes gpx4b and sod in brain, whereas more stable expression was observed in the liver. This different pattern of expression could indicate that fish develop tissue-specific adaptive responses to protect cells against oxidative stress, as suggested previously( Reference Oruc, Sevgiler and Uner 59 ). In this sense, brain is a tissue rich in n-3 LC-PUFA( Reference Tocher and Harvie 39 , Reference Bell and Tocher 60 , Reference Nieminen, Westenius and Halonen 61 ), with naturally low Se contents, as shown in this study, and thus it is more prone to suffering peroxidation. In agreement, a study in Manchurian trout (Brachymystax lenok) showed that brain together with gills were the tissues most sensitive to oxidative damage( Reference Zhang, Mu and Xu 62 ). Up-regulation of the expression of the antioxidant enzyme sod in fish fed the diets with lowest Se contents may indicate enhanced enzymatic antioxidant protection to compensate for the deficiency in this essential micronutrient. On the other hand, a recent study in rainbow trout (Oncorhynchus mykiss) found up-regulation of gpx1a, another gpx isoform, in the liver and kidney of fish fed low dietary organic Se in comparison with fish fed higher levels of this mineral( Reference Pacitti, Lawad and Sweetman 63 ). Up-regulation of gpx4 was also observed in chicken fed low Se feeds, although the reason for up-regulation was not clear and found to be tissue and species specific( Reference Zoidis, Pappas and Georgiou 64 ).
On the other hand, tRNA[ser]sec (SECP43) is a key player in orchestrating the interactions and localisations of factors involved in SEP biosynthesis by increasing selenocysteine incorporation and SEP mRNA levels( Reference Small-Howard, Morozova and Stoytcheva 31 ). In the present study, higher expression of this gene was observed in brain of fish fed diets with high substitution levels and thus lower Se contents, which could indicate an up-regulation in the biosynthesis of new SEP. Although in mammals transcriptional changes in the brain in response to Se are rare( Reference Zhang, Zhou and Schweizer 65 ), some studies in fish brain have found differential expression when Se was supplemented to the diet. For instance, Benner et al.( Reference Benner, Drew and Hardy 66 ) found increased expression of secp43 in brain with increased dietary Se supplementation in zebrafish. This contrasted with the results obtained in the present study, in which the lowest Se levels induced increased expression in secp43. This difference could be related to the different dietary Se levels used in these studies, being lower in the present study, which may indicate that both low and supranutritional levels trigger activation of the synthesis of SEP. Besides, the level of n-3 LC-PUFA and PIn in feeds appears to have an effect on secp43 expression. In a recent study in zebrafish fed diets of high and low oxidation risk, down-regulation was observed in hepatic secp43 expression when fish were fed a high-DHA/high-oxidation risk diet( Reference Betancor, Almaida-Pagán and Sprague 25 ). This is in agreement with the present study, in which down-regulation was observed in fish fed the feed with highest DHA level. Therefore, transcriptional or post-transcriptional regulation of SEP by LC-PUFA is a possibility, as was shown in vitro for GPX1 and GPX4( Reference Wahle and Rotondo 67 , Reference Sneddon, Wu and Farquharson 68 ). Furthermore, the lack of effect in the expression of the other studied SEP may indicate that not all respond in the same way when Se levels are altered, with a hierarchy existing as described previously in mammals( Reference Schomburg and Schweizer 69 ). In the case of brain, SECP43 appears to have priority in this tissue over the other studied SEP, resulting in them responding earlier to alterations in Se levels. The lack of effect on SEP expression observed in liver could be attributed to variations among SEP and tissues in response to Se, which has been shown in mammals( Reference Hesketh 70 ).
Although antioxidant properties of Se are widely recognised both in mammals and in fish( Reference Rayman 9 ), in the present study, decreased levels of dietary Se did not lead to increased levels of TBARS, an indicator of lipid oxidation, in liver or flesh. However, inclusion of terrestrial plant ingredients in aquafeeds also leads to decreased contents of LC-PUFA, not allowing us to check a direct effect of Se on TBARS. The reduction in these highly unsaturated fatty acids, highly susceptible to oxidation, can increase the stability of the tissues to peroxidation, as indicated by the PIn. These results are in agreement with previous studies in rainbow trout and Atlantic salmon, in which replacement of FO with VO reduced the formation of primary oxidation products such as lipid hydroperoxides( Reference Timm-Heinrich, Eymard and Baron 71 ) or TBARS( Reference Menoyo, López-Bote and Bautista 72 ). Other studies have not found differences in oxidative stability in salmon muscle when FO was substituted by VO( Reference Menoyo, López-Bote and Obach 43 ), or they have found lower oxidation rates in VO-fed fish than in FO-fed ones( Reference Hesketh 73 ), which indicates that the presence of other antioxidant nutrients such as α-tocopherol or carotenoids may be more critical for oxidative stability in flesh than the degree of unsaturation of the feeds or Se levels in the flesh.
Overt Se deficiency in humans has been associated with dilated cardiomyopathy, skeletal muscle myopathy, osteoarthropathy, cretinism, reduced immune function, some cancers and viral diseases( Reference Rayman 74 ). In the UK, the daily Se intake is estimated to be about 29–39 μg/d( 75 ), which is lower than the RDA. Therefore, individuals are encouraged to consume foods with high Se content such as salmon. The present study demonstrated that, although reduced levels of FM/FO in feeds did not result in any difference in fish performance or health, it did reduce the n-3 and n-6 LC-PUFA contents, as well as Se levels in Atlantic salmon, potentially affecting the nutritional value of farmed products. Therefore, the present study highlights that even if fish Se requirements are satisfied in diets with high levels of plant ingredients, the Se content will be reduced to human consumers such that their Se intake can be almost halved when high levels of plant ingredients are used.
Acknowledgements
This research was funded by Biomar AS.
The authors’ contributions are as follows: M. B. B. participated in the sampling, performed some of the analysis and participated in the writing of the manuscript; T. M. C. D. performed part of the analysis and participated in the writing of the manuscript; J. W. and T. M. designed the study and participated in the writing; P. J. C. and D. R. T. were involved in data interpretation and edited the manuscript. All authors read and approved the final manuscript.
None of the authors has any conflicts of interest to declare.
Supplementary Material
For supplementary material/s referred to in this article, please visit http://dx.doi.org/doi:10.1017/S0007114516000416


