


Dairy goats are reared around the world and serve as an essential source of milk and have also taken on agricultural, economic and even cultural roles since ancient times(Reference Dong, Xie and Jiang1,Reference MacHugh and Bradley2) . Besides their value as domestic animals, goats are now applied as animal models for biomedical research, to investigate the genetic basis of complex traits and the transgenic production of peptide medicines(Reference Ebert, Selgrath and DiTullio3,Reference Luikart, Gielly and Excoffier4) . With an increasing demand for dairy products, great progress has been made in the study of lactation ruminants, which has improved the theoretical basis of nutrition and physiology and solved many industrial problems(Reference Baumgard, Collier and Bauman5). The milk production of ruminant animals depended on various factors including genetic background(Reference Heise, Liu and Stock6), metabolic status(Reference Wu, Sun and Xue7) and health status(Reference Vanacker, Girard and Blouin8). These findings provided detailed fundamental knowledge for improving lactation performance of lactating ruminants.
Oxygen is the spring of life and plays an important role in numerous biological processes in all mammalian animals. Dysfunctionality in oxygen homoeostasis would lead to diseases, including organ ischaemia, metabolic disorders and inflammatory diseases. However, oxygen level status of dairy ruminants was often ignored due to the limited facilities. A recent study demonstrated the variation of blood oxygen pressure (pO2) in relative to neonate’s age, sex, as well as breed type, which provided more novel data for health status diagnosis in both Holstein and Buffalo calves(Reference Dillane, Krump and Kennedy9,Reference Gloria, Chincarini and Vignola10) . A study conducted on Jersey cattle indicated that animals exposed to high-altitude hypoxia may be adaptive to the environment via inflammatory homoeostasis regulation of acute phase response, coagulation system and complement system(Reference Kong, Zhou and Li11). Thus, defining the role of blood oxygen in metabolism and physiology regulation of lactating ruminants would provide novel approaches in ruminant nutrition field.
The metabolites, hormones and enzymes in the bloodstream are known to play key roles in regulating performance of lactating ruminants(Reference Mingoti, Freitas and Gandra12). Thus, some studies linked lactation traits of dairy cows with physiological and biochemical indices in the blood(Reference Bobbo, Ruegg and Fiore13). The development of blood transcriptome provided a novel way to interpret the blood homoeostasis and metabolic status of cells in the blood, which play regulatory roles in functionality of metabolic organs(Reference Cho, Yoon and Lee14,Reference Szostaczuk, Van Schothorst and Sánchez15) . In livestock field, most studies on blood transcriptome were conducted with the purpose of disease diagnosis(Reference Munyaka, Kommadath and Fouhse16,Reference Do Nascimento, Guimaraes and Dos Santos17) . The potential significance of blood transcriptome in physiological and nutritional studies, and application remained to be revealed.
To find the potential role of oxygen availability in mammary gland in milk production regulation in dairy goat, our study investigated correlation between milk production and blood gas profiles in mammary vein in lactating dairy goats fed the same diet. Moreover, we compared the differences of blood gas status, haematological profile and blood cell functionality in the milk vein of dairy goats with different milk yield.
Materials and method
Animal selection
All experimental procedures were approved by the Animal Use and Care Committee of Zhejiang University (Hangzhou, China). In the current study, seventy-five Guanzhong dairy goats were selected (body weight: 58·7 (sd 1·6) kg; days in milk: 132 (sd 16); parities: 2–3), which are neither reported clinical disease nor treated with clinical drug throughout 6 months prior to the sampling. The goats were housed in leaky flooring sheds with autodrinkers and feeding tanks. The composition of their diet met the nutritional requirements recommended by the NRC Dairy Goat Standard (2007, Table 1). The nutritional compositions were evaluated for compositions of DM, organic matter, crude protein, ether extract, non-fibre carbohydrate, acid-detergent fibre and neutral-detergent fibre(18). The study is conducted in Hangzhou (30° 27′ 3′′ N, 120° 20′ 0′′ E). During the sampling day, the highest temperature of farm was 26°C and the lowest temperature was 22°C and the average relative humidity is 56 %.
Table 1. Ingredient and chemical compositions of the basal diet (DM basis) (Mean values and standard deviations)
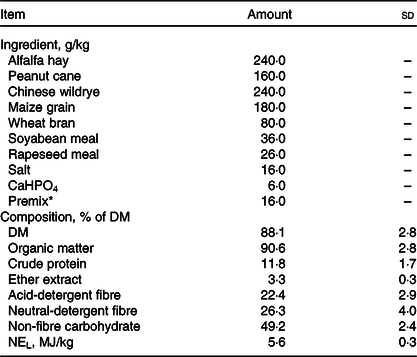
* Premix composition: 65 g mg/kg, 3·2 g Cu/kg, 6·5 g Fe/kg, 27·8 g Mn/kg, 25·6 g Zn/kg, 35 mg Se/kg, 78 mg Co/kg, 0·3 g I/kg, 55 g S/kg, 2000 kIU vitamin A/kg, 350 kIU vitamin D3/kg, 2·5 g vitamin E/kg, 10 g nicotinic acid/kg and 20 g choline/kg.
Experimental design and sample collection
Milk yield was measured for 3 consecutive days. Milk samples were collected at 06.30, 10.00 and 19.00 every day, and 50 ml of milk was mixed at a ratio of 4:3:3 to analyse the composition. Blood was collected from the mammary vein 3 h after morning feeding to determine blood oxygen concentration, physio-biochemistry and routine parameters. Another 2·5 ml sample of blood from the mammary vein of each goat was collected into a PAXgene® Blood RNA tube (Becton, Dickinson and Company).
Variable determination
Blood oxygen concentration was measured by a portable blood gas parameter analyzer (Abbott). Blood physio-biochemical analysis was performed using a 7020 Clinical Analyzer (Hitachi High-Tech Corporation). Routine blood examination was performed using an automatic haematology analyzer (Abbott). The milk composition (fat, protein, lactose, total solids, milk urea nitrogen and somatic cell count) was analysed using an automatic ultrasonic milk composition analyzer (Bentley Instruments).
RNA extraction and sequencing
Total RNA was extracted by a PAXgene® Blood RNA kit according to the manual. Measurement of RNA concentration and quality was performed by NanoDrop. The integrity of the RNA was measured with an Agilent Bioanalyzer 2100. All samples selected for sequencing had an RNA integrity number value of at least 7. A total of 1 μg of high-quality RNA from each individual was used to prepare the sequencing library. Finally, the libraries were sequenced using the Illumina HiSeq X Ten System.
Transcriptomic analysis
Fastp was used to filter out the adapter sequence and low-quality bases/reads(Reference Chen, Zhou and Chen19). Further quality assessment of sequence reads was then undertaken using FastQC version 0.11.8(Reference Andrews20). After these QC procedures were completed, Hisat2 was used to perform similarity mapping between clean data and the reference genome (Capra hircus ARS1), obtain the location information of reads on the reference genome and the feature information of sequencing samples and generate BAM files. RSeQC software was further used to evaluate the quality of transcriptome data, including sequencing saturation and RNA degradation analyses(Reference Wang, Wang and Li21). Stringtie was used to quantify the expression of genes into fragments per kilobase million(Reference Kovaka, Zimin and Pertea22). DEseq2 was used to analyse the differential expression of genes. Differentially expressed genes were defined as P < 0·05 and |Log2(Fold change)| > 1(Reference Wang, Liu and Augustino23). Kyoto Encyclopedia of Genes and Genomes (KEGG) pathway and gene ontology (GO) enrichment analyses of gene clusters were performed using WebGestalt(Reference Liao, Wang and Jaehnig24), with results exhibiting P < 0·05 considered significant. The sequencing raw data were deposited in the National Center for Biotechnology database with accession number PRJNA674665.
Validation of RNA sequencing results by RT-qPCR
The differential expressed genes (DEG) identified by RNA sequencing were validated by RT-qPCR. The RNA samples were reverse transcribed into cDNA following a method described previously(Reference Li, Loor and Liu25). The ubiquitously expressed transcript, mitochondrial ribosomal protein L39 and ribosomal protein S9 were used as reference genes after assessing their qualification using geNorm(Reference Vandesompele, De Preter and Pattyn26). The sequences of primers for the analysed genes (LDHA, COQ2, HIF1A, NOD2) are listed in online Supplementary Table S1. The relative change in mRNA for each gene was calculated by a method according to previous method(Reference Rao, Huang and Zhou27).
Statistical analysis
The dairy goats were grouped according to the difference of milk yield, and the number of repetitions needed for grouping very high and very low yield was calculated by using power analysis. Power analysis was carried out in SAS (9.21) statistical software, one-way ANOVA was used and the α value was set to 0·05. The difference between groups was analysed by Student’s t test. Correlation between indicators was carried out in SAS (9.21) statistical software, and Pearson correlation was used for calculation. Significance was defined as P < 0·05.
Results
Lactation performance of selected dairy goats with different milk yield
According to the power analysis, with high milk yield defined as more than 2·50 kg/d and low milk yield as less than 1·25 kg/d, the power value reached 0·99 with a repetition number of six (online Supplementary Table S2). We thus selected six dairy goats with low (L; body weight: 57·0(sd 1·9) kg; days in milk: 133 (sd 15); parities: 2–3) or high (H; body weight: 55·5 (sd 3·1) kg; days in milk: 130 (sd 18); parities: 2–3) milk yield for each group. As shown in Table 2, the average DM intake and intake of the nutrient compositions were not significantly different for the two groups (P > 0·05). The lactation performance of the selected dairy goats is presented in Table 3. Compared with the H-group, the L-group had lower production performance, including milk yield (P < 0·01), milk fat yield (P < 0·01), milk protein yield (P < 0·01) and lactose yield (P < 0·01).
Table 2. DM intake and intake of the nutrient compositions for dairy goats with different milk yield (Mean values with their standard errors of the mean)

H-group, selected dairy goats with high milk yield; L-group, selected dairy goats with low milk yield.
Table 3. Lactation performance of dairy goats with different milk yield (Mean values with their standard errors of the mean)
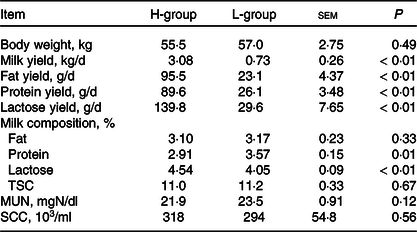
H-group, selected dairy goats with high milk yield; L-group, selected dairy goats with low milk yield; TSC, total solid content; MUN, milk urea nitrogen; SCC, somatic cell count.
Blood gas profiles of dairy goats with high and low yields
The blood gas profiles of lactating dairy goats are presented in Table 4. The ionised Ca concentrations were higher in high-yielder goats, compared with the low-yielder ones (P = 0·05). Lower carbon dioxide pressure (pCO2, P = 0·02) and higher pO2 (P < 0·05) were observed in high-yielding animals, in relative to goats with lower yields, respectively. Moreover, oxygen saturation in the blood was greater in high-yielding goats compared with low-yielding animals (P < 0·05). No significant difference was identified in other blood gas variables between goats with different milk yield (P > 0·05).
Table 4. Blood gas profiles of dairy goats with different milk yield (Mean values with their standard errors of the mean)

TCO2, total carbon dioxide; iCa, ionised calcium; pCO2, partial pressure of carbon dioxide; pO2, partial pressure of oxygen; BEecf, base excess extracellular fluid; SO2, oxygen saturation.
Expressed transcripts of dairy goats with high and low yields
From twelve samples, we obtained 37 829 376–58 520 140 clean reads per sample. Nearly 91·2 % of the reads were mapped to the Capra hircus genome, and approximately 85·8 % of the reads in every individual were uniquely mapped to the genome. The alignment information for each sample is presented in Table 5. We further performed overall transcriptome quality assessment. Based on sequencing saturation analysis (Fig. 1(a)), for each sample, as the number of sequencing reads increased, the number of detected junctions gradually increased and tended to be stable. The preliminary analysis suggested that the amount of sequencing data met the requirements of analysis.
Table 5. Summary of the mapping information for each sample
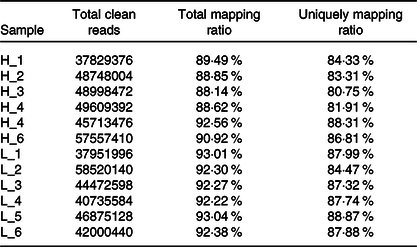
H-group, selected dairy goats with high milk yield; L-group, selected dairy goats with low milk yield.
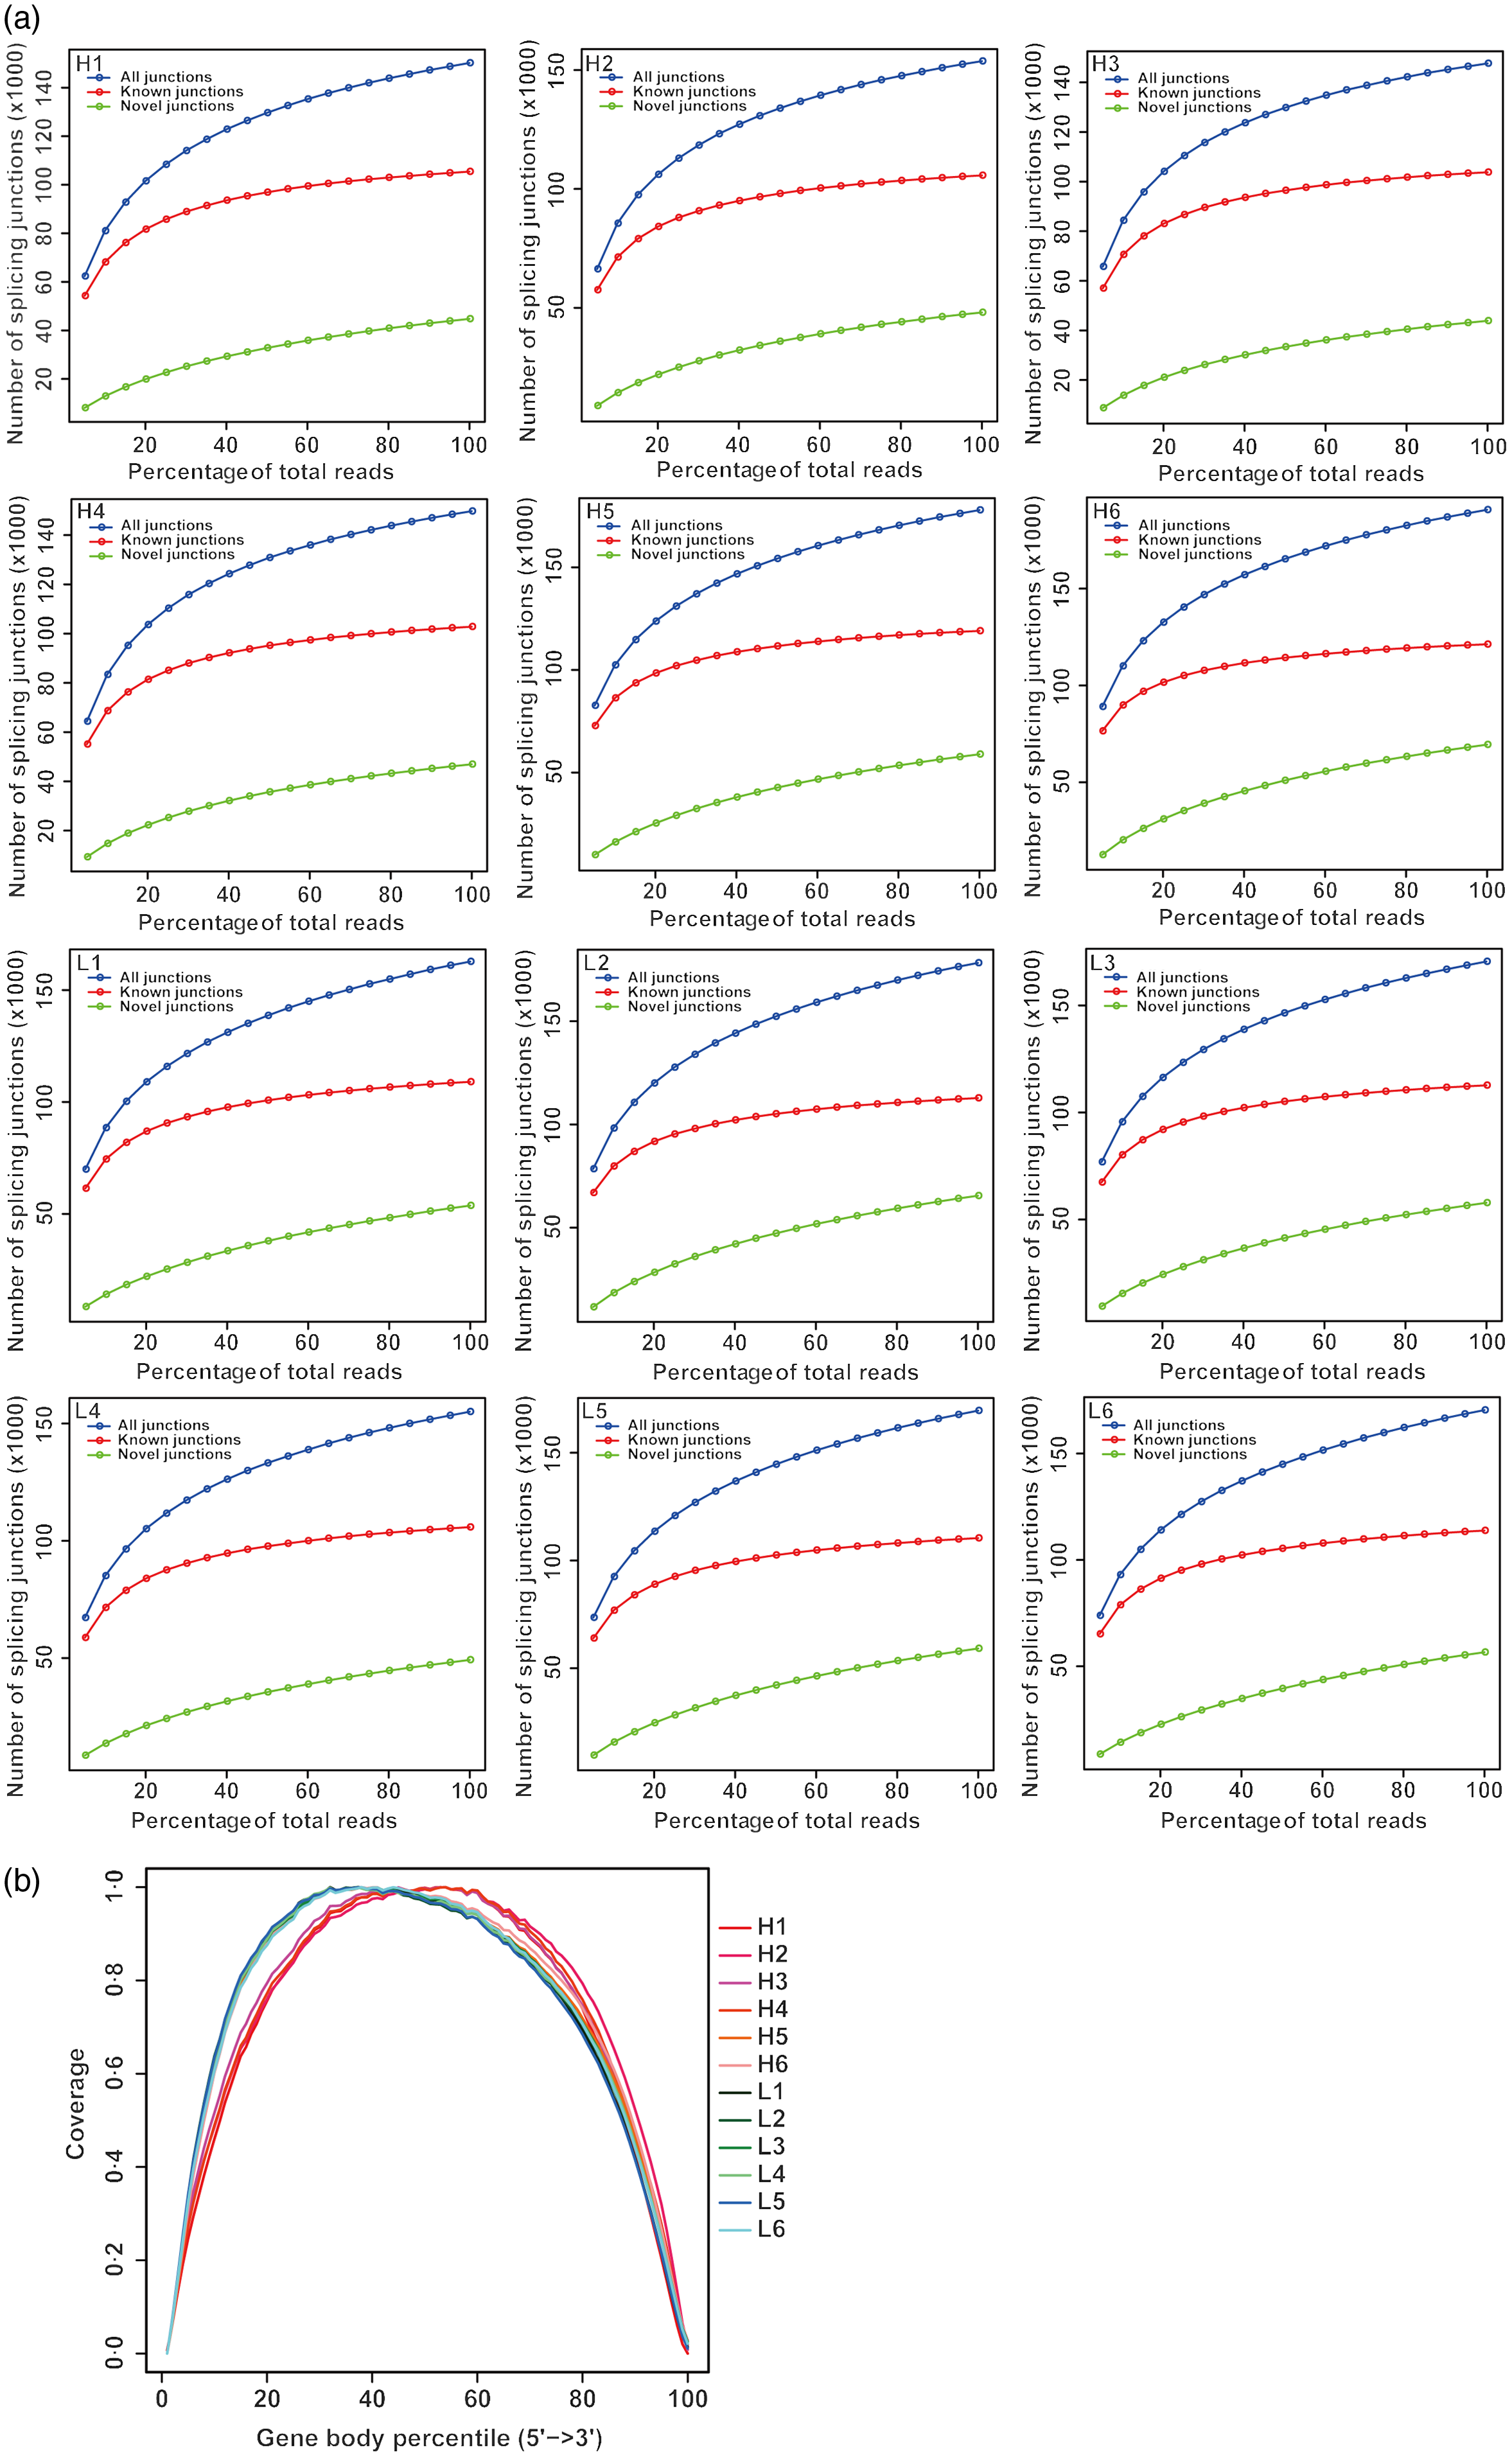
Fig. 1. Overall quality assessment of dairy goat whole blood transcriptome. (a) Sequencing saturation analysis. For each sample, the horizontal axis represents the number of Reads and the vertical axis represents the detected number of Junction (mRNA splicing). (b) RNA degradation analysis. The abscissa in the figure is the percentage of the base length of a single gene in the total base length, 0 represents the 5' end of the gene and 100 represents the 3' end of the gene. The ordinate is the sum of the number of sequences aligned to the corresponding interval on the horizontal axis of all genes. The graph shows the superposition result of all gene coverage, and the ordinate of each point in the curve represents the number of all sequences of all genes at this relative proportional position. The curve reflects whether the sequenced sequences are evenly distributed among the genes. H represents selected dairy goats with high milk yield; L represents selected dairy goats with low milk yield.
Based on RNA degradation analysis, there is no significant peak at the left and right ends (Fig. 1(b)), indicating that the sequencing results are not biased and are relatively uniform. The RNA degradation degree of each sample shows that no significant changes were observed in the 5'- and 3'-end of the gene, indicating that the degradation was not significant. Furthermore, the curves of the 5'- and 3'-end of multiple samples were similar, showing that all samples had a relatively consistent background of RNA degradation, which would not affect the subsequent analysis.
Annotation of expressed transcripts
GO and KEGG annotations were performed on the acquired genes. The GO annotation results showed that biological processes (Fig. 2(a)) were mainly enriched in the cellular process, biological regulation and the metabolic process. In the cell component profile (Fig. 2(b)), they were mainly concentrated in cell, cell part and organelle. In terms of molecular function (Fig. 2(c)), it was mainly focused on binding, catalytic activity and transcription regulator activity.

Fig. 2. Gene ontology annotation of whole blood transcriptome of dairy goats.
The KEGG results (Fig. 3) showed that organismal system enrichment of blood transcriptome was mainly in the immune, endocrine and sensory system. At the level of metabolism, functional enrichment was mainly enriched in lipid metabolism, carbohydrate metabolism, and glycan biosynthesis and metabolism. In terms of genetic information processing, its functions were mainly focused on folding, sorting and degradation, translation, and replication and repair. In the process of environmental information, functional enrichment was mainly focused on signal transduction, signalling molecules and interaction, and membrane transport. As for cellular process, functional enrichment was mainly focused on cell growth and death, transport and catabolism, and cellular community eukaryotes.
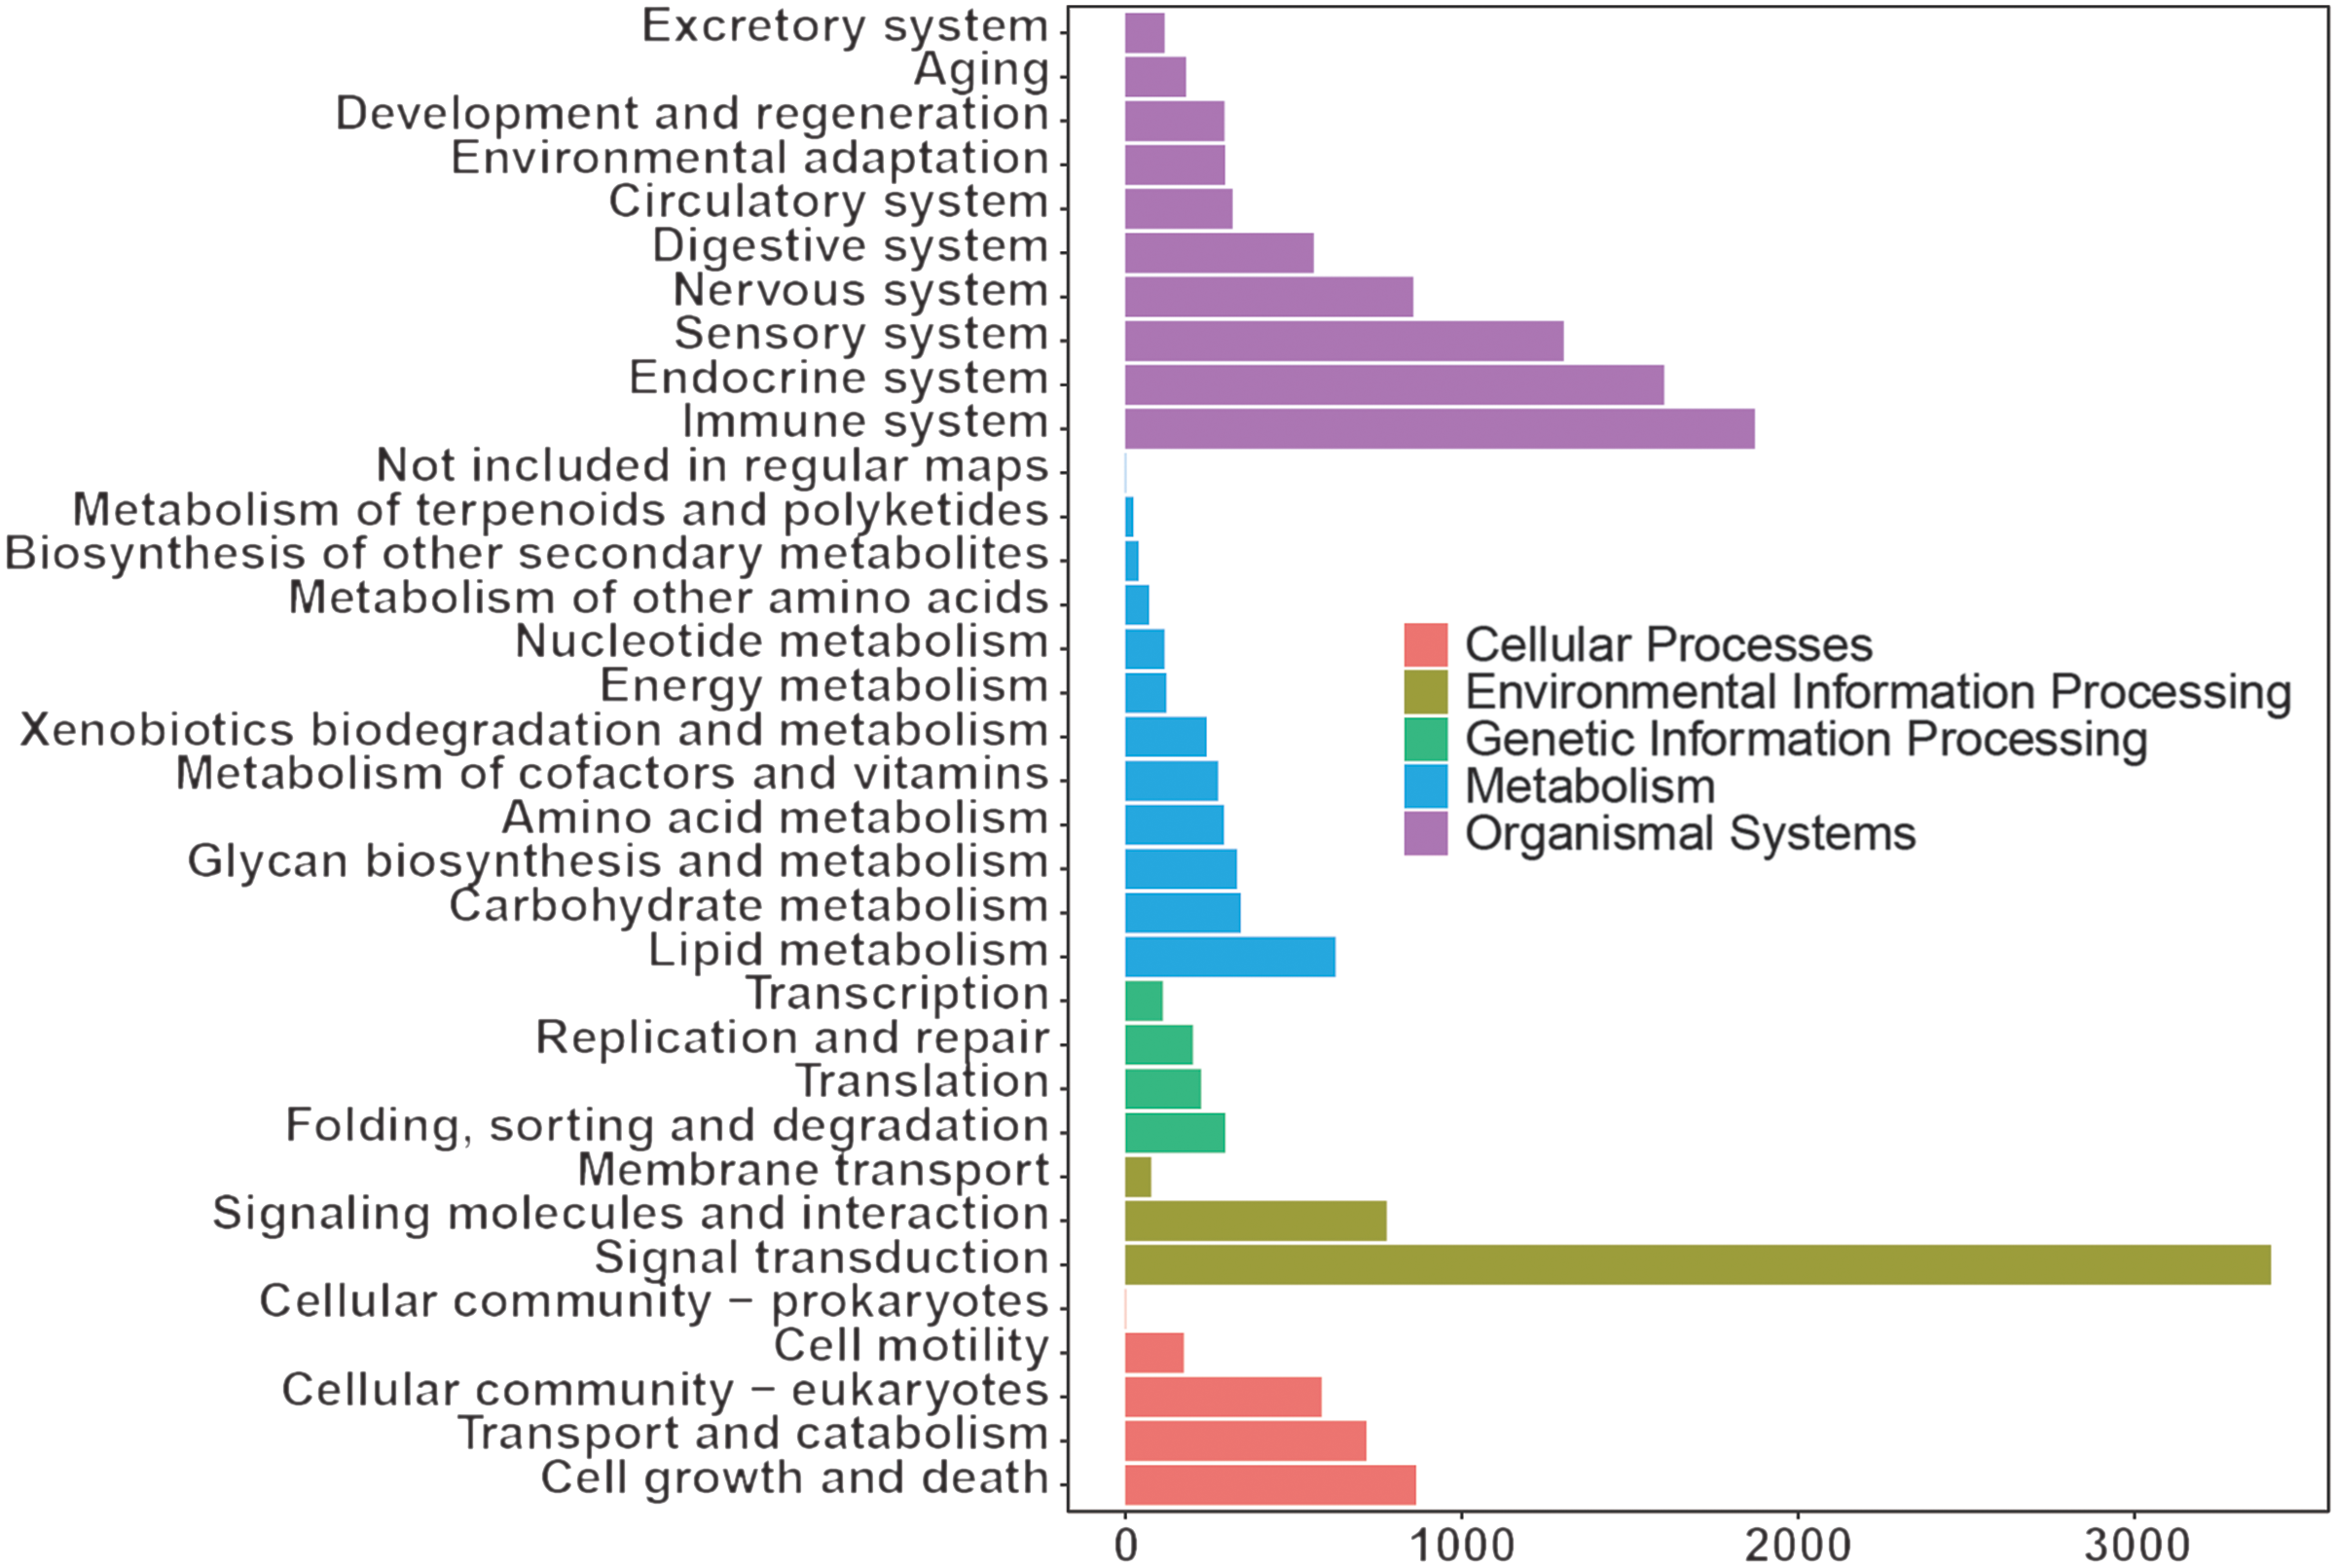
Fig. 3. Kyoto Encyclopedia of Genes and Genomes annotation of whole blood transcriptome of dairy goats.
The average expression level of all genes in individual samples was uniform (Fig. 4(a) and (b)). Principal component analysis of blood transcriptome in H- and L-group animals (Fig. 4(c)) showed significant differences in the RNA expression spectrum. To provide a better understanding of the biological mechanism of milk yield, we identified the DEG (Fig. 4(d)) between goats in the H- and L-groups. In total, 1137 up-regulated genes and 2590 down-regulated genes were observed in the blood of L-group animals compared with the H-group. A heatmap of DEG in whole-blood transcriptome was constructed, and sample clustering analysis was carried out (Fig. 4(e)), showing that DEG could form independent clustering between H- and L-group animals.

Fig. 4. Gene expression analysis of whole blood transcriptome of dairy goats with high (H) and low (L) dairy goats. (a) The average expression level of mRNA in whole blood transcriptomes of H- and L-group. (b) The average expression level of mRNA in whole blood transcriptomes of each sample. (c) Principal component analysis plot of whole blood transcriptome of each sample. (d) Gene expression at transcription level in whole blood of dairy goats with different mammary glucose utilisation. Red and green represent the genes up-regulated and down-regulated in L-group, and black represents genes with no significant expression difference between H- and L-group. (e) Cluster heatmap of differentially expressed genes in whole blood transcriptome of H- and L-group.
Functional classification of differential expressed genes
We classified the function of up-regulated and down-regulated genes (L v. H), with the particular categories focused on the GO and KEGG pathways. Based on GO term analysis, up-regulated functions in L-group (Fig. 5(a)) were mainly concerned with neutrophil-related functions (biological processes level), such as neutrophil activation, neutrophil-mediated immunity and neutrophil involved in immune response, while the predominant down-regulated functions in L-group animals (Fig. 5(b)) were concerned with mitochondria, including mitochondrion organisation (biological processes level), as well as inner membrane, protein complex and matrix of mitochondria (cell component level).

Fig. 5. Functional classification of differentially expressed genes in whole blood transcriptome of dairy goats with different milk yield. (a) Gene ontology annotation of up-regulated gene expression in the dairy goats with low milk yield (L-group) compared with dairy goats with high milk yield (H-group). (b) Gene ontology annotation of down-regulated gene expression in the L-group compared with the H-group. (c) Kyoto Encyclopedia of Genes and Genomes (KEGG) pathway annotation of up-regulated gene expression in the L-group compared with the H-group. (d) KEGG pathway annotation of down-regulated gene expression in the L-group compared with the H-group.
In terms of KEGG pathway analysis, the up-regulated metabolic pathways in L-group animals included glycolysis/gluconeogenesis, NOD-like receptor signalling pathway, Toll-like signalling pathway, NF-κB signalling pathway and HIF-1 signalling pathway (Fig. 5(c)). In contrast, the depressed signalling pathways low-yielding goats mainly included mTOR signalling pathway and VEGF signalling pathway (Fig. 5(d)).
Validation of differential expressed genes in high and low milk yielders
We further selected four DEG identified from the RNA sequencing data, COQ2, LDHA, HIF1A and NOD2, to validate their expression patterns using RT-qPCR. The results of RT-qPCR confirmed that the DEG had the same expression pattern observed with RNA sequencing (Fig. 6). This indicated that the gene expression observed in blood transcriptome between high yielders and low yielders was highly credible.

Fig. 6. RT-qPCR validation of differentially expressed genes (DEG) in whole blood transcriptome of dairy goats with high (H) or low (L) milk yield. Relative gene expression of selected DEG in RT-qPCR was presented in columns (black: H-group; grey: L-group). Transcriptomic gene expression of selected DEG was presented in dots (red: H-group; green: L-group).
Group validation
To further validate the clues from whole-blood RNA sequencing, we determined the lactate dehydrogenase activity, lactate production and pO2 in blood and performed a correlation analysis with milk yield. Lactate concentration (R 2 = 0·36, P < 0·01) and lactate dehydrogenase activity (R 2 = 0·33, P < 0·01) were negatively correlated with milk yield (Fig. 7(d)–(h)). There was a significant positive correlation between pO2 and milk yield (R 2 = 0·41, P < 0·01). These results are consistent with the greater expression of genes associated with glycolysis and hypoxia pathway in L-group animals.
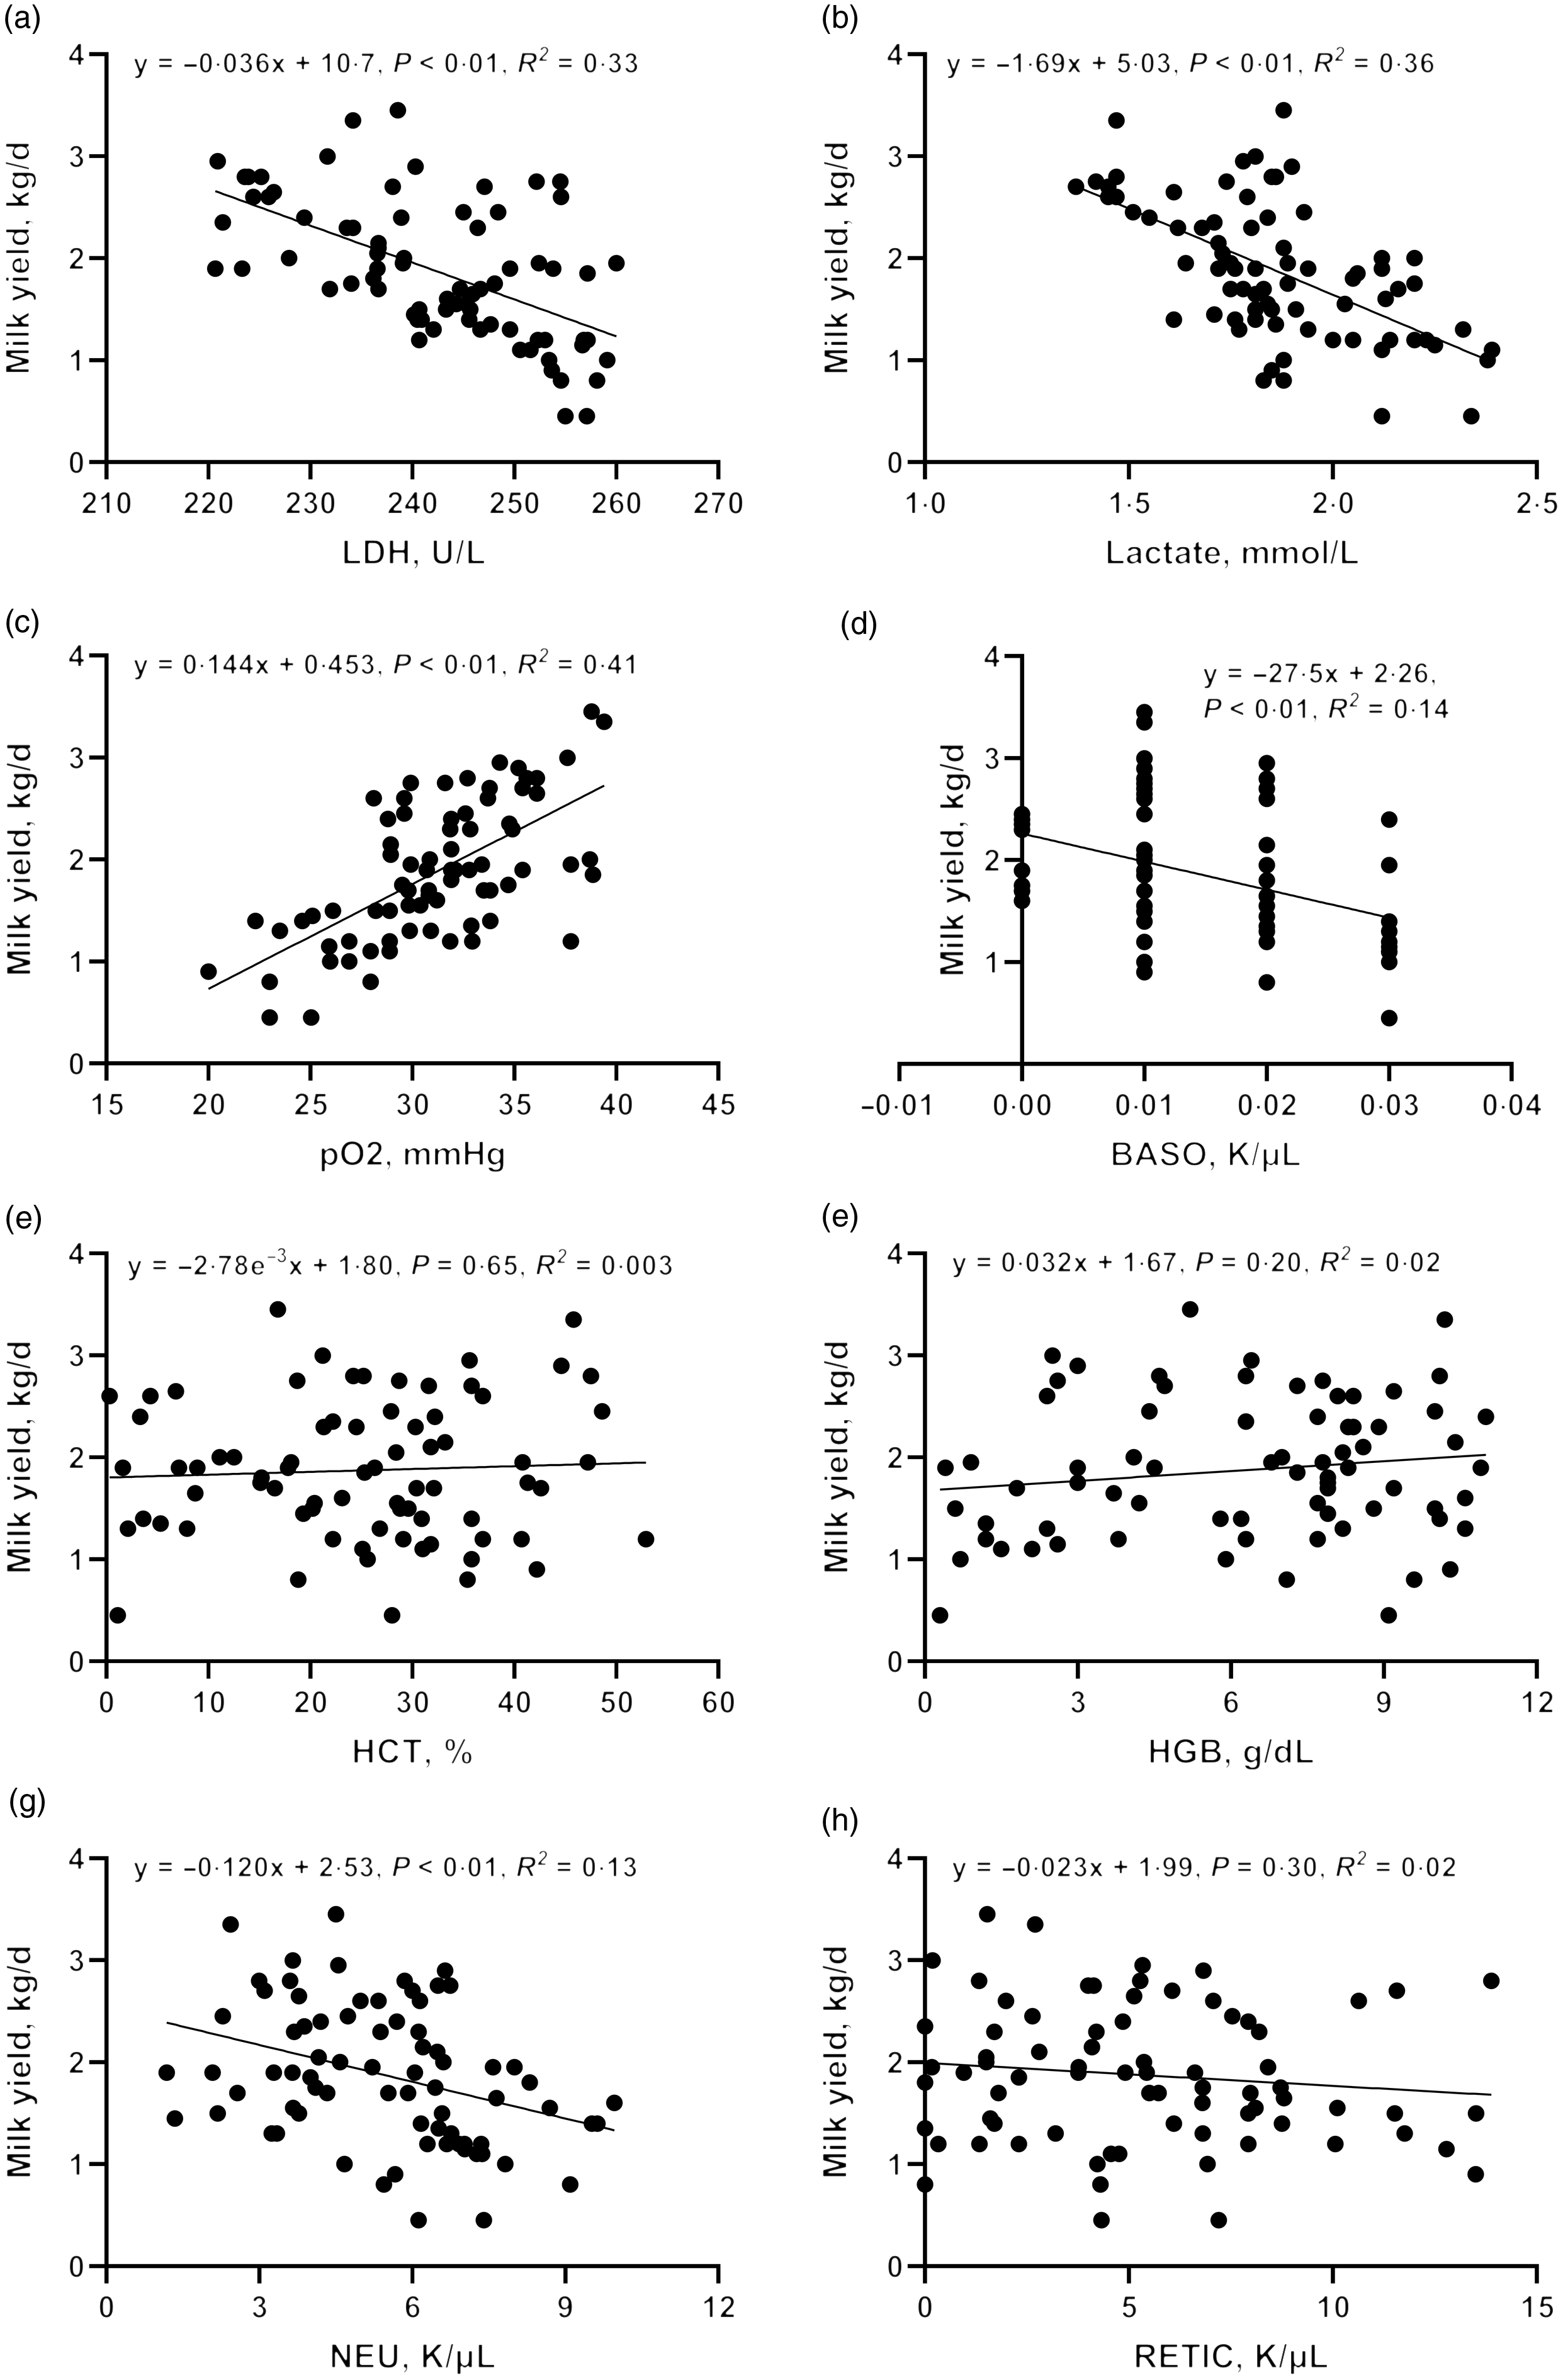
Fig. 7. Correlation between blood physiological and biochemical indicators ((a) carotid glucose; (b) mammary vein glucose; (c) mammary vein lactate dehydrogenase; (d) mammary vein lactate; (e) mammary vein β-Hydroxybutyrate; (f) mammary vein NEFA; (g) mammary vein haemoglobin; (h) arteriovenous difference of glucose] and milk yield.
Driven by immune pathways from transcriptome, we analysed the haematological parameters of dairy goats with different milk yields. Haematocrit (HCT), haemoglobin (HGB), reticulocyte count (RETIC), neutrophil count (NEU) and basophil count (BASO) of L-group were significantly higher than those of H-group (Table 6, P < 0·05). We thus performed the correlation analysis between these parameters and milk yield in the large group validation. The NEU (R 2 = 0·13, P < 0·01) and BASO (R 2 = 0·14, P < 0·01) numbers were negatively correlated with milk yield of dairy goats (Fig. 7(d)–(h)).
Table 6. Blood parameters of dairy goats with different milk yield (Mean values with their standard errors of the mean)
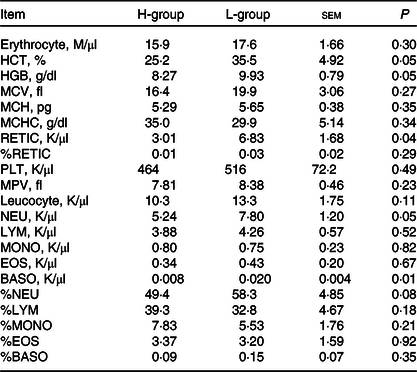
H-group, selected dairy goats with high milk yield; L-group, selected dairy goats with low milk yield; RECTIC, reticulocyte count; NEU, neutrophil count; BASO, basophil count; MCV, mean corpuscular volume; MCH, mean corpuscular hemoglobin; MCHC, mean corpuscular hemoglobin concentration; MPV, mean platelet volume; LYM, lymphocyte; MONO, monocyte; EOS, eosinophil.
Discussion
Previous studies suggested that variables of blood gas profiles, including levels of glucose, lactate, Na and pCO2, can be used to predict the absence of subacute ruminal acidosis in lactating dairy cows(Reference Li, Gozho and Gakhar28). Additionally, in neonatal calves, specific ranges of blood gas profiles, such as pCO2, would be helpful to diagnose the health status and sickness accurately in different age, sex and breed types(Reference Dillane, Krump and Kennedy9). These studies suggested that blood gas profiles would be useful tools to indicate disorders in dairy cows. In the current study, the association between milk production of dairy goats and their pO2 (positively) and pCO2 (negatively) levels in their mammary veins suggested availability of oxygen and carbon dioxide may play important roles in regulating their milk yield. Moreover, higher pO2 and lower pCO2 in the mammary vein of high-yielding animals suggested a greater available oxygen could be essential in maintaining high milk yield in ruminants. The concentrations of HCT and HGB have been considered to be important index indicating capacity of carrying oxygen by red blood count(Reference Lima, Coleta and Tanni29). Cows living in higher altitude area were greater in HCT and HGB concentrations in the blood, which could be an adaptive mechanism to lower oxygen level in the environment(Reference Wuletaw, Wurzinger and Holt30). In our study, higher HCT and HGB levels in blood of dairy goats with lower milk production could be a compensative mechanism to their lower pressure and saturation of oxygen in the mammary veins. These evidences suggested that high-yielding dairy goats were greater in circulating oxygen availability, compared with that of low-yielding ones.
Some blood parameters, such as red blood count and NEU, are reported to be sensitive to available oxygen in the bloodstream(Reference Walmsley and Whyte31,Reference Wei, Kang and Rasheed32) . Our previous study suggested that higher NEU in the blood has been recognised as an important biomarker for health status alteration, such as mastitis, in dairy cows(Reference Guan, Wang and Wang33). In our study, the similar milk somatic cell count levels across all the animals suggested that all dairy goats were in a health status. Thus, the greater NEU and neutrophil percentage in the blood may be attributed to their inhibited apoptosis rate and enhanced proliferative rate in a relatively low oxygen micro-environment(Reference Mecklenburgh, Walmsley and Cowburn34). Previous study suggested that lower glucose availability led to reduced milk lactose concentration(Reference Wang, Zhao and Zhang35). In our study, relatively lower milk lactose concentration of low-yielding goats could be attributed to their lower glucose availability in the circulation. As is known to all, increased NEU and neutrophil activation in the blood induced greater energy requirement and higher glucose consumption(Reference Kvidera, Horst and Abuajamieh36). The lower milk lactose concentrations in low-yielding animals might be attributed to the higher NEU in their blood. Moreover, oxygen deficiency led to switch ATP synthesis from aerobic manner to anaerobic manner(Reference Peek, Levine and Cedernaes37). The improved glycolysis enrichment and LDH expression in the blood RNA suggested that low-yielding goats possibly gain more ATP via anaerobic way, compared with high-yielding animals, which is consistence with other study(Reference Walmsley and Whyte31). These evidences suggested that lower oxygen availability led to alteration of haematological profile and glucose metabolic status of lactating goats, which is associated with their lactation performance.
To further understand how oxygen-mediated haematological alteration contributed to milk production, whole blood transcriptome of high- and low-yielding dairy goats is conducted. The greater enriched levels of glycolysis and HIF-1 signalling pathway in low-yielding goats could be attributed to the lower pO2 in their blood, in relative to animals with higher milk yield(Reference Tojo, Tamada and Nagamine38). Moreover, hypoxia activated expression of Toll-like receptor 4, NF-κB and NOD-like receptor protein 3 in immune cells such as macrophage(Reference Fitzpatrick, King and O’Donnell39). In the current study, greater activities of NOD-like receptor, Toll-like-receptor and NF-κB signalling pathways in the blood cells of low-yielding animals could be attributed to their lower oxygen availability. Similarly, more ATP would be synthesised via oxidative phosphorylation when oxygen in micro-environment is sufficient(Reference Rodríguez-Enríquez, Carreño-Fuentes and Gallardo-Pérez40). Thus, the lower oxidative phosphorylation enrichment in blood cells of low-yielding dairy goats could be associated with their lower pO2. Specifically, greater numbers and percentages of neutrophils in the blood of low-yielding goats could be one of the adaptive mechanisms of neutrophils in responding to oxygen deficiency in the micro-environment(Reference Walmsley and Whyte31,Reference Mecklenburgh, Walmsley and Cowburn34) . In addition to numerical alteration, immune response, immunity and activation of neutrophils can also be an efficient way to improve their functionality including neutrophil-driven matrix destruction, under a hypoxia condition(Reference Ong, Fox and Ettorre41). However, the greater NEU and higher glycolysis activities led to higher glucose consumption in the blood(Reference Watts, Howden and Morrison42,Reference Injarabian, Devin and Ransac43) , which would induce lower glucose availability in the other metabolic tissues, such as mammary glands. Thus, our study suggested that oxygen availability in the blood could be a potential milk yield regulator in ruminant animals.
Conclusion
The pO2 and pCO2 in the blood are associated with milk production in dairy goats. High-yielding animals were higher in pO2 but lower in pCO2, HCT and HGB in the blood, compared with low-yielding goats. The higher number and percentage of blood neutrophil in low-yielding goats could be one of the causes of lower milk lactose concentrations and plasma glucose, due to their high requirement to energy consumption under a relative hypoxia condition, compared with high-yielding ones. Blood transcriptome and enrichment analysis suggested that neutrophil activation and neutrophil mediated immunity, as well as signalling pathways including glycolysis, NOD-like receptor, Toll-like receptor, NF-κB and HIF-1 were enhanced in low-yielding animals, in relative to high-yielding ones, which could be associated with blood oxygen availability. Our data highlighted potential importance of oxygen availability in the blood of lactating goats, which is a potential regulatory sites for nutritional interpretation. Universality of the current phenomenon should be explored with large-scaled group of animals and causal effect of oxygen role in physiological status regulation in dairy goats should be conducted.
Acknowledgements
This work was supported by the grants from the National Natural Science Foundation of China (31930107), National Key Research and Development Program of China (2018YFD0501903) and Postdoctoral Science Foundation of China (2020M681877).
J. C.: investigation, data curation, software, writing – original draft. S. L.: investigation, data curation, software. Y. X., X. Z., L. J. and C. M. : investigation. J. L.: conceptualisation, writing – review and editing. D. W.: conceptualisation, methodology, supervision, writing – review and editing.
The authors declare that the research was conducted with no commercial or financial relationships that could be construed as a potential conflict of interest.
Supplementary Material
For supplementary material/s referred to in this article, please visit https://doi.org/10.1017/S0007114522001015


