


Current recommendations by the WHO indicate that human breast milk (BM) is the preferable source of nutrients during early life, particularly during the first 6 months of life(1), which is supported by a variety of studies indicating associations between breast-feeding and reduced risks of acute otitis media, non-specific gastroenteritis, severe lower respiratory tract infections, atopic dermatitis, asthma, obesity, type 1 and 2 diabetes, childhood leukaemia and sudden infant death syndrome(Reference IP, Chung and Raman2). Continued breast-feeding – along with complementary feeding – is recommended from 6 to 24 months of life based on associations indicating reduced risks of infectious morbidity and mortality, and obesity and diabetes in later life(Reference Victora, Bahl and Barros3).
These health effects of human BM may be related to immunological and metabolic properties of, for example, BM oligosaccharides (hMOS), Ig (particularly sIgA), lactoferrin and cytokines(Reference Andreas, Kampmann and Mehring Le-Doare4), but literature is scarce and inconclusive. Consequently, research on the exact benefits of human BM and its underlying mechanisms is still ongoing. As scientific data suggest variations in human BM composition depending on maternal and child characteristics – for example, ethnic background, maternal age(Reference Bravi, Weins and Decarli5), parity, gestational age, infant sex, time of day, stage of lactation(Reference Valentine, Morrow and Reisinger6,Reference van Sadelhoff, van de Heijning and Stahl7) , breast-feeding pattern(Reference van Sadelhoff, Mastorakou and Weenen8) and maternal dietary intake and status(Reference Bravi, Weins and Decarli5,Reference Keikha, Bahreynian and Saleki9–11) – insight in the impact of these characteristics may help to further elucidate the suggested benefits of breast-feeding in the development, growth and health of infants.
Analyses of mature BM samples of mothers having full-term babies show average macronutrient concentrations between 6·7–7·8 g/100 ml for carbohydrate, 3·2–3·6 g/100 ml for fat and 0·9–1·2 g/100 ml for protein(Reference Ballard and Morrow12). Various – but not all(Reference Boniglia, Carratù and Chiarotti13) – observational studies established that variations in macronutrient concentrations of BM may be related to maternal intake of fat(Reference Mohammad, Sunehag and Haymond14) and protein(Reference Qian, Chen and Lu15,Reference Ding, Li and Zhang16) . Carbohydrate composition of BM appears to be rather independent of maternal dietary intake. In terms of micronutrients, concentrations of thiamine, riboflavin, vitamin B6, vitamin B12, choline, vitamin A, vitamin C, vitamin D, Se, Zn and iodine are suggested to be rapidly secreted into milk or substantially reduced by maternal depletion, whereas concentrations of Ca, Fe and Mg tend to be relatively unaffected by variations in maternal intake(Reference Bravi, Weins and Decarli5). However, the available information on this topic is scarce and diverse, where the most comprehensive body of evidence, in terms of number of articles, comes from only three studies supporting an association between maternal fish consumption and high DHA in human BM(Reference Bravi, Weins and Decarli5). Similar conclusions were reached by another review conducted to summarise current literature on the association of maternal dietary intake with human BM composition(Reference Keikha, Bahreynian and Saleki9). Thus far, limited attention has been paid to the influence of maternal nutritional status – defined by various parameters such as BMI and body composition – on human BM composition(Reference Yang, Zhang and Ning17,Reference Hahn, Jeong and Park18) . In this systematic review, we provide an overview of studies exploring associations between maternal dietary intake and nutritional status, and macronutrient composition of human BM composition.
Methods
This review was conducted according to the Preferred Reporting Items for Systematic Reviews and Meta-Analyses(Reference Moher, Liberati and Tetzlaff19). To realise a comprehensive identification of relevant articles, three databases were consulted, that is, Medline via PubMed, Scopus and Cochrane. The search string included combinations of various search terms and MeSH terms with Boolean logic to identify the relevant publications, for example, ‘human milk’, ‘breast milk’, ‘composition’, ‘macronutrients’, ‘amino acid’, ‘BMI’, ‘nutritional status’, ‘nutrition intake’ and ‘maternal diet’. The search string and number hits per databases can be found in supplementary data. The selection process started with a title and abstract screening. Human intervention and observational studies investigating potential relations between maternal dietary intake and/or maternal nutritional status in relation to macronutrient composition of BM, published in English language, were ordered as full text. During full-text screening, articles were included when providing (1) data on maternal dietary intake and/or nutritional status (i.e. on anthropometric measurements, BMI or body composition) and (2) data on BM composition of macronutrients. Articles were excluded when: (1) studies focused on animal or pre-clinical data; (2) studies focused on micronutrient composition of human BM instead of macronutrient composition; (3) studies only included mothers of pre-term infants; (4) methodology used to determine human BM composition was not clearly explained and/or (5) published as conference papers, book chapters, letters or editorials. Further, studies that included colostrum or transition BM only were not included in this study. Studies that included both mature and transition BM were included however, only considered for the observations for mature BM. As no search strategy can guarantee completeness, additional hand searches were conducted to identify studies that were not retrieved by the systematic search, for example, by screening reference lists of identified original articles as well as related reviews.
Data extraction
All identified publications were exported to Excel; author S. A. screened all identified articles (n 4942) and author J. N. screened 5 % of the identified publication: both during title/abstract screening and full-text screening. To control the bias of selective reporting, differences identified were solved after discussion. Data were extracted using an extraction form that was developed based on the Cochrane form(20), including items on study characteristics, participant characteristics, milk characteristics, milk analysis method used, statistical analysis method used, anthropometric measurement used to determine maternal nutrition status, dietary intake assessment method, major findings of the study and main discussion point of the publication. A separate form was developed and used for the quantitative data collection, including items on concentration of macronutrients in BM, maternal nutritional status based on anthropometric measurements (i.e. undernourished, normal, over-nourished or obese), dietary intake of energy, macronutrients, micronutrients and amino acid composition of mother’s diet. Quantitative information on associations between maternal factors and BM composition was also recorded. Principal outcome reported in this review is mean and standard deviations. When available, regression coefficient (β) and coefficient of determination (R 2) are also reported as outcome. Unless stated otherwise, the term significant in this review refers to results with P-values ≤ 0·05. Outcomes are presented respective to their studies, and data of different studies were not combined.
Quality assessment
The quality of all full articles included in this review was evaluated by means of the Study Quality Assessment Tool, which is developed by the National Heart, Lung, and Blood Institute. (https://www.nhlbi.nih.gov/sites/default/files/media/docs/risk-assessment.pdf assessed on 28 October 2019). As specified in the document, different tools for observational studies and intervention studies were used. A maximum of fourteen points could be achieved, and no further qualitative assessment was done.
Results
Articles included in this study were published between 1954 and 2019 (Fig. 1), of which only 14 (24 %) articles were published within the past 5 years(Reference Hahn, Jeong and Park18,Reference Chang, Jung and Kim21–Reference Yahvah, Brooker and Williams32) . The majority of the studies were conducted among Asian participants (30 %, n 15)(Reference Yang, Zhang and Ning17,Reference Hahn, Jeong and Park18,Reference Chang, Jung and Kim21,Reference Dias and Nakhawa23–Reference Kim, Kim and Lee25,Reference Young, Patinkin and Pyle27,Reference Minato, Nomura and Asakura31,Reference Khin Maung, Tin Tin and Kywe-Thein33–Reference Karmarkar, Rajalakshmf and Ramakrishnan39) , followed by studies among Europeans (20 %, n 10)(Reference Boniglia, Carratù and Chiarotti13,Reference Bzikowska, Czerwonogrodzka-Senczyna and Weker28–Reference Aumeistere, Ciproviča and Zavadska30,Reference Michaelsen, Skafte and Badsberg40–Reference Cant, Shay and Horrobin45) , Africans (10 %, n 5)(Reference Steenbergen, Kusin and With46–Reference Cissé, Dossou and Ndiaye50), North-Americans (24 %, n 12)(Reference Mohammad, Sunehag and Haymond14,Reference De Luca, Frasquet-Darrieux and Gaud22,Reference Yahvah, Brooker and Williams32,Reference Nommsen, Lovelady and Heinig51–Reference Masters, McGuire and Beerman59) , South-Americans (14 %, n 7)(Reference Wurtman and Fernstrom54,Reference Marin Spring, Amancio and Nobriga60–Reference De Ferrer and Sambucetti65) and Australians (2 %, n 1)(Reference Kugananthan, Gridneva and Lai26) (Table 1 and Table 2). The age of the mothers included in the studies ranged from 14 to 43 years. Four (8 %) articles included both transition and mature milk(Reference Yang, Zhang and Ning17,Reference Young, Patinkin and Pyle27,Reference Bachour, Yafawi and Jaber36,Reference Michaelsen, Larsen and Thomsen41) . All other 46 (92 %) articles used mature human BM for their study. Eleven (22 %) articles included breast-feeding mothers irrespective of the postpartum age, that is (0–≥ 6 months)(Reference Chang, Jung and Kim21,Reference Quinn, Diki Bista and Childs24,Reference Kim, Kim and Lee25,Reference Aumeistere, Ciproviča and Zavadska30,Reference Quinn, Largado and Power37,Reference Michaelsen, Skafte and Badsberg40,Reference Park, McGuire and Behr53,Reference Wurtman and Fernstrom54,Reference Specker, Wey and Miller56,Reference Masters, McGuire and Beerman59,Reference Marin Spring, Amancio and Nobriga60) ; all other studies used more restricted postpartum age ranges. Only 14 % of the studies used milk samples collected from 24-h milk sampling by complete emptying of a breast. In 40 % (n 20) of the studies, milk sampling was done in the morning(Reference Boniglia, Carratù and Chiarotti13,Reference Yang, Zhang and Ning17,Reference De Luca, Frasquet-Darrieux and Gaud22–Reference Quinn, Diki Bista and Childs24,Reference Kugananthan, Gridneva and Lai26,Reference Yahvah, Brooker and Williams32,Reference Brown, Akhtar and Robertson34,Reference Nikniaz, Mahdavi and Arefhoesseini35,Reference Quinn, Largado and Power37,Reference Karmarkar, Rajalakshmf and Ramakrishnan39,Reference Michaelsen, Skafte and Badsberg40,Reference Forsum and Lonnerdal44,Reference Cant, Shay and Horrobin45,Reference Nommsen, Lovelady and Heinig51,Reference Wurtman and Fernstrom54–Reference Specker, Wey and Miller56,Reference Marin, Sanjurjo and Rodrigo64,Reference De Ferrer and Sambucetti65) and 6 % (n 3) of the studies sampled in the afternoon(Reference Hahn, Jeong and Park18,Reference Park, McGuire and Behr53,Reference Masters, McGuire and Beerman59) . Eight percentage (n 4) of the studies collected milk samples at three time points (morning, afternoon and evening) during the day(Reference Aumeistere, Ciproviča and Zavadska30,Reference Wurtman and Fernstrom54,Reference Villalpando, Butte and Wong61,Reference Barbosa, Butte and Villalpando62) , 6 % (n 3) of the studies collected milk samples at two time points (morning and afternoon) during the day(Reference Young, Patinkin and Pyle27,Reference Steenbergen, Kusin and With46,Reference Edozien, Rahim Khan and Waslien49) , 14 % (n 7) of the studies collected milk samples at multiple times throughout the day(Reference Mohammad, Sunehag and Haymond14,Reference Bzikowska, Czerwonogrodzka-Senczyna and Weker28,Reference Bzikowska-Jura, Czerwonogrodzka-Senczyna and Oledzka29,Reference Brown, Akhtar and Robertson34,Reference Vuori, Kiuru and Makinen43,Reference Nommsen, Lovelady and Heinig51,Reference Ruel, Dewey and Martinez63) and 25 % of the studies (n 13) did not distinguish based on point of time of the day(Reference Chang, Jung and Kim21,Reference Kim, Kim and Lee25,Reference Edozien, Rahim Khan and Waslien49,Reference Marin, Sanjurjo and Rodrigo64) or the information was not available(Reference Minato, Nomura and Asakura31,Reference Quinn, Largado and Power37,Reference Karmarkar, Rajalakshmf and Ramakrishnan39,Reference Michaelsen, Skafte and Badsberg40,Reference Antonakou, Skenderi and Chiou42,Reference Forsum and Lonnerdal44,Reference Ogechi and Irene48,Reference Dusdieker, Hemingway and Stumbo58,Reference Marin Spring, Amancio and Nobriga60) . Whereas 19 (38 %) studies collected whole BM samples(Reference Yang, Zhang and Ning17,Reference Chang, Jung and Kim21,Reference De Luca, Frasquet-Darrieux and Gaud22,Reference Kim, Kim and Lee25,Reference Young, Patinkin and Pyle27,Reference Yahvah, Brooker and Williams32,Reference Brown, Akhtar and Robertson34,Reference Nommsen, Lovelady and Heinig51,Reference Park, McGuire and Behr53,Reference Finley, Lonnerdal and Dewey55,Reference Specker, Wey and Miller56,Reference Dusdieker, Hemingway and Stumbo58–Reference Ruel, Dewey and Martinez63,Reference De Ferrer and Sambucetti65,Reference Chien, Huang and Hsu66) , 5 studies (10 %) collected any milk samples provided by the mothers(Reference Minato, Nomura and Asakura31,Reference Michaelsen, Skafte and Badsberg40,Reference Rocquelin, Tapsoba and Dop47,Reference Ogechi and Irene48,Reference Cissé, Dossou and Ndiaye50) . Others specifically reported a focus on fore milk (18 %, n 9)(Reference Dias and Nakhawa23,Reference Quinn, Diki Bista and Childs24,Reference Brown, Akhtar and Robertson34–Reference Bachour, Yafawi and Jaber36,Reference Rakicioglu, Samur and Topcu38,Reference Michaelsen, Larsen and Thomsen41,Reference Ruel, Dewey and Martinez63,Reference De Ferrer and Sambucetti65) , hind milk (8 %, n 4)(Reference Boniglia, Carratù and Chiarotti13,Reference Aumeistere, Ciproviča and Zavadska30,Reference Rakicioglu, Samur and Topcu38,Reference Cant, Shay and Horrobin45) , both fore and hind milk (20 %, n 10)(Reference Hahn, Jeong and Park18,Reference Kugananthan, Gridneva and Lai26,Reference Bzikowska, Czerwonogrodzka-Senczyna and Weker28,Reference Bzikowska-Jura, Czerwonogrodzka-Senczyna and Oledzka29,Reference Michaelsen, Larsen and Thomsen41,Reference Vuori, Kiuru and Makinen43,Reference Forsum and Lonnerdal44,Reference Steenbergen, Kusin and With46,Reference Schueler, Alexander and Hart52,Reference Mellies, Ishikawa and Gartside57) , middle milk (2 %, n 1)(Reference Wurtman and Fernstrom54), all fore, middle and hind milk (2 %, n 1)(Reference Mohammad, Sunehag and Haymond14) or middle and hind milk (2 %, n 1)(Reference Edozien, Rahim Khan and Waslien49).

Fig. 1. Publication selection procedure.
Table 1. Studies investigating maternal nutrition intake and breast milk (BM) composition of macronutrients

FFM, fat-free mass; IBW, ideal body weight; MIRIS, human milk analyser; MUAC, mid upper arm circumference; TBW, total body water; TCSF, triceps skin fold; #, same study looking at between mother nutritional status and within mother change in weight.
Significant differences are bold.
* Data inside parenthesis are presented as mean (sem).
Table 2. Studies investigating maternal nutritional status and breast milk (BM) composition of macronutrients
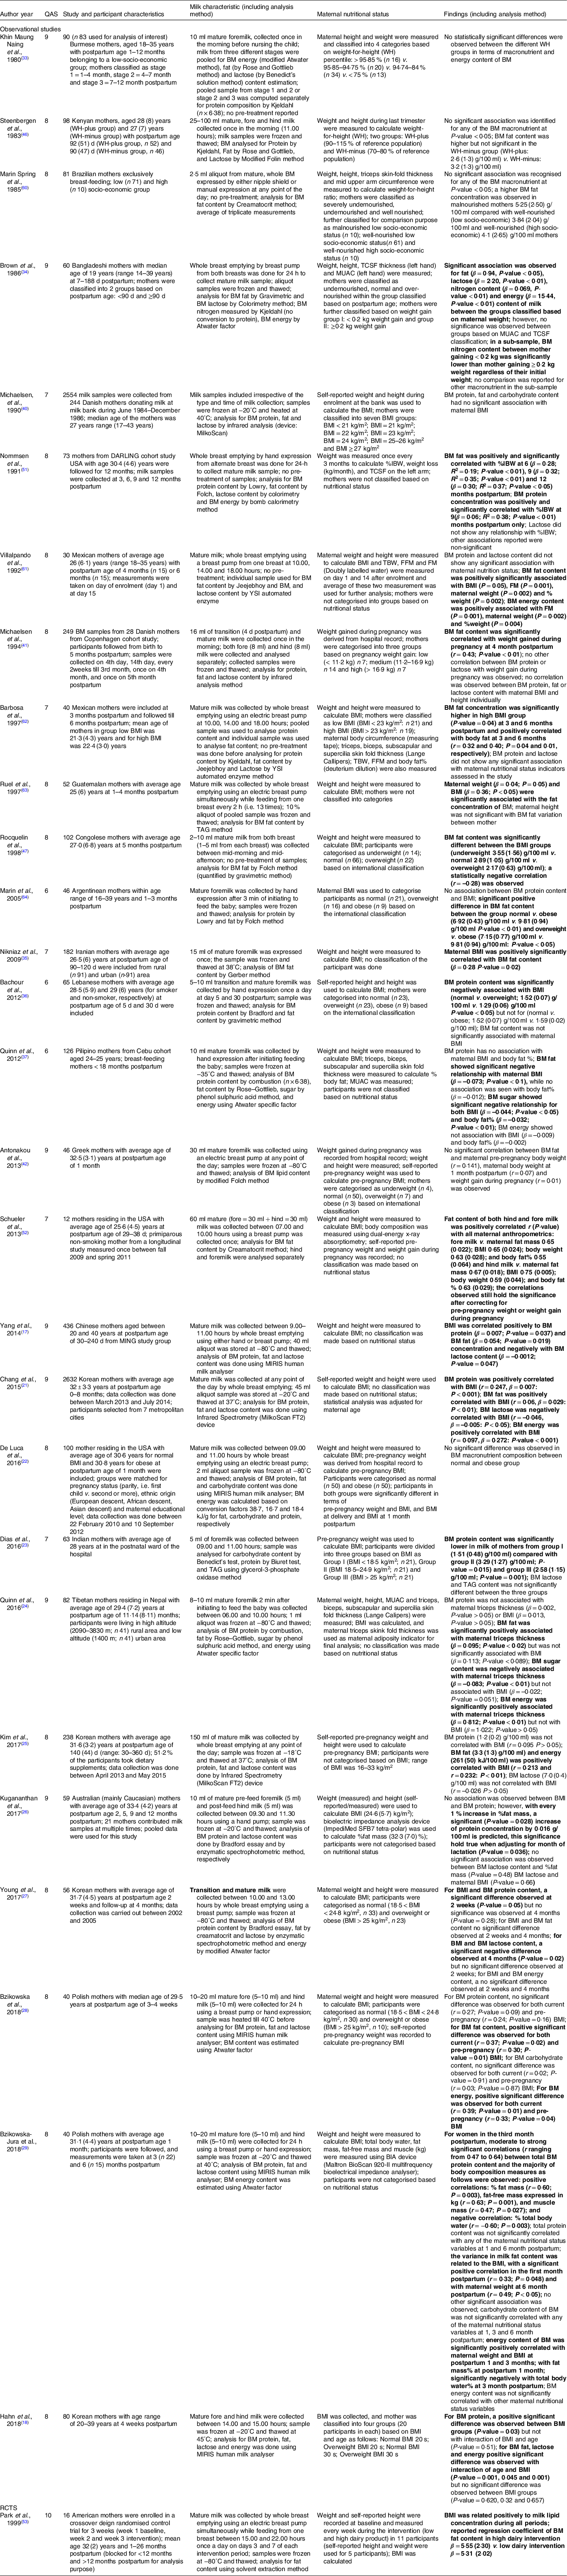
BIA, bioelectrical impedance analysis; FFM, fat-free mass; IBW, ideal body weight; MIRIS, human milk analyser; MUAC, mid upper arm circumference; TBW, total body water; TCSF, triceps skin fold.
Significant differences are in bold.
Across the identified studies, nine different parameters were used to define maternal nutritional status, including BMI (n 25), skin fold thickness at various measuring sites (n 8), mid-upper arm circumference (n 3), weight or weight difference between pre-pregnancy and postpartum weight (n 4), weight for height (n 3), % ideal body weight (n 1), fat mass (n 5), fat-free mass (n 2) and total body water (n 1) calculated based on various measurements such as bioelectric impedance analysis, skin fold thickness, dual isotope method or dual-energy x-ray absorptiometry. While nineteen studies used single parameters to define maternal nutritional status, four studies used two parameters, other four studies used three parameters and two studies used more than three parameters. With respect to maternal dietary intake, the most frequently used dietary intake assessment method was the food record (n 11) for 1(Reference Nommsen, Lovelady and Heinig51,Reference De Ferrer and Sambucetti65) , 2(Reference Dusdieker, Hemingway and Stumbo58), 3(Reference Kim, Kim and Lee25,Reference Bzikowska-Jura, Czerwonogrodzka-Senczyna and Oledzka29,Reference Rakicioglu, Samur and Topcu38,Reference Antonakou, Skenderi and Chiou42,Reference Park, McGuire and Behr53,Reference Specker, Wey and Miller56,Reference Masters, McGuire and Beerman59) or 7(Reference Vuori, Kiuru and Makinen43) d, 24-h recall (n 6) for 1 d(Reference Yang, Zhang and Ning17,Reference Ogechi and Irene48,Reference Nommsen, Lovelady and Heinig51,Reference Wurtman and Fernstrom54,Reference Villalpando, Butte and Wong61) , and 3(Reference Nikniaz, Mahdavi and Arefhoesseini35) d. Other methods used were the duplicate portion method(Reference Karmarkar, Rajalakshmf and Ramakrishnan39,Reference Forsum and Lonnerdal44) , FFQ(Reference Minato, Nomura and Asakura31,Reference Masters, McGuire and Beerman59) , weighed food record(Reference Yahvah, Brooker and Williams32,Reference Ogechi and Irene48) and controlled dietary intervention studies(Reference Mohammad, Sunehag and Haymond14,Reference Edozien, Rahim Khan and Waslien49,Reference Cissé, Dossou and Ndiaye50,Reference Chien, Huang and Hsu66) .
Milk analysis
Collected samples were frozen and thawed before analysis in 32 (61·5 %) of the studies; the majority (87·5 %) of these studies analysed fat content. Nine (17·3 %) studies used the MIRIS human milk analyser, whereas 4 (7·7 %) used MilkoScan human milk analyser; other methods were total nitrogen estimation and colorimetry method for protein, solvent extraction method and creamatocrit for lipid/fat estimation, and Infrared Spectrometry and colorimetry method for carbohydrates. Nine different methods were used to determine BM protein content, ten different methods were used to identify BM carbohydrate content and fifteen different methods were used to quantify BM fat content. Besides, these differences in analytical methods also laboratory procedures varied across studies. Only one study provided information on validation with standard technique.
Breast milk energy content
A total of sixteen studies investigated and reported BM energy composition and its association with either maternal dietary intake or maternal nutritional status. Five studies calculated BM energy content using Atwater general factor(Reference Young, Patinkin and Pyle27–Reference Bzikowska-Jura, Czerwonogrodzka-Senczyna and Oledzka29,Reference Brown, Akhtar and Robertson34,Reference Ogechi and Irene48) , and three studies used Atwater specific factor (i.e. conversion factor for protein, carbohydrate and fat of 5·65, 3·95 and 9·25 kJ/g, respectively)(Reference Quinn, Diki Bista and Childs24,Reference Quinn, Largado and Power37,Reference Nommsen, Lovelady and Heinig51) . BM energy was measured using the bomb calorimetry method by only one cross-sectional study(Reference Villalpando, Butte and Wong61). Five studies used infrared-based devices such as MIRIS and Milkoscan to measure BM composition(Reference Hahn, Jeong and Park18,Reference Chang, Jung and Kim21,Reference De Luca, Frasquet-Darrieux and Gaud22,Reference Kim, Kim and Lee25,Reference Bzikowska-Jura, Czerwonogrodzka-Senczyna and Oledzka29) . These studies/devices calculate BM energy composition based on Atwater factor for individual macronutrient composition. Only one study used specific conversion factors of 38·7, 16·7 and 18·4 kJ/g for fat, carbohydrate and protein, respectively, to calculate BM energy composition(Reference De Luca, Frasquet-Darrieux and Gaud22).
Range of mean BM energy based on the studies included is 259 (29) kJ/100 ml with a range of 21-301 kJ/100 ml. Out of six studies that investigated association of BM energy with maternal dietary intake, three showed significant associations for maternal intake of protein(Reference Bzikowska-Jura, Czerwonogrodzka-Senczyna and Oledzka29,Reference Ogechi and Irene48,Reference Nommsen, Lovelady and Heinig51) , fat(Reference Kim, Kim and Lee25,Reference Bzikowska-Jura, Czerwonogrodzka-Senczyna and Oledzka29,Reference Ogechi and Irene48) , carbohydrate(Reference Bzikowska-Jura, Czerwonogrodzka-Senczyna and Oledzka29) and total energy(Reference Bzikowska-Jura, Czerwonogrodzka-Senczyna and Oledzka29), while 2 (33 %) did not observe any association with the macronutrient intakes studied(Reference Minato, Nomura and Asakura31,Reference Villalpando, Butte and Wong61) . All six studies investigated BM composition of three macronutrients. Five studies investigated maternal intake of protein, fat, carbohydrate and total energy and their association with BM energy content. One study only investigated association of maternal intake of protein and total energy with BM energy content(Reference Minato, Nomura and Asakura31).
Out of eleven studies that investigated associations between maternal nutrition status (either pre-pregnancy BMI or maternal status at the time of lactation) and BM energy content, 7 (64 %) showed significant associations(Reference Hahn, Jeong and Park18,Reference Chang, Jung and Kim21,Reference Quinn, Diki Bista and Childs24,Reference Kim, Kim and Lee25,Reference Bzikowska, Czerwonogrodzka-Senczyna and Weker28,Reference Brown, Akhtar and Robertson34,Reference Villalpando, Butte and Wong61) , whereas 4 (36 %) did not(Reference De Luca, Frasquet-Darrieux and Gaud22,Reference Young, Patinkin and Pyle27,Reference Bzikowska-Jura, Czerwonogrodzka-Senczyna and Oledzka29,Reference Bachour, Yafawi and Jaber36) . An overview of the available result is presented in Fig. 2. Current maternal nutritional status and BM energy density content were reported to have a significant association in four studies, that is, n 30, r = 0·35, P-value = 0·07(Reference Villalpando, Butte and Wong61); n 60, β = 65 (kJ/d per kg maternal weight), P-value < 0·01(Reference Brown, Akhtar and Robertson34); n 2632, r = 0·10, P-values < 0·01(Reference Chang, Jung and Kim21); and n 40, r = 0·33, P-value < 0·04(Reference Bzikowska, Czerwonogrodzka-Senczyna and Weker28). On the other hand, no significant associations between current maternal nutritional status and BM energy content were reported in observational studies by Quinn et al., n 216, β = –0.04 (kJ/g per BMI unit), P-value > 0·05(Reference Quinn, Largado and Power37), and by De Luca et al., n 100, Δ (normal-obese BMI) = 16 kJ/100 ml milk, P-value = 0·33(Reference De Luca, Frasquet-Darrieux and Gaud22). Mixed results were reported within one publication where fat mass was positively significantly associated with BM energy density (β = 0·81, P-value < 0·01), while no significance was observed for maternal BMI and BM energy density (β = 1·02, P-value > 0·05)(Reference Quinn, Diki Bista and Childs24).

Fig. 2. Association between maternal nutrition status with breast milk energy content. ![]() , Underweight;
, Underweight; ![]() , Normal;
, Normal; ![]() , Overweight;
, Overweight; ![]() , Obese. Studies followed with an asterisk (*) reported a significant association
, Obese. Studies followed with an asterisk (*) reported a significant association
Breast milk protein content
Methods used to determine protein content of the collected human BM samples by the included studies are: Kjeldahl (n 14), Colorimetry (n 1), Lowry (n 3), Bradford (n 3), Milkoscan (n 4), MIRIS (n 7), combustion (n 1), assays (n 2) and Infrared (n 1).
Range of mean BM protein concentration based on the studies included is 1·3 (0·3) g/100 ml with a range of 0·8 g/100 ml to 3·3 g/100 ml. Out of seventeen studies exploring the association of maternal dietary intake with BM protein composition, 6 (35 %) showed significant association with at least one macronutrient consumed by the mother(Reference Yang, Zhang and Ning17,Reference Karmarkar, Rajalakshmf and Ramakrishnan39,Reference Forsum and Lonnerdal44,Reference Cissé, Dossou and Ndiaye50,Reference Wurtman and Fernstrom54,Reference Chien, Huang and Hsu66) , while 11 (65 %) did not show significant findings(Reference Boniglia, Carratù and Chiarotti13,Reference Mohammad, Sunehag and Haymond14,Reference Kim, Kim and Lee25,Reference Bzikowska-Jura, Czerwonogrodzka-Senczyna and Oledzka29–Reference Minato, Nomura and Asakura31,Reference Rakicioglu, Samur and Topcu38,Reference Ogechi and Irene48,Reference Edozien, Rahim Khan and Waslien49,Reference Nommsen, Lovelady and Heinig51,Reference De Ferrer and Sambucetti65) . Significant association of maternal protein intake with the BM composition of protein was reported by Wurtman et al. (n 20, P-value < 0·01) and Forsum et al. (n 3, Δ(high protein-low protein diet) = 0·1 g/100 ml P-value < 0·01)(Reference Forsum and Lonnerdal44,Reference Wurtman and Fernstrom54) . Interestingly, there was an immediate postprandial effect of maternal protein consumption among Taiwanese mothers (n 23) showing a significant increase in BM protein content one and a half hour after consumption of both alcoholic (+1·4 mg/100 ml) and non-alcoholic (+1·2 mg/100 ml) soup(Reference Chien, Huang and Hsu66). An intervention study (n 60) conducted among marginally undernourished mother concluded that BM protein content was significantly higher in group supplemented with protein compared with group supplemented with fat and the control group(Reference Karmarkar, Rajalakshmf and Ramakrishnan39).
Studies investigating relation between maternal nutritional status and BM protein content delivered mixed results as well: eight studies (42 %) showed significant associations(Reference Yang, Zhang and Ning17,Reference Hahn, Jeong and Park18,Reference Chang, Jung and Kim21,Reference Dias and Nakhawa23,Reference Kugananthan, Gridneva and Lai26,Reference Young, Patinkin and Pyle27,Reference Bzikowska-Jura, Czerwonogrodzka-Senczyna and Oledzka29,Reference Nikniaz, Mahdavi and Arefhoesseini35,Reference Cissé, Dossou and Ndiaye50,Reference De Ferrer and Sambucetti65) , while eleven studies (58 %) did not show any significant findings(Reference De Luca, Frasquet-Darrieux and Gaud22,Reference Quinn, Diki Bista and Childs24,Reference Kim, Kim and Lee25,Reference Bzikowska, Czerwonogrodzka-Senczyna and Weker28,Reference Bachour, Yafawi and Jaber36,Reference Michaelsen, Skafte and Badsberg40,Reference Cant, Shay and Horrobin45,Reference Marin Spring, Amancio and Nobriga60,Reference Villalpando, Butte and Wong61,Reference Ruel, Dewey and Martinez63,Reference Chien, Huang and Hsu66) . An overview of the available result is presented in Fig. 3. A study conducted in Poland (n 40) reported significant positive association of maternal nutritional status with BM protein content at 3 months postpartum, but not at 1 or 6 months postpartum(Reference Bzikowska-Jura, Czerwonogrodzka-Senczyna and Oledzka29). Pre-pregnancy nutritional status (BMI) was also significantly associated with BM protein composition in urban Chinese mothers (n 436)(Reference Yang, Zhang and Ning17), but no such associations were observed in South Korean mothers (n 238)(Reference Kim, Kim and Lee25). Mixed results were also reported for association between BM protein composition and maternal nutritional status (measured in terms of % fat mass and BMI, respectively) with significant positive associations reported by Hahn et al. (n 80) and Kugananthan et al. (n 59)(Reference Hahn, Jeong and Park18,Reference Kugananthan, Gridneva and Lai26) , while Barbosa et al. (n 40) reported no such associations(Reference Barbosa, Butte and Villalpando62). Other studies reported that BM protein composition was similar in mothers with normal BMI and obese mothers(Reference De Luca, Frasquet-Darrieux and Gaud22,Reference Bachour, Yafawi and Jaber36) , while it was significantly lower in overweight mothers(Reference Bachour, Yafawi and Jaber36). Similarly, a positive significant association was reported between maternal fat mass and BM composition of protein(Reference Kugananthan, Gridneva and Lai26,Reference Bzikowska-Jura, Czerwonogrodzka-Senczyna and Oledzka29) at 3 months postpartum, while no significant associations were observed at 1 and 6 months postpartum(Reference Bzikowska-Jura, Czerwonogrodzka-Senczyna and Oledzka29). Although not all associations were statistically significant, protein composition of BM of undernourished mothers was reported to be lower than normally nourished mothers by all the studies included in this review(Reference Bachour, Yafawi and Jaber36,Reference Villalpando, Butte and Wong61,Reference De Ferrer and Sambucetti65) . In an intervention-based study (n 133) by Cisse et al., diets of undernourished mothers were supplemented with millet or maize and compared with a placebo group with no supplement. After 60 d, authors reported significant positive change in maternal fat-free mass, while no change was observed in maternal fat mass. This increase in fat-free mass translated into a significantly higher BM protein and lactose content at 3 months postpartum age among the supplementation group compared with placebo group(Reference Cissé, Dossou and Ndiaye50). An observational study conducted by Brown et al. (n 35) on marginally nourished mothers reported a significant association between maternal weight gain at postpartum age of 3 months with BM nitrogen content. Mothers gaining <0·2 kg weight had significantly (t = 2·64, P-value < 0·02) lower BM nitrogen (0·85 g/100 ml for mothers with initial weight < 39 kg and 1·02 g/100 ml for mothers with initial weight ≥ 39 kg) compared with mothers gaining more than 0·2 kg weight (1·09 g/100 ml for mothers with initial weight < 39 kg and 1·12 g/100 ml for mothers with initial weight ≥ 39 kg)(Reference Brown, Akhtar and Robertson34).

Fig. 3. Association of maternal nutritional status with breast milk (BM) protein content. ![]() , Underweight;
, Underweight; ![]() , Normal;
, Normal; ![]() , Overweight;
, Overweight; ![]() , Obese. Studies followed with an asterisk (*) reported a significant association
, Obese. Studies followed with an asterisk (*) reported a significant association
Breast milk fat content
Methods used to determine human BM fat content of sample collected in the included studies were Rose and Gottieb (n 5), Crematocrit (n 4), Gravimetric (n 4), Colorimetry (n 1), Soxhlet (n 1), Milkoscan (n 4), MIRIS (n 7), Folch (n 9), Jeejebhoy (n 2), Infrared (n 1), Assays (n 1), TAG (n 1), solvent extraction (n 3), Gerber (n 2) and Chiba (n 1) method.
BM fat content is the macronutrient most frequently studied and most frequently reported to be influenced by maternal factors. Range of mean BM fat concentration based on the studies included in this study is 3·6 (0·9) g/100 ml with a range of 2·1–9·8 g/100 ml. Out of twenty-five studies that explored the association of maternal dietary intake with BM fat composition, 8 (32 %) showed significant association with at least one of the maternal macronutrient intakes(Reference Mohammad, Sunehag and Haymond14,Reference Kim, Kim and Lee25,Reference Minato, Nomura and Asakura31,Reference Nikniaz, Mahdavi and Arefhoesseini35,Reference Karmarkar, Rajalakshmf and Ramakrishnan39,Reference Nommsen, Lovelady and Heinig51,Reference Park, McGuire and Behr53,Reference Chien, Huang and Hsu66) , while 17 (68 %) did not show significant findings(Reference Yang, Zhang and Ning17,Reference Bzikowska-Jura, Czerwonogrodzka-Senczyna and Oledzka29,Reference Aumeistere, Ciproviča and Zavadska30,Reference Yahvah, Brooker and Williams32,Reference Rakicioglu, Samur and Topcu38,Reference Antonakou, Skenderi and Chiou42,Reference Vuori, Kiuru and Makinen43,Reference Cant, Shay and Horrobin45,Reference Ogechi and Irene48,Reference Cissé, Dossou and Ndiaye50,Reference Wurtman and Fernstrom54–Reference Masters, McGuire and Beerman59,Reference Villalpando, Butte and Wong61) . Two studies observed significant association between maternal intake of carbohydrate (n 182, β = 0·39, P-value < 0·01)(Reference Nikniaz, Mahdavi and Arefhoesseini35) and protein (n 73, r = 0·49, P-value < 0·01)(Reference Nommsen, Lovelady and Heinig51) with BM fat content, while no associations were observed for maternal fat intake with BM fat content(Reference Nikniaz, Mahdavi and Arefhoesseini35,Reference Nommsen, Lovelady and Heinig51) . Conversely, an observational study conducted in Korea (n 238) did not report a significant correlation (r = 0·21, P-value < 0·01) between maternal fat intake and BM fat content(Reference Kim, Kim and Lee25). Moreover, both intervention studies investigating the impact of a high-fat v. low-fat maternal diet with BM fat content showed a higher concentration of BM fat content in the high-fat diet group with the following significant differences (n 7, Δ = 0·5 g/100 ml, P < 0·05)(Reference Mohammad, Sunehag and Haymond14) and (n 16, Δ = 7·3 mg/g, P < 0·05)(Reference Park, McGuire and Behr53) between the comparison groups.
Twenty-six studies included in this study explored the potential association between nutritional status and BM fat content of which 19 (73 %) showed significant associations(Reference Yang, Zhang and Ning17,Reference Hahn, Jeong and Park18,Reference Chang, Jung and Kim21,Reference Quinn, Diki Bista and Childs24,Reference Kim, Kim and Lee25,Reference Bzikowska, Czerwonogrodzka-Senczyna and Weker28,Reference Bzikowska-Jura, Czerwonogrodzka-Senczyna and Oledzka29,Reference Brown, Akhtar and Robertson34,Reference Nikniaz, Mahdavi and Arefhoesseini35,Reference Quinn, Largado and Power37,Reference Michaelsen, Larsen and Thomsen41,Reference Rocquelin, Tapsoba and Dop47,Reference Nommsen, Lovelady and Heinig51–Reference Park, McGuire and Behr53,Reference Villalpando, Butte and Wong61–Reference Marin, Sanjurjo and Rodrigo64) , while 7 (27 %) did not(Reference De Luca, Frasquet-Darrieux and Gaud22,Reference Young, Patinkin and Pyle27,Reference Nikniaz, Mahdavi and Arefhoesseini35,Reference Michaelsen, Larsen and Thomsen41,Reference Cant, Shay and Horrobin45,Reference Masters, McGuire and Beerman59,Reference Chien, Huang and Hsu66) . An overview of the available result is presented in Fig. 4. Pre-pregnancy maternal nutrition status was shown to be significantly associated with BM fat composition by two observational studies(Reference Kim, Kim and Lee25,Reference Bzikowska, Czerwonogrodzka-Senczyna and Weker28) , while an observational study reported no such association(Reference Michaelsen, Larsen and Thomsen41). Majority of studies (observational) reported positive significant(Reference Yang, Zhang and Ning17,Reference Chang, Jung and Kim21,Reference Bzikowska, Czerwonogrodzka-Senczyna and Weker28,Reference Schueler, Alexander and Hart52) associations between current maternal nutritional status and BM fat content, whereas two observational studies did not show associations(Reference De Luca, Frasquet-Darrieux and Gaud22,Reference Antonakou, Skenderi and Chiou42) . A longitudinal study conducted in the USA (n 12) reported that both fore (BMI: r = 0·65, P-value = 0·024, % body fat: r = 0·55, P-value = 0·064, weight: r = 0·63, P-value = 0·028 and fat mass: r = 0,67, P-value = 0·018), and hind milk (BMI: r = 0·75, P-value = 0·005, % body fat: r = 0·63, P-value = 0·029, weight: r = 0·59, P-value = 0·044, and fat mass: r = 0·67, P-value = 0·018) were significantly positively correlated with maternal nutritional factors, which persisted after correction for maternal pre-pregnancy BMI(Reference Schueler, Alexander and Hart52). This association is also supported by Iranian and Filipino studies(Reference Nikniaz, Mahdavi and Arefhoesseini35,Reference Quinn, Largado and Power37) , but not by various other studies included in this review(Reference Nikniaz, Mahdavi and Arefhoesseini35,Reference Michaelsen, Larsen and Thomsen41) .
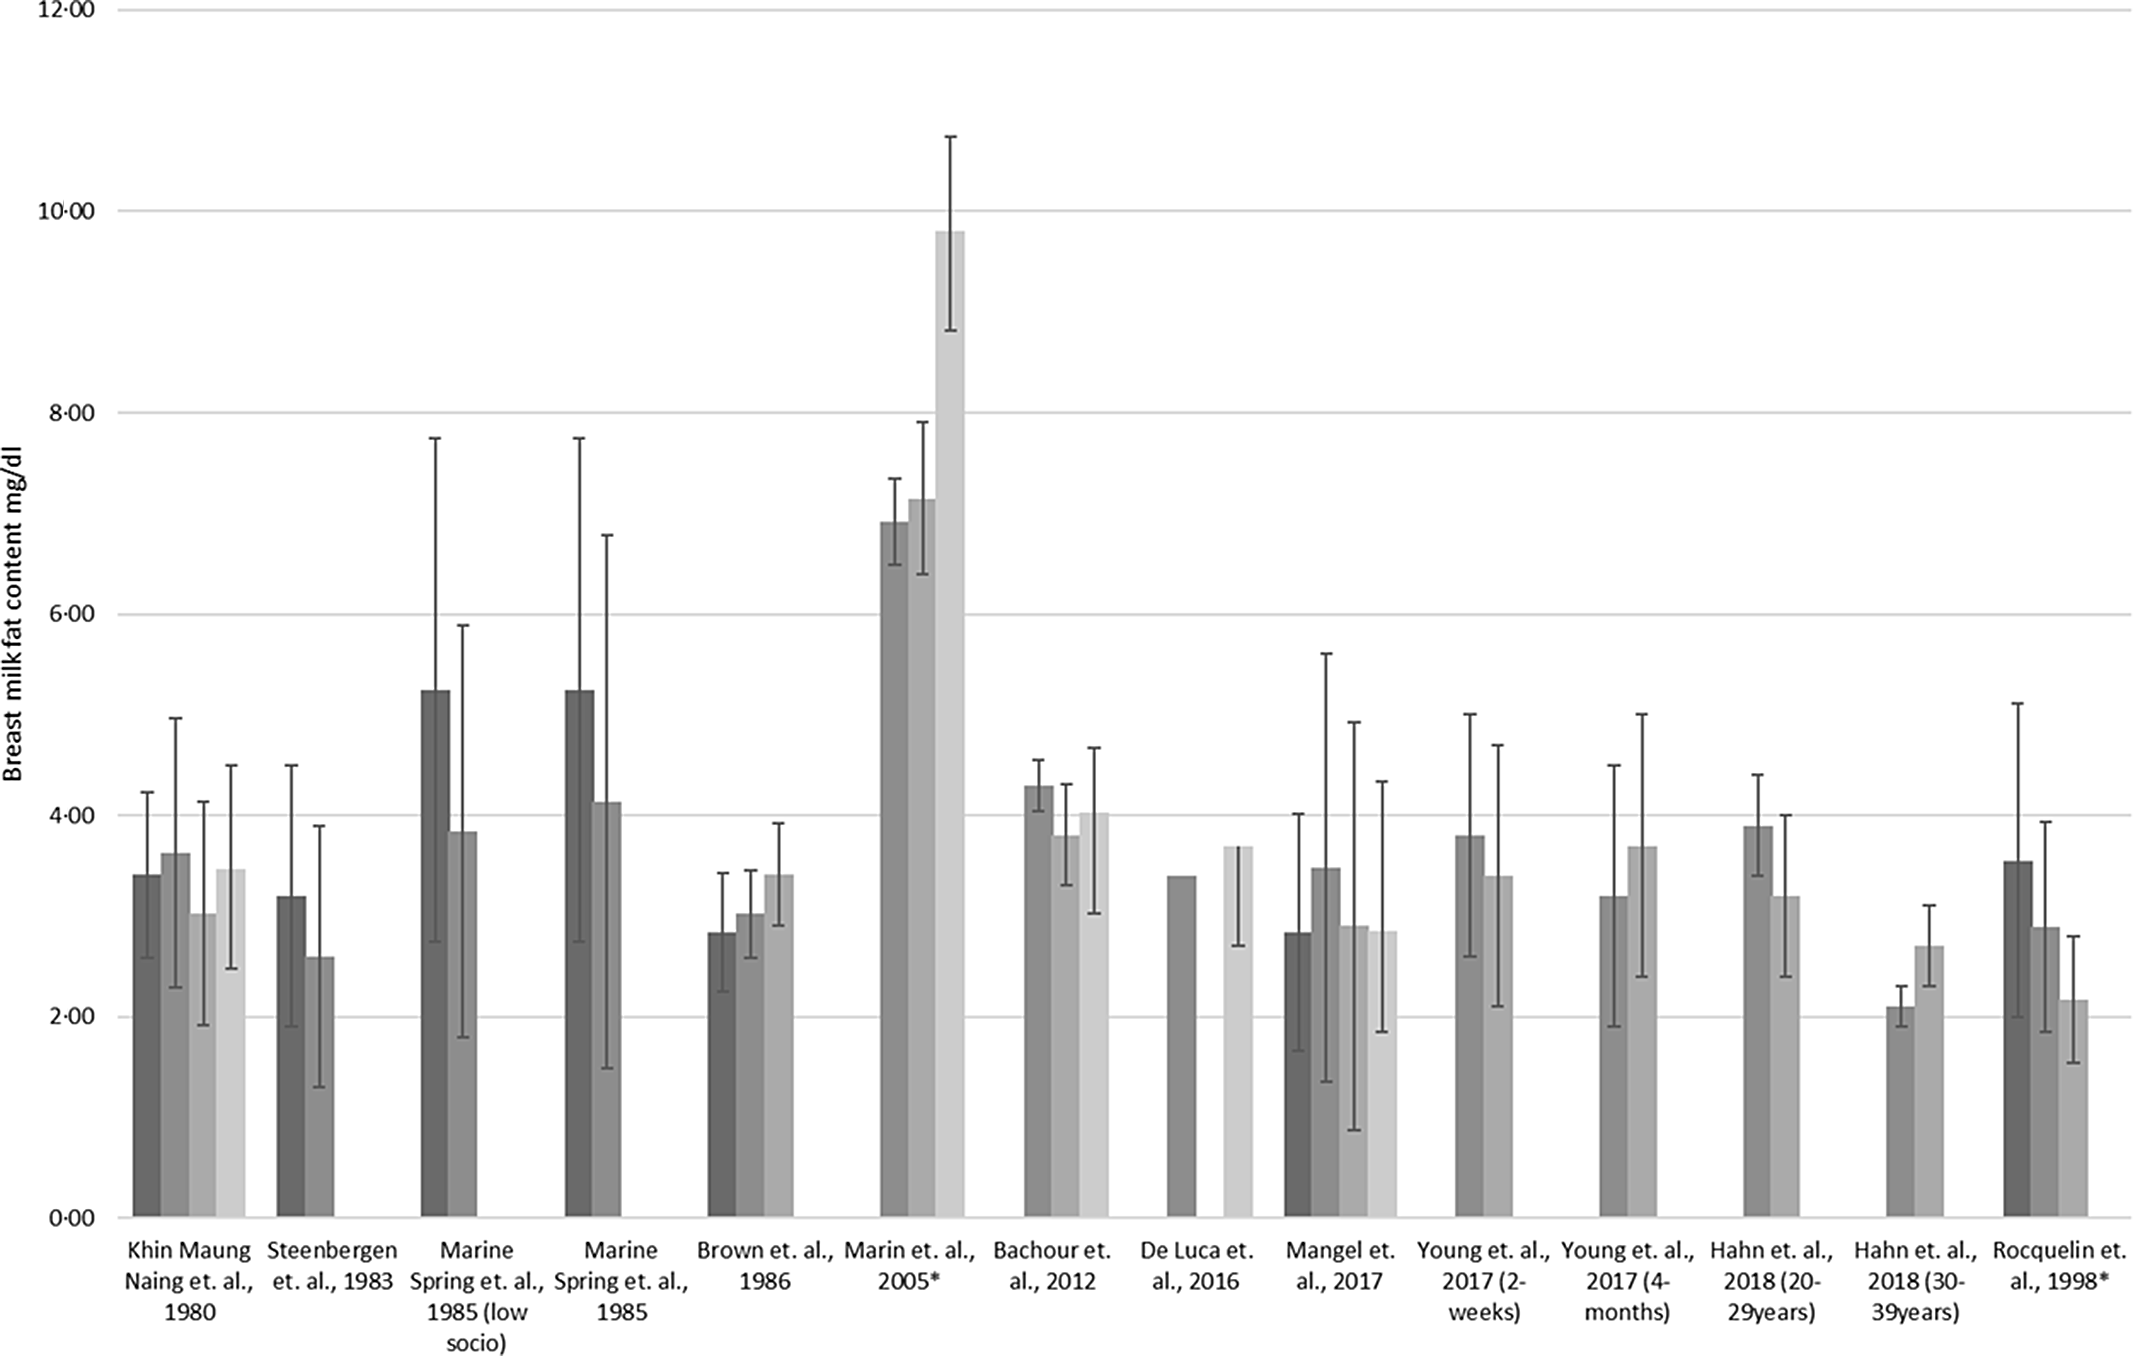
Fig. 4. Association between maternal nutrition status with breast milk composition of fat. ![]() , Underweight;
, Underweight; ![]() , Normal;
, Normal; ![]() , Overweight;
, Overweight; ![]() , Obese. Studies followed with an asterisk (*) reported a significant association
, Obese. Studies followed with an asterisk (*) reported a significant association
Breast milk carbohydrate content
Methods used to determine BM carbohydrate content of the collected samples of the studies included are: Modified Folin (n 2), Colorimetry (n 2), Phenol-sulphuric acid (n 1), Milkoscan (n 4), MIRIS (n 7), Assays (n 1), Infrared (n 1), HPLC (n 1), Difference (n 1) and YIS enzymatic (n 7) method.
Range of mean BM carbohydrate concentration based on the studies included in this review is 6·7 (0·7) g/100 ml. Out of twelve studies that investigated the association of maternal dietary intake with BM carbohydrate composition, 5 (42 %) showed significant associations with the intake of at least one maternal macronutrient(Reference Yang, Zhang and Ning17,Reference Minato, Nomura and Asakura31,Reference Ogechi and Irene48,Reference Cissé, Dossou and Ndiaye50,Reference Chien, Huang and Hsu66) , while 7 (58 %) did not show significant findings(Reference Mohammad, Sunehag and Haymond14,Reference Kim, Kim and Lee25,Reference Bzikowska-Jura, Czerwonogrodzka-Senczyna and Oledzka29,Reference Aumeistere, Ciproviča and Zavadska30,Reference Rakicioglu, Samur and Topcu38,Reference Nommsen, Lovelady and Heinig51,Reference Villalpando, Butte and Wong61) . Maternal dietary intake was reported to be positively associated with BM carbohydrate (some measured in terms of lactose) content for maternal protein intake(Reference Minato, Nomura and Asakura31) all nutrient intake(Reference Ogechi and Irene48) and only fat intake(Reference Yang, Zhang and Ning17). Other studies reported no significant associations(Reference Kim, Kim and Lee25,Reference Bzikowska-Jura, Czerwonogrodzka-Senczyna and Oledzka29,Reference Aumeistere, Ciproviča and Zavadska30,Reference Rakicioglu, Samur and Topcu38,Reference Villalpando, Butte and Wong61) . An intervention study (n 7) comparing a normal carbohydrate (60 % of total energy) v. a low-carbohydrate (30 % of total energy) diet among healthy American mothers showed no significant difference when comparing BM carbohydrate content of the two intervention groups(Reference Mohammad, Sunehag and Haymond14). Supplementing 113 undernourished Senegalese mothers with additional 1766 kJ (n 41) or 1674 kJ (n 35) v. no supplementation (n 57) did show significant different BM lactose composition post-treatment among supplemented mothers(Reference Cissé, Dossou and Ndiaye50). In a study conducted among Taiwanese mothers (n 23), consumption of an alcoholic soup providing 120 kJ/100 ml energy had a significant negative effect on BM lactose composition. No such effect was observed when the mothers consumed a non-alcoholic soup providing 95 kJ/100 ml energy(Reference Chien, Huang and Hsu66).
Nineteen studies investigated the potential association between nutritional status and BM carbohydrate content of which 7 (37 %) showed significant associations(Reference Yang, Zhang and Ning17,Reference Hahn, Jeong and Park18,Reference Chang, Jung and Kim21,Reference Quinn, Diki Bista and Childs24,Reference Young, Patinkin and Pyle27,Reference Brown, Akhtar and Robertson34,Reference Quinn, Largado and Power37) , while 12 (63 %) did not show significant findings(Reference De Luca, Frasquet-Darrieux and Gaud22,Reference Dias and Nakhawa23,Reference Kim, Kim and Lee25,Reference Kugananthan, Gridneva and Lai26,Reference Bzikowska, Czerwonogrodzka-Senczyna and Weker28,Reference Bzikowska-Jura, Czerwonogrodzka-Senczyna and Oledzka29,Reference Michaelsen, Skafte and Badsberg40,Reference Cant, Shay and Horrobin45,Reference Cissé, Dossou and Ndiaye50,Reference Marin Spring, Amancio and Nobriga60,Reference Villalpando, Butte and Wong61,Reference Chien, Huang and Hsu66) . An overview of the available result is presented in Fig. 5. Majority of studies reported that pre-pregnancy nutritional status(Reference Dias and Nakhawa23,Reference Kim, Kim and Lee25,Reference Bzikowska, Czerwonogrodzka-Senczyna and Weker28) and current maternal nutrition status(Reference Bzikowska, Czerwonogrodzka-Senczyna and Weker28) were not significantly associated with BM composition of carbohydrate. This diversity in results can be illustrated by two of the identified studies. One of the observational studies (n 436) showed a significant negative association (n 436, β = –0·0012, P-value = 0·047) between pre-pregnancy maternal nutrition status and BM carbohydrate(Reference Yang, Zhang and Ning17), while the other observational study (n 60) showed a positive significant association (n 60, β = 2·20, P-value < 0·01) of nutritional status during lactation with BM carbohydrate composition(Reference Brown, Akhtar and Robertson34). The association of maternal nutritional status and BM carbohydrate content was inconsistent along with the longitudinal variation of BM composition(Reference Yang, Zhang and Ning17,Reference Brown, Akhtar and Robertson34) . Another study (n 56) comparing Korean mothers with normal BMI with mothers with BMI higher than 25 kg/m2 reported a non-significant positive difference observed at 2 weeks (Δ(BMI > 25 kg/m2–Normal BMI) = 0·1 g/100 ml, P-value = 0·46), while a significant negative difference (Δ(BMI > 25 kg/m2–Normal BMI) = –0·5 g/100 ml, P-value = 0·02) was observed at 4 months(Reference Young, Patinkin and Pyle27).
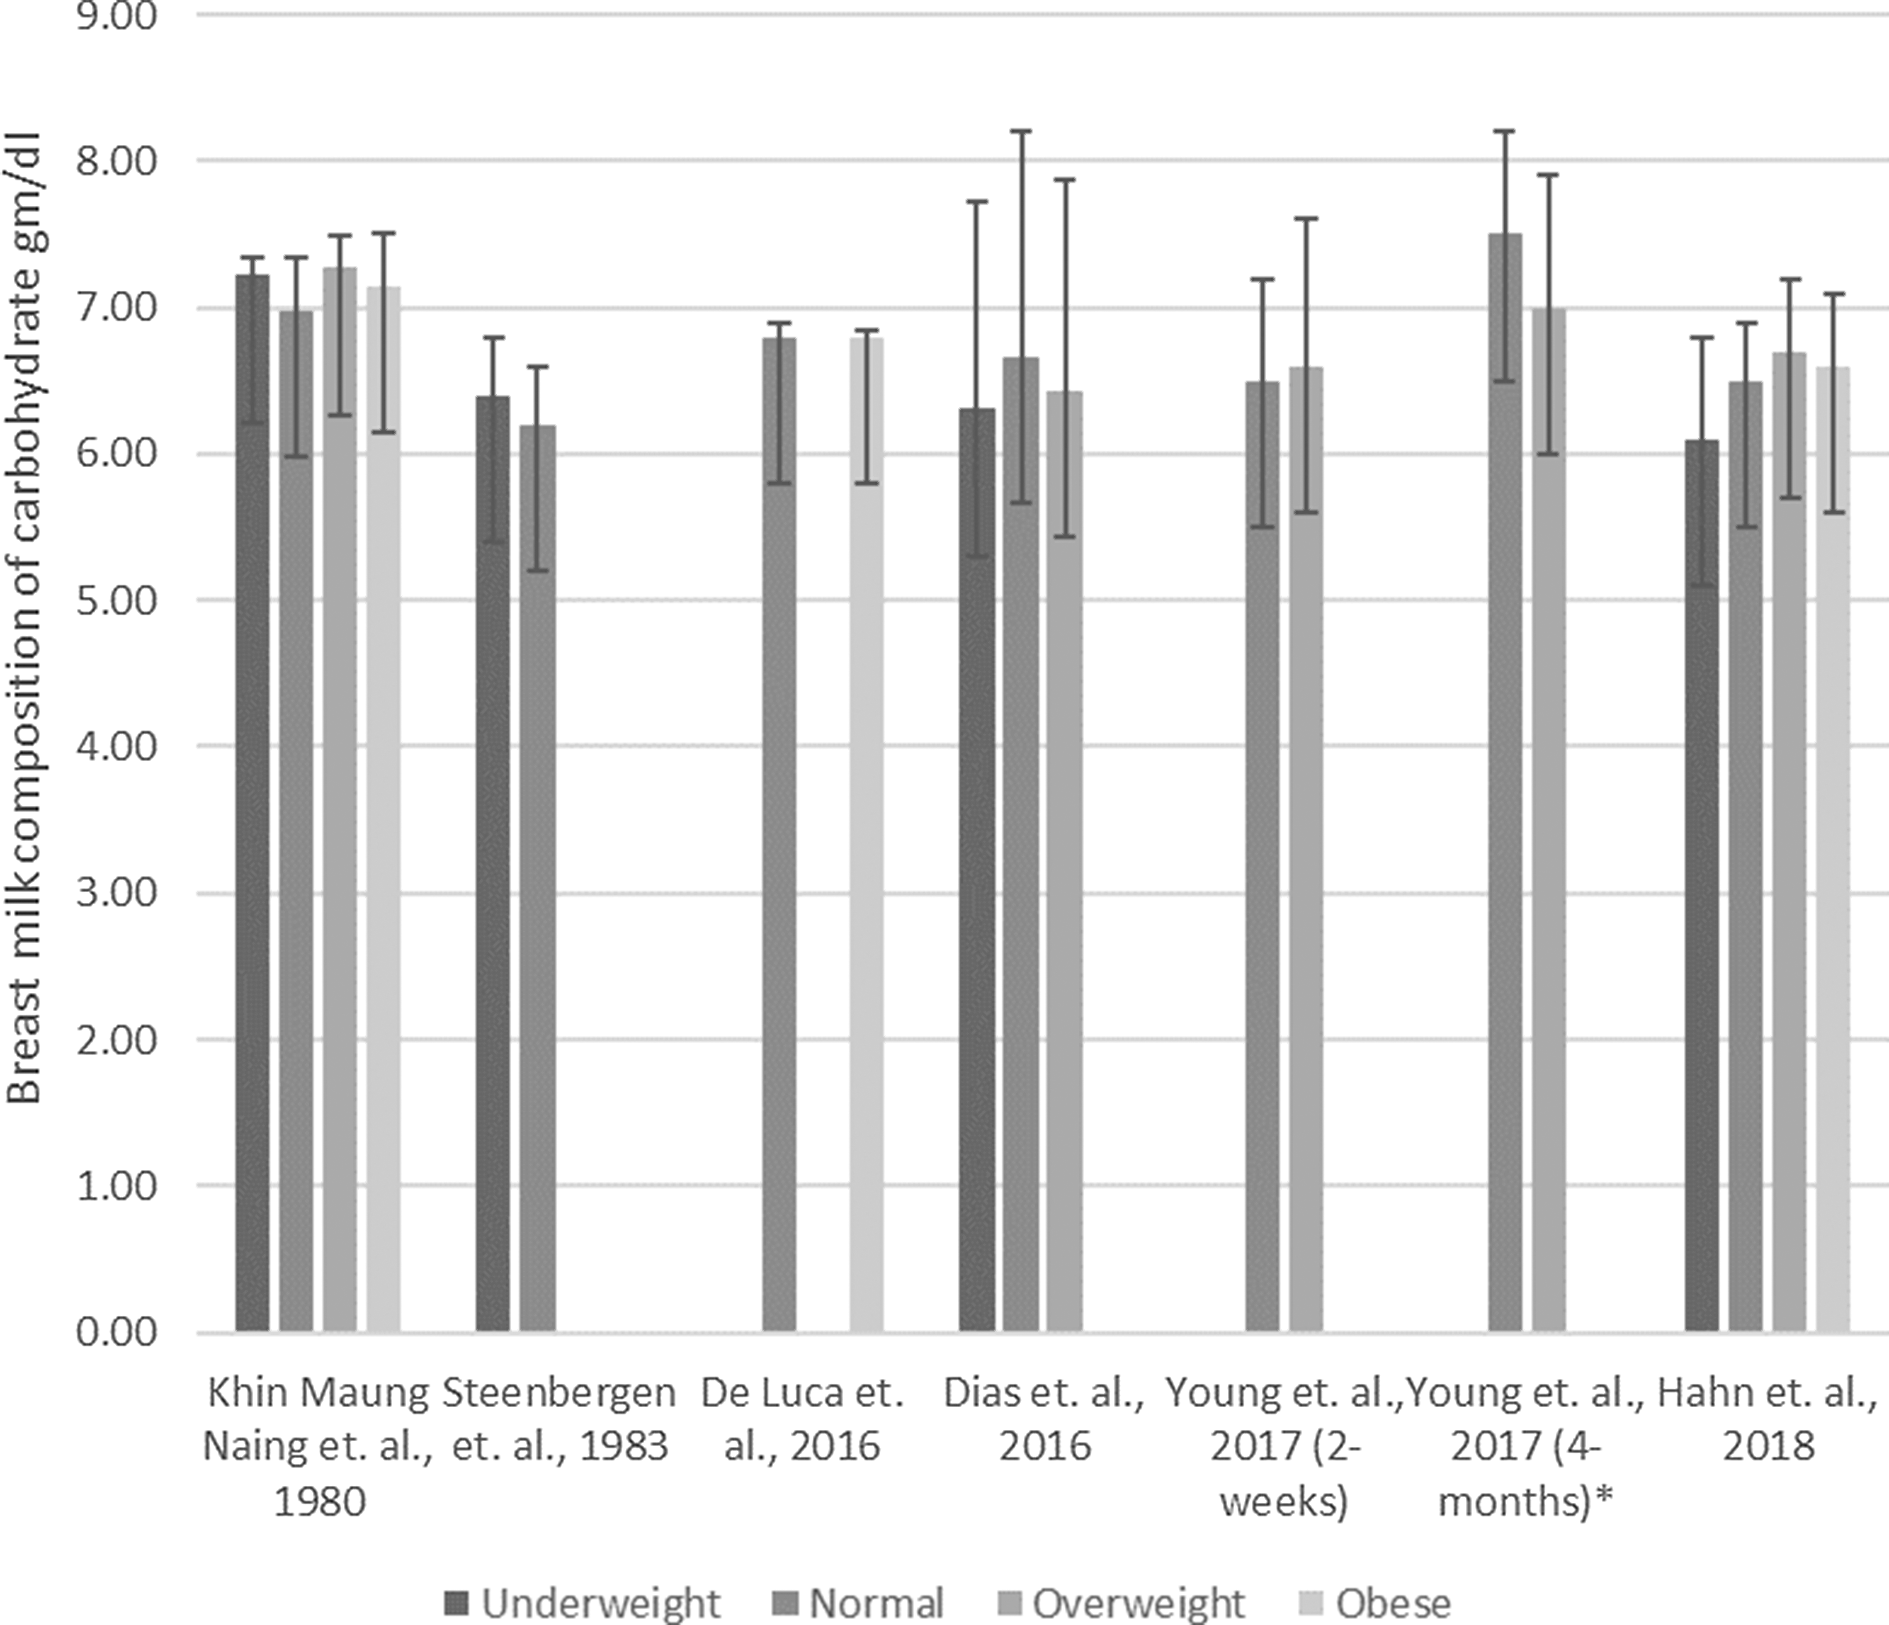
Fig. 5. Association between maternal nutrition status with breast milk composition of carbohydrate. ![]() , Underweight;
, Underweight; ![]() , Normal;
, Normal; ![]() , Overweight;
, Overweight; ![]() , Obese. Studies followed with an asterisk (*) reported a significant association
, Obese. Studies followed with an asterisk (*) reported a significant association
Discussion
Various reviews summarised available data on maternal dietary intake and BM composition(Reference Bravi, Weins and Decarli5,Reference Keikha, Bahreynian and Saleki9,Reference Innis67) . However, an overview linking maternal nutritional status and BM composition is still lacking. We summarised current evidence on the potential relation between maternal nutrition status, nutrient intake and human BM composition. Evaluation of data from fifty human observational studies and trials among ‘disease-free’ mothers and their term-delivered children showed that literature is diversified, both in terms of methodology and results. The diversified results may relate to variability in sample size, participant characteristics, sample collection methods, statistical approach, markers for nutritional status used as well as various sources of bias related to dietary intake assessment such as response bias and reactivity bias. Future well-designed studies considering these aspects are needed to strengthen the evidence on the link between maternal nutritional status, dietary intake and BM composition. The potential role of above listed co-factors will be discussed in more detail below.
In terms of study design, sample sizes for the studies included in this review ranged from three participants to 2632 participants; twenty-three of fifty studies were conducted among < 50 participants and eight studies included < 20 participants. Small sample sizes may limit statistical power to detect associations if actually present, and as such lead to accepting a null hypothesis that is actually not true. However, so far twenty-one studies were conducted with less than fifty participants of which nine did not show any association, whereas of the twenty-nine studies with more than fifty participants, seven did not show any association. Furthermore, while designing the study, many studies did not account for potential relevant covariates such as maternal age(Reference Bravi, Weins and Decarli5,Reference Lubetzky, Sever and Mimouni68) or postpartum age(Reference Ballard and Morrow69,Reference Gidrewicz and Fenton70) of the participants. More specifically, only one study adjusted for maternal age(Reference Chang, Jung and Kim21), one stratified data according to age group(Reference Hahn, Jeong and Park18) and eight studies included both mothers with postpartum age of ≥6 months and <6 months(Reference Chang, Jung and Kim21,Reference Quinn, Diki Bista and Childs24,Reference Kim, Kim and Lee25,Reference Aumeistere, Ciproviča and Zavadska30,Reference Quinn, Largado and Power37,Reference Park, McGuire and Behr53,Reference Wurtman and Fernstrom54,Reference Masters, McGuire and Beerman59) . Data indicate that protein composition of BM produced at 10/12 weeks postpartum is 0·3 g/100 ml higher than BM produced 3/4 weeks postpartum(Reference Gidrewicz and Fenton70). As such, insufficiently accounting for postpartum age increases variation in BM macronutrients concentrations independent of maternal dietary intake, which may attenuate the associations under study. Moreover, a 24-h BM collection is considered the most representative technique to collect BM samples in order to account for circadian variation(Reference Leghi, Middleton and Muhlhausler75). However, only eight studies conducted a 24-h BM collection(Reference Lubetzky, Moimouni and Dollberg76). Accordingly, whereas compositional differences have also been shown for fore and hind milk(Reference van Sadelhoff, Mastorakou and Weenen8), fifteen studies used either foremilk or hind milk. Besides, definitions used for foremilk and hind milk differed across studies.
In terms of methodology, although short-term and long-term freezing of BM milk alters BM composition(Reference Chang, Chen and Lin77,Reference García-Lara, Escuder-Vieco and García-Algar78) , milk samples were frozen before analysis in more than half of the included studies. Additionally, a diverse set of tools to assess maternal dietary intake were used, ranging from either weighed or estimated food records for 1 d or more days, recalls for 1 d or more days, to FFQ. Whereas 1- or 2-d food records and recalls usually represent actual intake, food records and recalls assessed at more days as well as FFQ are usually administered to assess habitual intake. In addition, besides the more technical aspects, maternal weight status is a more physiological aspect that deserves some discussion. BM composition of normal-weight mothers – based on BMI – has been shown to significantly differ compared with BM composition of overweight mothers but not with obese mothers(Reference Bachour, Yafawi and Jaber36). Most of the studies did not classify mothers into overweight and obese. Barbosa et al. showed difference in BM composition of fat in mothers classified as lower BMI group (BMI < 23 kg/m2) and higher BMI group (BMI ≥ 23 kg/m2)(Reference Barbosa, Butte and Villalpando62). In addition, this review was conducted without date restriction, which resulted in the inclusion of studies published from 1963 till 2018. Consequently, technological innovations may also have contributed to heterogeneity across studies. To illustrate, in terms of maternal nutritional status classification, the applied methods ranged from weight-for-height, skin fold thickness, BMI to using bioelectric impedance analysis to measure body fat content(Reference Bhattacharya, Pal and Mukherjee71,Reference Maksimović, Gudelj Rakić and Vlajinac72) . Although BMI and MUAC were the most frequently used methods, more recent methods such as bioelectric impedance analysis have been suggested to be more accurate to predict fat mass and fat-free mass(Reference Kettaneh, Heude and Lommez73). It is also important to consider potential differences depending on the weight status of the mothers. This should be accounted for while studying BM composition with maternal nutritional status. Likewise, methods used to measure BM macronutrients composition varied across studies as well, whereas the human milk analyser was more frequently used in recent studies. Although the human milk analyser tends to underestimate fat content by 12 % as compared with the Rose–Gottlieb method, no significant differences in protein and lactose estimates have been observed as compared with the Kjeldahl and high-performance anion exchange chromatography-pulsed amperometric detection method(Reference Giuffrida, Austin and Cuany74). However, it should be considered that human milk analysers are considerably rapid tools that can measure with smaller BM sample and have fairly reliable association with the standard methods of macronutrient measurement. Therefore, analytical methods, techniques used to assess nutritional status, circadian variation, use of fore or hind milk, sample handling, applied dietary assessment methodology as well as maternal weight status can be considered additional factors adding to the heterogeneity across studies. It may be clear, that the results of this review need to be evaluated in light of the above discussed methodological issues.
When focusing on the results of this review in more detail, 67 % of the studies on maternal dietary intake and 54 % studies on nutritional status showed significant associations with BM energy content, which again highlights the variability of current evidence. All studies, except one(Reference Bzikowska-Jura, Czerwonogrodzka-Senczyna and Oledzka29), that showed significant associations with BM energy content also showed associations with at least one BM macronutrient, particularly BM fat content(Reference Mohammad, Sunehag and Haymond14,Reference Yahvah, Brooker and Williams32,Reference Park, McGuire and Behr53) . Interestingly, some of the studies that did not show associations between maternal dietary intake and BM fat content were conducted using frozen milk samples(Reference Bzikowska-Jura, Czerwonogrodzka-Senczyna and Oledzka29,Reference Rakicioglu, Samur and Topcu38,Reference Antonakou, Skenderi and Chiou42,Reference Vuori, Kiuru and Makinen43,Reference Wurtman and Fernstrom54,Reference Finley, Lonnerdal and Dewey55) . Various studies, though definitely not all, also observed associations between maternal dietary intake and nutritional status, and BM protein intake. In addition to the more generic methodological factors as listed above, variability in BM protein concentration may be attributed to the type of measurement, for example, true protein measurement against calculated protein content using nitrogen estimates(Reference Gidrewicz and Fenton70). The inaccuracies in protein quantification can be attributed to protein and non-protein nitrogen determination, indirect conversion to protein content or interference from other chemical substances. While amino acid analysis, due to lack of interfering substances, can quantify protein content more accurately(Reference Mæhre, Dalheim and Edvinsen79). BM carbohydrate composition seemed to be most stable across studies, which is in line with current literature even during the course of lactation(Reference John, Sun and Maillart80). Though, variability in BM carbohydrate composition has been reported based on the quantity of milk produced, that is, showing higher BM lactose concentrations among mothers producing higher milk quantities(Reference Nommsen, Lovelady and Heinig51). Another factor worth mentioning is that in some cases, BM carbohydrate content is measured and referred to as lactose content. Although total BM carbohydrate mainly consists of lactose, it also consists of other oligosaccharides and as such total BM carbohydrate and lactose concentrations cannot be considered completely comparable measures(Reference Ballard and Morrow12).
Given the diversified methodology and results of current literature, future well-powered studies using the most optimal standardised approaches to further elucidate the nature and strength of the association between maternal dietary intake and nutritional status, and BM composition are clearly needed. In terms of maternal dietary intake, it is key to clearly define the parameter(s) of interest, identify whether the (se) parameter(s) warrant assessment of actual or habitual diet or both and subsequently select the most suitable assessment tool, which may be a self-report tool – retrospective or real-time assessment(Reference Brouwer-Brolsma, Lucassen, Rijk, Athanasiadis, Frysinger and Schimak81) – but could also be an objective nutritional biomarker, or a combination(Reference Brouwer-Brolsma, Brennan and Drevon82). A bioelectric impedance analysis uses population-specific equation to calculate body compositions and comes with limitations such as high vulnerability to hydration status of the participant and measurement errors. A dual-energy x-ray absorptiometry scan provides a more objective and accurate measure of lean body mass and fat mass within a relatively short time, but it should also be emphasised that dual-energy x-ray absorptiometry is financially and logistically more challenging as well as more burdensome for the participant(Reference Madden and Smith83,Reference Smith and Madden84) . In terms of nutritional status assessment by anthropometric assessments, a combination of measures would be ideal as related to potential measurement error. In terms of quantifying BM composition, collection protocols should ideally strive for a 24 h sample collection, that is, sample collection during each feeding, to account for circadian variation. Moreover, the sample should contain a balanced mixture of fore and hind milk, which can be done by either collecting equal amount of fore and hind milk or by collecting an aliquot from a whole breast emptying. In terms of study design, research should aim for minimal longitudinal variations related to postpartum age by targeting on a narrower inclusion window with respect to postpartum age (e.g. 1–3 months v. 3–6 months v. ≥ 6 months). Moreover, although logistically challenging, freezing of BM should ideally be avoided(Reference Chang, Chen and Lin77,Reference García-Lara, Escuder-Vieco and García-Algar78) . If deviations from the proposed approach are unavoidable, they should be properly accounted for, for example, by means of statistical approaches.
A limitation of this review is that the large variation in assessment methods for maternal dietary intake, maternal nutritional status and BM composition; limited sample sizes; as well as the often insufficient consideration of potentially confounding factors resulted in diversified findings across studies, which inhibited us to draw strong conclusions about the associations under study. Another aspect that needs to be noted is that we summarised available evidence on the associations between maternal diet and nutritional status, and BM macronutrient composition. As such, this review does not account potential influences of the maternal exposures on BM micronutrient composition. Strengths of this review include the systematic approach, duplicate screening of references, broad inclusion range in terms of publication year and the included quality assessment.
Conclusion
To conclude, it is widely acknowledged that BM is the best food for infants(1). Still, given the fact that the global prevalence of child malnutrition (stunting) in the year 2019 is 21·3 %(85), research on maternal determinants of BM composition is crucial and may eventually help to improve nutritional status of infant(Reference Andreas, Kampmann and Mehring Le-Doare86). This review provides an overview of the studies that reported on associations between maternal dietary intake, maternal nutritional status and BM composition of macronutrients and highlights the diversified methodological approaches as well as associated results. Future studies investigating association of maternal nutrition and BM composition should carefully define (postpartum) age ranges and apply standardised milk collection procedures, storage and analysis techniques. Moreover, attention should be given to ensure the most optimal statistical approach, including adequate adjustment for covariates.
Acknowledgements
S. A. (100 %) and J. N. (5 %) screened and evaluated the publications to include in the review. S. A. collected data and wrote the first draft. E. M. B.-B. and U. K. contributed to the plan of research and subsequent drafts of manuscript. All authors approved the final version of the submitted publication.
There is no funders to report for this submission.
All authors confirm that there are no conflicts of interest.
Supplementary material
For supplementary material referred to in this article, please visit https://doi.org/10.1017/S0007114521002786


