


Caenorhabditis elegans feeds on Escherichia coli as food and lives for approximately 1 month on a nematode growth medium (NGM) plate. C. elegans is a commonly used model organism owing to its transparent body and ease of culture( Reference Stiernagle 1 ). In addition, its short life span and genetic similarity with higher animals renders it suitable for studying longevity and as a model organism for various biological assays. Furthermore, its genome and cell lineages are well described. Lately, it has been used to evaluate the effect of certain food and their related functional components, including the anti-ageing effect of nucleoprotein extracted from salmon milt( Reference Shintani, Furuhashi and Hano 2 ), longevity and stress tolerance effects of catalpol extracted from rehmannia roots( Reference Seo, Cheon and Lee 3 ), longevity effect of oreanolic acid( Reference Zhang, Lu and Zhou 4 ) and others by feeding them along with E. coli to C. elegans.
The first longevity genes described in budding yeast, C. elegans and Drosophila were the sirtuin genes. Longevity genes such as SIR2 and TOR1 of budding yeast( Reference Ha and Huh 5 , Reference Medvedik, Lamming and Kim 6 ); sir-2.1, daf-16 and age-1 of C. elegans ( Reference Lithgow, White and Melov 7 , Reference Rizki, Iwata and Li 8 ); and Sir2 and dFOXO of Drosophila( Reference Hwangbo, Palmer and Tatar 9 ) are well described. These genes mediate longevity( Reference Ogg, Paradis and Gottlieb 10 – Reference Lee, Kennedy and Tolonen 12 ), lower the reactive oxygen species (ROS) level( Reference Seo, Cheon and Lee 3 , Reference Klotz, Sánchez-Ramos and Prieto-Arroyo 13 ), suppress ageing( Reference Shintani, Furuhashi and Hano 2 ) and increase stress tolerance( Reference Seo, Cheon and Lee 3 , Reference Zhang, Lu and Zhou 4 ). For example, activated DAF-16 translocates into the nucleus and acts as a transcription factor( Reference Lee, Hench and Ruvkun 14 ) for genes related to stress tolerance, such as sod-3 ( Reference Honda and Honda 15 , Reference Zhao, Yang and Rui 16 ) and hsp-12.6 ( Reference Hsu, Murphy and Kenyon 17 ). Up-regulation of these genes prolongs the life span of the nematode and increases stress tolerance( Reference Tissenbaum and Guarente 11 , Reference Tissenbaum and Guarente 18 ). Conversely, deficiency of these genes shortens the life span and decreases stress tolerance( Reference Rogina and Helfand 19 , Reference Johnson, Henderson and Murakami 20 ). Longevity genes are also found in higher animals. For example, humans possess approximately fifty members of the FOX transcription factors( Reference Lam, Brosens and Gomes 21 , Reference Katoh and Katoh 22 ). FoxO, a member of the FOX transcription factor family, is the homologue of the C. elegans daf-16 ( Reference Kim, Ishihara and Lee 23 ) and Drosophila dFOXO ( Reference Jünger, Rintelen and Stocker 24 ).
In 1908, Metchnikoff first described that Bulgarians ingesting Lactobacillus regularly by consuming yogurt showed longevity( Reference Metchnikoff and Chalmers-Mitchell 25 , Reference Anukam and Reid 26 ). This is the first description of the association between longevity and probiotics. Bifidobacterium is a well-known probiotic and constitutes the majority of the intestinal flora in infants( Reference Mitsuoka and Hayakawa 27 ). Although the proportion is reduced after infancy, the number of Bifidobacterium longum (BL) in the intestine is 100–1000 times higher than that of Lactobacillus ( Reference Mitsuoka and Hayakawa 27 ), and BL is known to promote the health of the host. Recent studies have described several physiological effects of BL, such as to regulate intestinal function and its beneficial effects in immunity and allergy reduction( Reference Zhang, Chen and Zheng 28 , Reference Noriyuki 29 ). Furthermore, the role of Bifidobacterium in suppression of cancer has been reported( Reference Singh, Rivenson and Tomita 30 ). Despite the potential benefits of Bifidobacterium mentioned above, its physiological effects on longevity and anti-ageing and their mechanisms are not well described. Here, we evaluated the effects of heat-killed BL (BR-108). Killed bacteria were used in this study, considering bacteria ingested by humans are likely to be killed by digestive juices. We aimed to analyse the physiological effects of BL on stress tolerance, anti-ageing and longevity in C. elegans and their mechanisms.
Methods
Nematode and Bifidobacterium
C. elegans strains used in this study were as follows: N2 Bristol (wild type), daf-16 (mgDf50), sir-2.1 (ok434), skn-1 (tm4241), col-19::GFP (TP12), daf-16::GFP (TJ356) (obtained from the Caenorhabditis Genetics Center, University of Minnesota) and skn-1 (tm4241) (obtained from the National BioResource Project, Tokyo Women’s Medical University). The nematodes were cultured at 20°C on NGM plates spread with E. coli (OP50)( Reference Stiernagle 1 ). BL (BR-108) sterilised at 105°C for 20 min was obtained from the Combi Corporation.
Nematode synchronisation
To collect eggs, adult nematodes were crushed in NaClO solution (1:10 of 10m NaOH (Wako Pure Chemical Industries, Ltd) and NaClO (Haiter; KAO)). This method was used to synchronise the nematode growth level.
Body length measurement
Synchronised worms were placed on NGM plates spread with OP50 only (OP plates) or along with BL at various concentrations (BL plates; 1·0, 2·0, 3·0 or 5·0 mg/ml) and cultured at 20°C for 96 h. Thereafter, the worms were fixed with 10 % ethanol (Kanto Chemical Co., Inc.) and observed under a BZ8000 microscope (Keyence Corporation). Body length was determined using the ImageJ software (NIH). The body length of the control worms was set as 100 % and >30 worms were evaluated per group.
Measurement of COL-19 expression
COL-19 expression was used as the indicator for ageing, and adult col-19::GFP (TP12) worms expressing fluorescent COL-19 protein were used in the experiment. Synchronised TP12 worms were cultured on OP or BL plates (0·5 or 5·0 mg/ml) at 20°C for 52 h. Thereafter, the worms were fixed with 10 % ethanol and observed under a BZ8000 microscope. The fluorescence was analysed using the ImageJ software. The fluorescence of control worms was set as 100 % and >25 worms were evaluated per group.
Evaluation of nematode motility
The movement of wild-type, MgDf50 and tm4241 worms was evaluated. Synchronised worms were cultured on OP plates for 96 h and then transferred to OP or BL plates (0·5 or 5·0 mg/ml). The day of the initial transfer to OP or BL plates was designated as day 0. The worms were then transferred to new plates every 3 d and thrashing movement of the worms was counted on each transfer day. To prevent offspring generation, 0·5 mg/ml FUdR (2’-deoxy-5-fluorouridine; Wako Pure Chemical Industries, Ltd) was added into the plates at days −1, 0 and 3. The movement at day 0 was set as 100 % and 10 worms were evaluated per group.
Assessment of heat stress tolerance
Synchronised worms were cultured on OP or BL plates (0·5 or 5·0 mg/ml) at 20°C for 96 h and then incubated at 37°C for 3·5 h. The day of heat application was designated as day 0. As described above, 0·5 mg/ml FUdR was applied to the plates at days −1 and 0. The survival rate of thirty worms/group was evaluated every 2 d.
Generally, heat stress decreased the worm movement. To measure the recovery rate from heat stress, synchronised worms were cultured on OP or BL plates (0·5 or 5·0 mg/ml) for 96 h and then transferred to OP plates and incubated at 35°C for 4 h. The time of heat application was designated as the 0 h, and thrashing movement was counted every 12 h. In parallel, the movement of worms kept at 20°C instead of 35°C was counted. The ratio of movement count of worms cultured at 35°C and 20°C was calculated and the results are presented. The movement of ten worms/group was counted.
In addition to that in wild-type worms, the recovery from heat stress in mgDf50 and tm4211 mutant worms was also evaluated using the method described above. The worms were cultured on OP or BL plates (5·0 mg/ml), and thrashing movement of mgDf50 and tm4211 worms was counted every 12 and 6 h, respectively. The movement of 10 worms/group was counted.
Evaluation of oxidative stress tolerance
Synchronised worms were cultured on OP or BL plates (0·5 or 5·0 mg/ml) for 96 h and then transferred to 500 µl of 0·3 % H2O2 (Sigma-Aldrich Japan) in a 24-well plate (Techno Plastic Products AG). The time of transfer was designated as the 0 h. The worm survival rate was determined every hour starting from 2 h after the transfer. The survival rate at 0 h was set as 100 %, and 24 worms were assessed per group.
Tolerance to oxidative stress in mgDf50 and tm4211 worms was also evaluated using the method described above. The worms were cultured on OP or BL plates (5·0 mg/ml) and 24 worms were assessed per group.
Evaluation of life span
Synchronised worms were cultured on OP plates for 96 h and then transferred to OP or BL plates (5·0 mg/ml). The day of the initial transfer to OP or BL plates was designated as day 0. The worms were then transferred to new plates every 2 d. Alive and dead worms were counted on each transfer day. Worms that displayed no movement upon gentle probing with a platinum picker were judged as dead. As described above, 0·5 mg/ml FUdR was added into the plates at days −1, 0, 2 and 4. In addition to that of wild-type worms, the life span of MgDf50, ok434 and tm4241 worms was also assessed. The survival rate of sixty worms/group was determined.
Evaluation of fat accumulation
Synchronised worms were cultured on OP or BL plates (0·5 or 5·0 mg/ml) for 96 h and then fixed with 4 % PFA (Wako Pure Chemical Industries, Ltd) at 4°C. Fixed worms were washed and then placed in plates containing 500 µl of 5 µg/ml Nile red (Wako Pure Chemical Industries, Ltd) for 10 min at 4°C. Subsequently, the worms were washed again twice and fluorescence was captured using a BZ8000 microscope and analysed using the ImageJ software. The fluorescence of control worms was set as 100 %, and >35 worms were evaluated for each group.
Mitochondria activation assay
Synchronised worms were cultured on OP or BL plates (5·0 mg/ml) for 72 h. To evaluate the mitochondrial membrane potential and mitochondrial ROS, 0·5 mg/ml MitoTracker Orange CMTMRos (Thermo Fisher Scientific, Inc.) and 0·5 mg/ml MitoTracker Orange CM-H2TMRos (Thermo Fisher Scientific) were added into the plates at a volume of 400 µl. After 24 h, the worms were washed and then fixed with 10 % ethanol. The fluorescence was captured using a BZ8000 microscope and analysed using the ImageJ software. The fluorescence level of control worms was set as 100 %, and >55 worms/group were analysed.
Cellular localisation of DAF-16
The cellular localisation of DAF-16 was assessed in TJ356 worms. Synchronised worms were cultured on OP or BL plates (1·0, 2·0, 3·0 or 5·0 mg/ml) for 96 h and then fixed with 10 % ethanol. Fluorescence images were captured using a BZ8000 microscope and analysed using the ImageJ software. Activated DAF-16 could be observed as bright dots. DAF-16 cellular localisation pattern in the worms can be classified into the following types: nucleus, partially nucleus, and cytoplasmic. More than twenty worms were assessed per group.
Gene expression analysis
Synchronised worms were cultured on OP or BL plates (0·5 or 5·0 mg/ml) for 96 h. For mRNA extraction, the worms were crushed using the Power Masher II and Bio Masher II (Nippi, Inc.). The PrimeScript RT Reagent Kit with gDNA Eraser (Takara Bio Inc.) was used for the complementary DNA synthesis. Subsequently, quantitative PCR (qPCR) was performed using the Thunderbird SYBR qPCR Mix (Toyobo) and gene-specific primers (Table 1) in a Thermal Cycler Dice Real Time System Lite (Takara Bio Inc.) instrument. Actin was used as the reference gene, and each qPCR reaction was performed in triplicate wells.
Table 1 Sequences of primers used in the gene expression analysis

Statistical analysis
Data are shown as the means with their standard errors. Tukey’s test and log-rank test were used for the data analysis. Graphs were generated using the Microsoft Excel and PowerPoint software (Microsoft Corp.). P values <0·05 indicate statistically significant differences.
Results
Nematode growth and development
BL supplementation shortened the body length of the worms in a dose-dependent manner (Fig. 1(a)). As assessed by fluorescence, BL supplementation decreased the expression of COL-19 in TP12 worms in a dose-dependent manner (Fig. 1(b)).
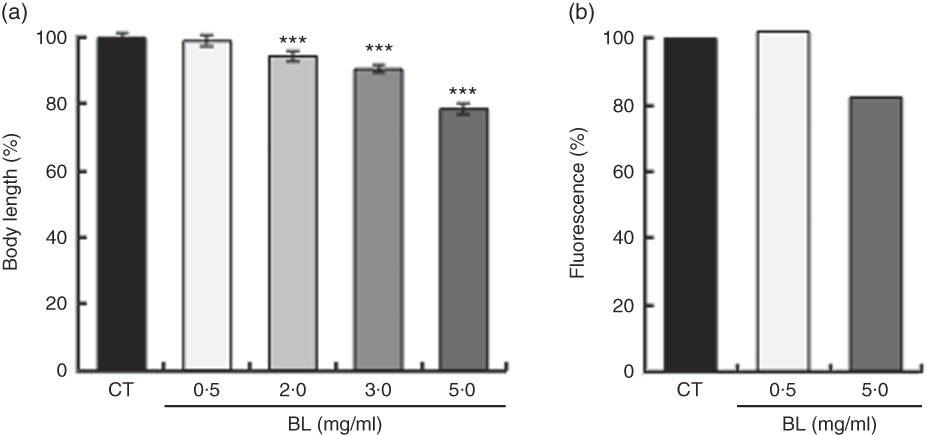
Fig. 1 Effects of Bifidobacterium longum (BL) on worm growth and development. (a) Synchronised worms were placed on plates containing Escherichia coli (OP50) alone (OP plates; CT) or with different concentrations of killed BL (1·0, 2·0, 3·0 or 5·0 mg/ml). Worms were cultured on these plates for 96 h. (b) Synchronised TP12 worms were cultured on OP (CT) or BL plates (0·5 or 5·0 mg/ml) for 52 h. In both assays, the worms were fixed in 10 % ethanol and observed under a microscope to assess body length and fluorescence. The body length and fluorescence of control worms were set as 100 %. Values are means (n>30 and n>25 for the two assays, respectively), with their standard errors represented by vertical bars. *** P<0·005 by Tukey’s t test.
Anti-ageing effects of Bifidobacterium longum
Generally, all worms displayed reduced motility over the course of the experiment. However, wild-type N2 worms fed killed BL displayed increased motility compared with control worms fed E. coli alone. At day 9, worms fed 0·5 mg/ml and 5 mg/ml BL showed a 6- and 9-fold higher average of thrashing movements, respectively, compared with those fed E. coli only (Fig. 2(a)). However, BL supplementation failed to conserve the movement of ageing tm4241 worms, whereas mgDf50 worms fed BL displayed reduced motility than those fed E. coli alone (Fig. 2(b)).
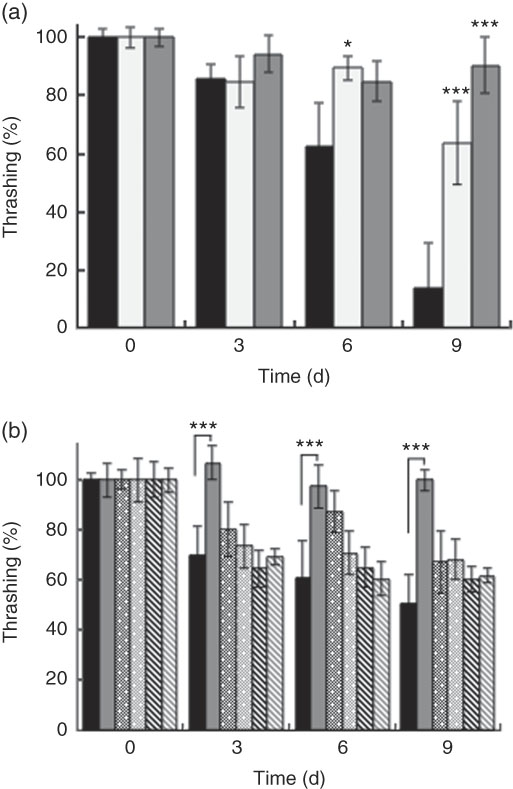
Fig. 2 Effects of Bifidobacterium longum (BL) on worm movement. Synchronised (a) N2 worms or (b) N2, MgDf50 and tm4241 worms were cultured on plates with Escherichia coli (OP50) (OP plates) for 96 h and then transferred to OP plates (CT) or plates with killed BL (a: 0·5 or 5·0 mg/ml; b: 5·0 mg/ml), which was designated as day 0. The worms were then transferred to new plates every 3 d and thrashing movement of the worms was counted on each transfer day. To prevent offspring generation, 0·5 mg/ml FUdR was added to the plates at days −1, 0 and 3. The movement count at day 0 was set as 100 %. Values are means (n 10 per group), with their standard errors represented by vertical bars. a: ![]() , CT;
, CT; ![]() , BL 0·5;
, BL 0·5; ![]() , BL 5·0 (mg/ml); b:
, BL 5·0 (mg/ml); b: ![]() , CT (N2);
, CT (N2); ![]() , BL 5·0 (N2);
, BL 5·0 (N2); ![]() , CT (mgDf50);
, CT (mgDf50); ![]() , BL 5·0 (mgDf50);
, BL 5·0 (mgDf50); ![]() , CT (tm4241);
, CT (tm4241); ![]() , BL 5·0 (tm4241) (mg/ml). * P<0·05, *** P<0·005 by Tukey’s t test.
, BL 5·0 (tm4241) (mg/ml). * P<0·05, *** P<0·005 by Tukey’s t test.
Bifidobacterium longum increased the nematode tolerance to heat and oxidative stress
Supplementation with killed BL in wild-type N2 worms improved the worm survival during heat stress in a dose-dependent manner (Fig. 3(a)). BL also increased the rate of recovery from heat stress (Fig. 3(b) and (d)) in wild-type N2 worms. Together, these findings suggested that BL increased tolerance to heat stress in C. elegans. However, BL did not increase the recovery rate of mgDf50 worms (Fig. 3(c)), but increased that of tm4241 worms (Fig. 3(d)).
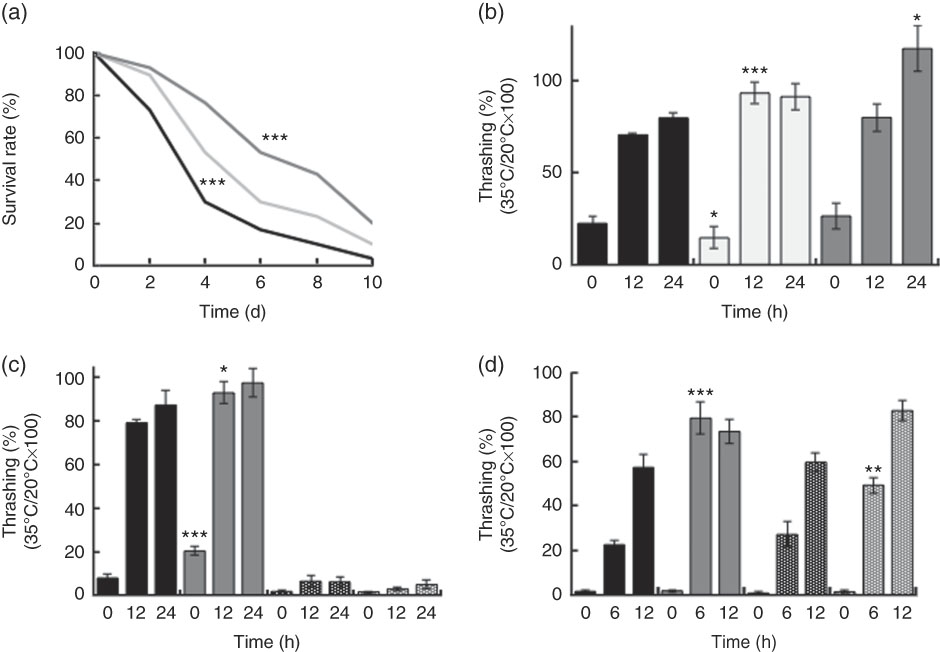
Fig. 3 Heat stress tolerance of worms fed Bifidobacterium longum (BL). (a) Synchronised wild-type N2 worms were cultured on plates with Escherichia coli (OP50) alone (OP plates; CT) or with killed BL (BL plates; 0·5 or 5·0 mg/ml) for 96 h and then heated at 37°C for 3·5 h, which was designated as day 0. To prevent offspring generation, 0·5 mg/ml FUdR was added into the plates at days −1 and 0. The worm survival was recorded every 2 d, n 30/group. *** P<0·005 by log-rank test. (b–d) Synchronised wild-type N2 worms, as well as mgDf50 (c) and tm4211 worms (d), were cultured on OP (CT) or BL plates (b, 0·5 or 5·0 mg/ml; c–d, 5·0 mg/ml) for 96 h and then transferred to OP plates and either left at 20°C or heated at 35°C for 4 h (the time of heat application was designated as 0 h). Thrashing movement was counted every 12 or 6 h. The ratio of movement count of worms cultured at 35°C and 20°C was calculated. Values are means (n 10 per group), with their standard errors represented by vertical bars. a: ![]() , CT;
, CT; ![]() , BL 0·5;
, BL 0·5; ![]() , BL 5·0 (mg/ml); b:
, BL 5·0 (mg/ml); b: ![]() , CT;
, CT; ![]() , BL 0·5;
, BL 0·5; ![]() , BL 5·0 (mg/ml); c:
, BL 5·0 (mg/ml); c: ![]() , CT (N2);
, CT (N2); ![]() , BL 5·0 (N2);
, BL 5·0 (N2); ![]() , CT (mgDf50);
, CT (mgDf50); ![]() , BL 5·0 (mgDf50) (mg/ml); d:
, BL 5·0 (mgDf50) (mg/ml); d: ![]() , CT (N2);
, CT (N2); ![]() , BL 5·0 (N2);
, BL 5·0 (N2); ![]() , CT (tm4241);
, CT (tm4241); ![]() , BL 5·0 (tm4241) (mg/ml). * P<0·05, ** P<0·01, *** P<0·005 by Tukey’s t test.
, BL 5·0 (tm4241) (mg/ml). * P<0·05, ** P<0·01, *** P<0·005 by Tukey’s t test.
Similarly, BL increased the survival rate during oxidative stress in a dose-dependent manner (Fig. 4(a)) in wild-type N2 worms. In contrast to the findings on heat stress, BL also increased the survival rate of both mgDf50 (Fig. 4(b)) and tm4241 worms (Fig. 4(c)).

Fig. 4 Oxidative stress tolerance of worms fed Bifidobacterium longum (BL). Synchronised wild-type N2 (a–c), as well as mgDf50 (b) and tm4211, worms (c) were cultured on plates with Escherichia coli (OP50) alone (OP plates; CT) or with killed BL (BL plates; a: 0·5 or 5·0 mg/ml; b–c: 5·0 mg/ml) for 96 h and then transferred to a 24-well plate with 500 µl of 0·3 % H2O2 (the time of worm transfer was designated as 0 h). The survival rate was assessed hourly starting at 2 h after the transfer. The survival rate at 0 h was set as 100 %. a: ![]() , CT;
, CT; ![]() , BL 0·5;
, BL 0·5; ![]() , BL 5·0 (mg/ml); b:
, BL 5·0 (mg/ml); b: ![]() , CT (N2);
, CT (N2); ![]() , BL 5·0 (N2) (mg/ml);
, BL 5·0 (N2) (mg/ml); ![]() , CT (mgDf50);
, CT (mgDf50); ![]() , BL 5·0 (mgDf50) (mg/ml); c:
, BL 5·0 (mgDf50) (mg/ml); c: ![]() , CT (N2);
, CT (N2); ![]() , BL 5·0 (N2);
, BL 5·0 (N2); ![]() , CT (tm4241);
, CT (tm4241); ![]() , BL 5·0 (tm4241) (mg/ml). * P<0·05, ** P<0·01, *** P<0·005, ††† P<0·005 by log-rank test, n 24 per group.
, BL 5·0 (tm4241) (mg/ml). * P<0·05, ** P<0·01, *** P<0·005, ††† P<0·005 by log-rank test, n 24 per group.
Bifidobacterium longum affected longevity, fat accumulation and mitochondrial activity
Wild-type N2 worms fed killed BL showed significantly longer life span when compared with those fed E. coli only (Fig. 5(a)). However, BL did not improve the longevity of mgDf50 (Fig. 5(b)), ok434 (Fig. 5(c)) or tm4241 worms (Fig. 5(d)).
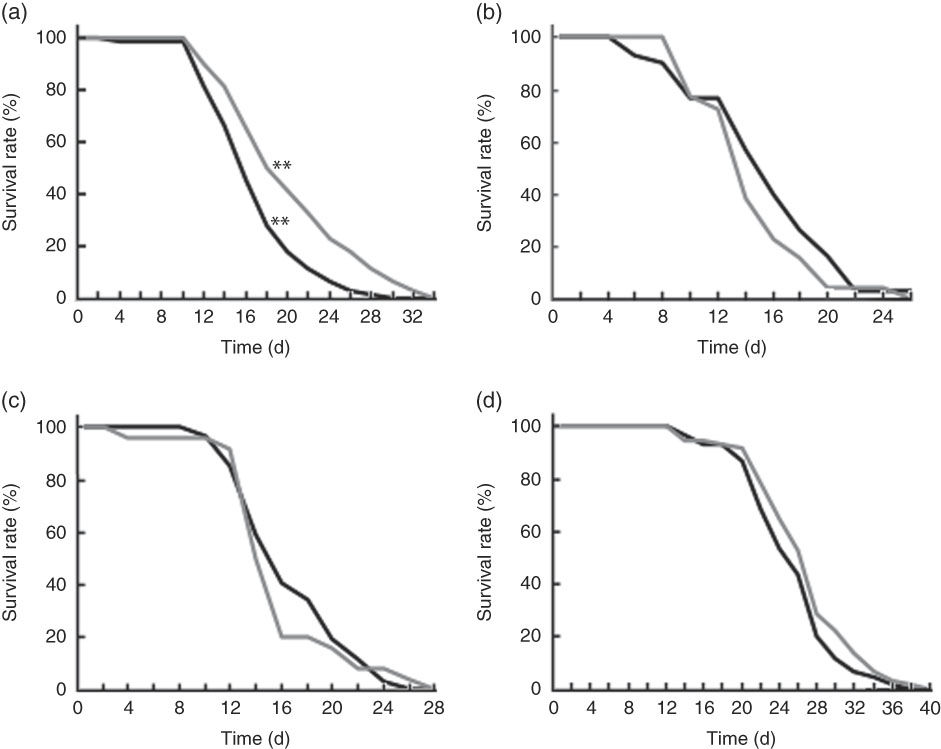
Fig. 5 Life span of worms fed Bifidobacterium longum (BL). Synchronised wild-type N2 (a), MgDf50 (b), ok434 (c) and tm4241 worms (d) were cultured on plates with Escherichia coli (OP50) (OP plates) for 96 h and then transferred to a new OP plate (CT) or plates with killed BL (5·0 mg/ml), which was designated as day 0. The worms were transferred to new plates every 2 d, and the worm survival was assessed on each transfer day. To prevent offspring generation, 0·5 mg/ml FUdR was added into the plates at days −1, 0, 2 and 4. a: ![]() , CT;
, CT; ![]() , BL 5·0 (mg/ml); b:
, BL 5·0 (mg/ml); b: ![]() , CT (mgDf50);
, CT (mgDf50); ![]() , BL 5·0 (mgDf50) (mg/ml); c:
, BL 5·0 (mgDf50) (mg/ml); c: ![]() , CT (ok434);
, CT (ok434); ![]() , BL 5·0 (ok434) (mg/ml); d:
, BL 5·0 (ok434) (mg/ml); d: ![]() , CT (tm4241);
, CT (tm4241); ![]() , BL 5·0 (tm4241) (mg/ml). ** P<0·01 by log-rank test, n 60 per group.
, BL 5·0 (tm4241) (mg/ml). ** P<0·01 by log-rank test, n 60 per group.
BL also decreased the fat accumulation in N2 worms in a dose-dependent manner (Fig. 6(a)), and increased mitochondrial membrane potential (Fig. 6(b)) and mitochondrial ROS level (Fig. 6(c)) in N2 worms when compared with those observed in the control worms.
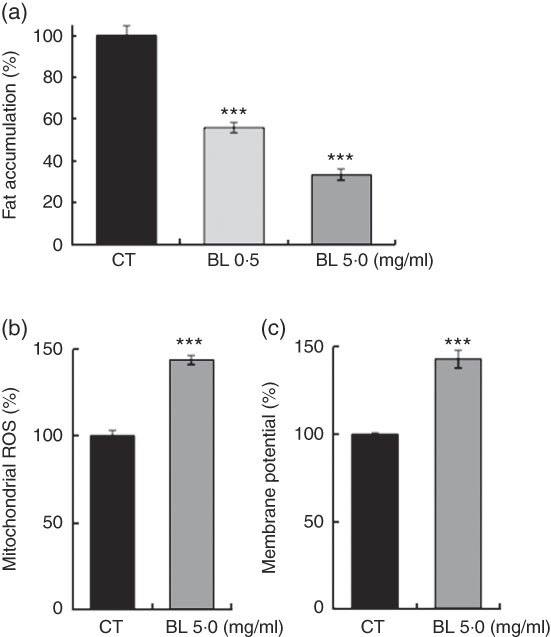
Fig. 6 Fat accumulation and mitochondria activation in worms fed Bifidobacterium longum (BL). (a) Synchronised wild-type N2 worms were cultured on plates with Escherichia coli (OP50) alone (OP plates; CT) or with killed BL (BL plates; 0·5 or 5·0 mg/ml) for 96 h. The worms were then fixed with 4 % PFA and stained with Nile red. (b, c) Synchronised worms were cultured on OP (CT) or BL plates (5·0 mg/ml) for 72 h, and 0·5 mg/ml MitoTracker Orange CMTMRos and 0·5 mg/ml MitoTracker Orange CM-H2TMRos were added into the plates at a volume of 400 µl. After 24 h, the worms were washed and fixed with 10 % ethanol. In both assays, the fluorescence was measured and analysed using a BZ8000 microscope and the ImageJ software, respectively. The fluorescence of the control worms was set as 100 %. Values are means (n>35 and n>55 worms for the two assays, respectively), with their standard errors represented by vertical bars. ROS, reactive oxygen species. *** P<0·005 by Tukey’s t test.
Bifidobacterium longum affected cellular localisation of DAF-16 and expression of its target genes
As shown by green fluorescence in TJ356 worms, BL induced nuclear localisation of DAF-16 (Fig. 7(b) and (d)) when compared with that observed in TJ356 control worms fed E. coli only (Fig. 7(a) and (c)). Further analyses showed that DAF-16 nuclear localisation was dependent on the dosage of BL (Fig. 7(e)).
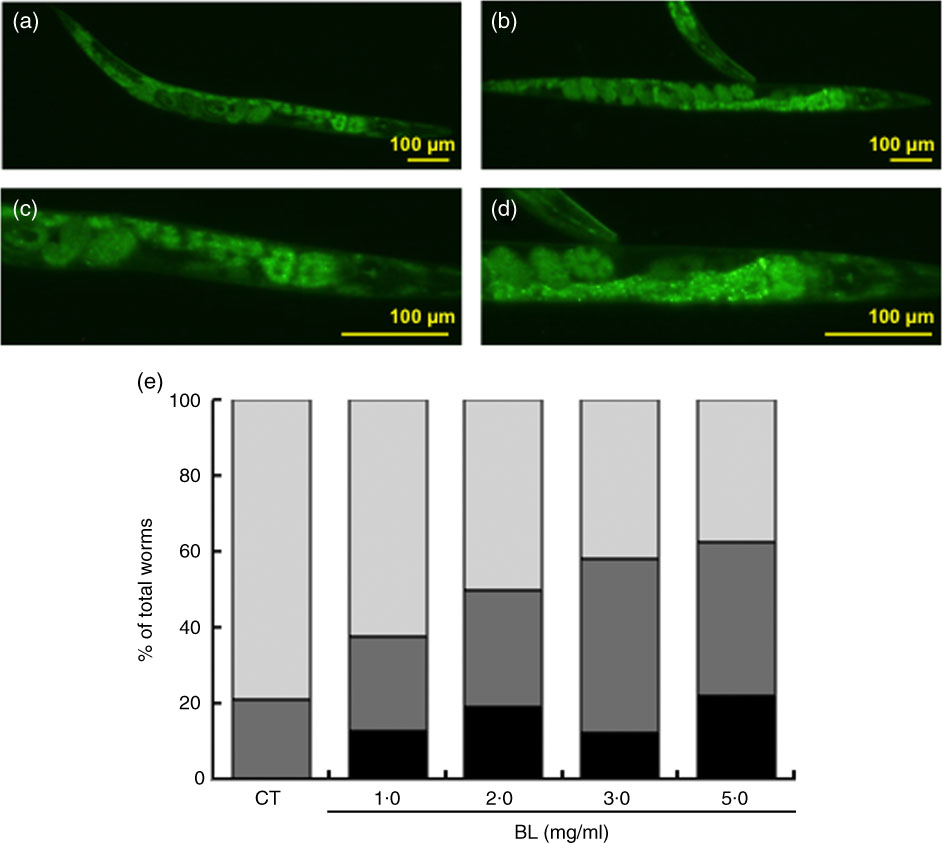
Fig. 7 Cellular localisation of DAF-16. The cellular localisation of DAF-16 was evaluated using TJ356 worms. Synchronised worms were cultured on plates with Escherichia coli (OP50) alone (OP plates; CT) or with killed Bifidobacterium longum (BL plates; 1·0, 2·0, 3·0 or 5·0 mg/ml) for 96 h and then fixed with 10 % ethanol. Images were captured using a BZ8000 fluorescent microscope and analysed with the ImageJ software. Representative images of (a) control worms (CT) and (b) those given 5·0 mg/ml BL are shown. (c, d) Higher-magnification images of panels a and b, respectively. The scale bars indicate 100 µm. (e) DAF-16 cellular localisation was classified into three types – nuclear, partial nuclear and cytoplasmic – and the results are graphed and presented. e: ![]() , Nuclear;
, Nuclear; ![]() , partial nuclear;
, partial nuclear; ![]() , cytoplasmic.
, cytoplasmic.
Furthermore, qRT-PCR results showed that BL increased the level of daf-16 mRNA and markedly increased the expression of one of its target genes – hsp-12.6 (Fig. 8). Although to a lesser extent, BL also significantly increased the relative mRNA level of hsp-16.2, hsp-70, skn-1, ctl-1, ctl-2 and sod-1.
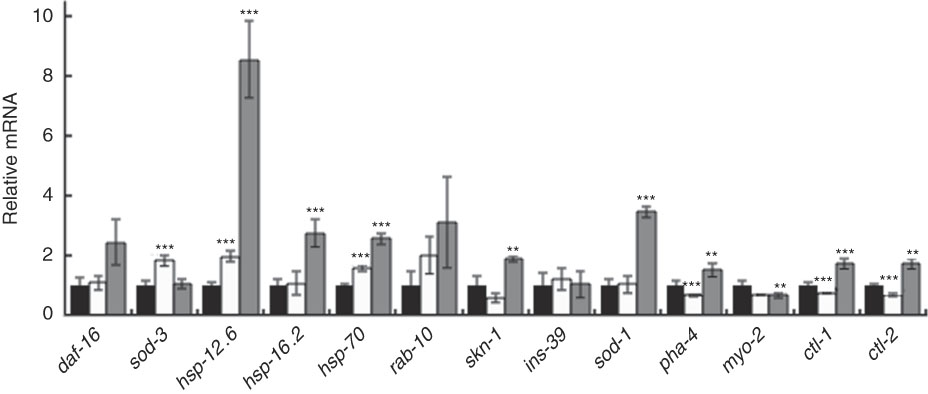
Fig. 8 Gene expression analysis of worms fed Bifidobacterium longum (BL). Synchronised worms were cultured on plates with Escherichia coli (OP50) alone (OP plates; CT) or with killed BL (BL plates; 0·5 or 5·0 mg/ml) for 96 h. qRT-PCR analysis was performed using the Thermal Cycler Dice Real Time System Lite and Thunderbird SYBR qPCR Mix, and actin was used as the reference gene in triplicate wells. Values are means with their standard errors represented by vertical bars. ![]() , CT;
, CT; ![]() , BL 0·5;
, BL 0·5; ![]() , BL 5·0 (mg/ml). ** P<0·01, *** P<0·005 by Tukey’s t test.
, BL 5·0 (mg/ml). ** P<0·01, *** P<0·005 by Tukey’s t test.
Discussion
The present study elucidated several physiological effects of killed BL in C. elegans, including enhanced stress tolerance, increased motility and prolonged life span. Feeding worms with BL affected the growth and development of the worms. As shown by the fluorescence of col-19::GFP (TP12) worms, those fed a high concentration of BL expressed a lower level of COL-19 protein, indicating higher larva ratio and delayed growth on these worms( Reference Prasanth, Santoshram and Bhaskar 31 , Reference Thein, McCormack and Winter 32 ) without affecting reproduction (online Supplementary Fig. S1). This may be associated with shorter body length observed in worms fed BL (Fig. 1(b)). It is widely thought that stress tolerance, longevity and development are highly related. A previous report showed that stress tolerance and longer life span are typically observed in the event of delayed growth( Reference Saul, Pietsch and Menzel 33 ).
In this study, BL appeared to enhance tolerance to heat stress (Fig. 3(a)) and H2O2-induced stress in C. elegans (Fig. 4(a) and (c)) and conserved the motility in aged worms (Fig. 3). Although the motility conservation was not consistently observed throughout the experimental period, BL appeared to improve the worm motility in a dose-dependent manner. Furthermore, BL significantly prolonged the life span of the worms (Fig. 5(a)).
Nevertheless, BL failed to increase the heat stress tolerance in mgDf50 worms (Fig. 3(c)) and did not prolong the life span of mgDf50 and ok434 worms (Fig. 5(b) and (c)). These results suggested that heat stress tolerance and longevity was mediated by DAF-16 and SIR-2.1, respectively. This notion was supported by the finding that BL increased hsp-12.6 expression (Fig. 7). Furthermore, BL induced the nuclear localisation of DAF-16 (Fig. 6(e)). These findings suggested that BL dose-dependently activated DAF-16. Previously, it was shown that DAF-16 nuclear translocation promotes longevity in C. elegans ( Reference Tissenbaum and Guarente 18 ). In addition, a previous study demonstrated that SIR-2.1 deacetylates and activates DAF-16( Reference Berdichevsky, Viswanathan and Horvitz 34 ). Therefore, results of these and the present studies suggested that BL activates DAF-16 via SIR-2.1 to induce longevity.
In this study, the mRNA level of sod-3, a target gene of daf-16, did not increase, but it seems to be owing to the following reasons. The nuclear translocation of SMK-1, together with DAF-16, induces transcription of sod-3 ( Reference Wolff, Ma and Burch 35 ), whereas co-localisation of DAF-16 with HSF-1 induces the gene expression of hsp-12.6 ( Reference Wolff, Ma and Burch 35 , Reference Hsu, Murphy and Kenyon 36 ). In this study, HSF-1 could be activated and translocated in the nucleus with DAF-16. This notion was supported by the result that BL up-regulated the expression of hsp-16.2 and hsp-70, the target genes of HSF-1. Therefore, the physiological effect of BL was due to DAF-16, but the contribution of these effects is thought to be hsp-12.6 instead of sod-3.
This study also demonstrated that BL decreased fat accumulation (Fig. 6(a)) and increased mitochondrial membrane potential and ROS level (Fig. 6(b) and (c)) in worms. It is hypothesised that BL activated the mitochondria and oxidised fat in the process in C. elegans ( Reference Zarse, Bossecker and Muller-Kuhrt 37 ). Typically, longer-living worms have lower mitochondrial ROS levels; however, a mild increase in ROS level was reported to induce mitohormesis and prolong life span( Reference Zarse, Bossecker and Muller-Kuhrt 37 , Reference Zarse, Schmeisser and Groth 38 ).
Here, BL increased the recovery rate from heat stress (Fig. 3(d)) and H2O2 stress tolerance (Fig. 4(c)) in tm4241 and wild-type N2 worms, suggesting that BL-induced heat and H2O2 stress tolerance was independent of SKN-1. However, BL failed to conserve the movement (Fig. 2(b)) and prolong life span (Fig. 5(d)) of tm4241 worms. These results suggested that the longevity effect of BL was only partially mediated by SKN-1. Other studies have reported that other probiotics, Bifidobacterium infantis and Lactobacillus gasseri SBT2055, prolong the life span of worms via SKN-1, but is independent of DAF-16( Reference Komura, Ikeda and Yasui 39 , Reference Nakagawa, Shiozaki and Kobatake 40 ). Surprisingly, results of this study showed that the anti-ageing effect of killed BL (BR-108) was partially mediated by SKN-1 and mainly via DAF-16. Although BL supplementation induced resistance to H2O2 stress in this study (Fig. 4(a) and (c)), the mechanism was unclear. Gene expression analysis showed increased ctl-1 and ctl-2 expression in BL-fed worms (Fig. 8). Catalases in worms may be activated to degrade H2O2; however, further studies are needed to elucidate the signalling pathway involved.
This study may be used as a model study to determine the effect of probiotics on ageing. Further studies evaluating the physiological effects of probiotics in higher animals are needed to better understand the benefit of killed probiotics.
Acknowledgements
This work was supported in part by Grants-in-Aid for Scientific Research and Education from the University of Tsukuba. The Bifidobacterium longum (BR-108) was supplied by Combi Corporation.
T. S. and K. S. conceived and designed the study, analysed data, wrote the paper and made manuscript revisions. T. S. performed all experiments. K. S. supervised the study as the principal investigator. All authors read and approved the final manuscript.
The authors declare that there are no conflicts of interest.
Supplementary material
For supplementary material/s referred to in this article, please visit https://doi.org/10.1017/S0007114518001563


