


Homocysteine (Hcy) is a sulphur amino acid by-product of methionine metabolism(Reference Perna and Ingrosso1). The levels of Hcy are affected by genetic alterations of methionine metabolism enzymes and the concentrations of vitamin B12, vitamin B6 and folic acid(Reference Cianciolo, De Pascalis and Di Lullo2). Mendelian randomisation studies have reported that Hcy is a causal factor for many diseases, such as Alzheimer’s disease(Reference Hu, Teng and Li3), stroke(Reference Casas, Bautista and Smeeth4,Reference Larsson, Traylor and Markus5) and schizophrenia(Reference Numata, Kinoshita and Tajima6,Reference Nishi, Numata and Tajima7) . Randomised clinical trials also reported the benefit of Hcy-lowering therapy on improving cognitive function in mild cognitive impairment(Reference Ma, Li and Zhou8), reducing the risk of stroke(Reference Martí-Carvajal, Solà and Lathyris9,Reference Li, Huang and Zheng10) , delaying the progression of chronic kidney disease among patients with mild-to-moderate chronic kidney disease(Reference Xu, Qin and Li11,Reference Li, Spence and Wang12) and ameliorating psychiatric symptoms in schizophrenia(Reference Sakuma, Matsunaga and Nomura13,Reference Firth, Stubbs and Sarris14) . Hence, the metabolism of Hcy would be of importance to prevent and treat many diseases.
Kidney function plays an important role in Hcy metabolism(Reference Lewerin, Ljungman and Nilsson-Ehle15,Reference Veldman, Vervoort and Blom16) . Observational studies found that plasma Hcy concentration was elevated in moderate renal insufficiency(Reference Samuelsson, Lee and Attman17). Renal transplant recipients had significantly decreased plasma Hcy levels after renal transplant compared with that before renal transplant(Reference Arnadottir, Hultberg and Wahlberg18). Kidney donors with a significantly decreased estimated glomerular filtration rate (eGFR) had greater Hcy levels than controls(Reference Kasiske, Anderson-Haag and Ibrahim19,Reference Kasiske, Anderson-Haag and Israni20) . Although previous studies have suggested the important role of kidney function in Hcy metabolism, overwhelming studies have paid attention to the link between plasma Hcy levels and kidney function using cross-sectional(Reference Cohen, Margalit and Shochat21–Reference Shankar, Wang and Chua23) and longitudinal settings(Reference Xie, Yuan and Guo24–Reference Kong, Ma and Zhang26); there is still a lack of studies investigating the relationship between kidney function and trajectories of plasma Hcy levels over time.
Trajectory analysis is more sensitive when exploring the course change in outcomes over time and reliably estimating the slope, illustrating the natural history of exposure-induced outcomes. Therefore, we aimed to explore the association of kidney function at baseline with the trajectories of Hcy levels using repeated measurements in a longitudinal cohort among older adults.
Methods
Study population
The Rugao Longevity and Ageing Study is an observational, prospective and community-based cohort study(Reference Liu, Wang and Zhang27). Its first survey was conducted in November 2014 (wave 1). Then, the second survey was conducted in April 2016 (wave 2). The third and fourth surveys were conducted in November 2017 (wave 3) and December 2019 (wave 4), respectively. Because plasma Hcy was not measured in wave 1, we included subjects in waves 2, 3 and 4 in this study. A total of 1824 older adults were recruited in wave 2. During the 3·5-year follow-up (from wave 2 to wave 4), 689 subjects were excluded because of a lack of plasma Hcy or creatinine data. Finally, a total of 1135 subjects with complete information in both waves were included. Additionally, wave 2 was regarded as the baseline survey in our analyses. This study was approved by the Human Ethics Committee of the School of Life Sciences of Fudan University. Informed consent was obtained from each participant.
Measurements and outcomes
Plasma Hcy and creatinine levels were measured in both waves. A chemiluminescence immunoassay was used to measure plasma Hcy levels in the biochemistry laboratory of Rugao People’s Hospital. Serum creatinine concentration was measured based on the enzymatic method with the Cica Creatinine reagent (KANTO Chemical) and a Hitachi 7600 analyser (Hitachi). The eGFR was calculated using equations conducted by the Chronic Kidney Disease Epidemiology Collaboration for creatinine(Reference Levey, Stevens and Schmid28). eGFR = 144 × (creatinine (mg/dl)/0·7)−0·329 × (0·993)Age, if female and creatinine ≤ 0·7; eGFR = 144 × (creatinine (mg/dl)/0·7)−1·209 × (0·993)Age, if female and creatinine > 0·7; eGFR = 141 × (creatinine (mg/dl)/0·9)−0·411 × (0·993)Age, if male and creatinine ≤ 0·9; or eGFR = 141 × (creatinine (mg/dl)/0·9)−1·209 × (0·993)Age, if male and creatinine > 0·9.
Subjects were categorised according to plasma Hcy level and eGFR. For plasma Hcy, subjects were defined as the elevated Hcy group when their Hcy was greater than 15 μmol/l; conversely, subjects were defined as the normal Hcy group when their Hcy was less than or equal to 15 μmol/l(Reference Levi, Cohen and Levi29). For kidney function, subjects were categorised into four groups according to quartiles of eGFR.
Covariates
Demographic, clinical characteristics and lifestyles were collected from the Rugao Longevity and Ageing Study. Demographic data included age, sex, marital status and educational years. Clinical characteristics included CVD, diabetes mellitus, hypertension, chronic lung disease, cognitive function decline (assessed by the revised Hasegawa’s dementia scale and subjects with cognitive scores less than 21·5 were defined as cognitive decline(Reference Imai30)), antihypertension drugs, antidiabetic drugs and vitamin B12 concentration (in wave 2). CVD included cerebral infarction, stroke, cerebral haemorrhage, CHD, myocardial infarction and heart failure. Chronic lung disease included pulmonary tuberculosis, chronic bronchitis, asthma or chronic obstructive pulmonary disease. Participants who self-reported a diagnosis of diabetes mellitus, used medication for diabetes mellitus or had a fasting glucose greater than 125 mg/dl were coded as having diabetes mellitus. Lifestyles included smoking, alcohol consumption, sleep quality (assessed by the Pittsburgh Sleep Quality Index(Reference Buysse, Reynolds and Monk31)) and BMI. Vitamin B12 was categorised into three groups according to tertiles (lowest third: ≤460 pmol/l; middle third: >460, ≤676 pmol/l; and highest third: > 676 pmol/l).
Statistical analysis
In this study, we described the characteristics of the study population at baseline stratified by quartiles of kidney function. Continuous and categorical variables are presented as the mean with standard deviation and frequency (%), respectively. Then, for longitudinal analyses to assess the effect of eGFR at baseline on subsequent levels of plasma Hcy during follow-ups, we used linear mixed-effect models to analyse the association of eGFR at baseline with subsequent plasma Hcy levels over time. A P-value (two-tailed) less than 0·05 was considered statistically significant. All analyses were conducted in the following three models: model 1: unadjusted; model 2: adjusted for age, sex, smoking, alcohol consumption, education, marital status, CVD, diabetes, hypertension, chronic lung disease, cognitive function and sleep quality; and model 3: adjusted for model 2 + vitamin B12 and BMI. Additionally, we also explored the effect of plasma Hcy levels at baseline (normal v. elevated) on subsequent levels of eGFR using linear mixed-effect models. Furthermore, we conducted sensitivity analyses in participants without CVD or diabetes in three models to validate our findings. All analyses were conducted by SPSS 22.0 and R (Version 3.6.1: www.r-project.org/).
Results
Characteristics of study population
The included sample characteristics across the three waves are presented in Table 1. In this study, a total of 1135 subjects were included. The mean age was 76·52 (sd 3·87) years. The mean plasma Hcy level was 14·09 (sd 6·82) μmol/l at baseline and then increased to 16·28 (sd 8·27) and 17·36 (sd 10·39) μmol/l at the 1·5- and 3·5-year follow-ups, respectively (P < 0·001). The number of subjects with elevated plasma Hcy levels was 314 (sd 27·67 %) at baseline and then increased to 519 (sd 45·73 %) and 575 (sd 50·66 %) at the 1·5- and 3·5-year follow-ups, respectively. The mean eGFR was 90·84 (sd 11·42) ml/min per 1·73 m2 at wave 2 and then increased to 85·13 (sd 11·64) and 77·16 (sd 13·17) ml/min per 1·73 m2 at subsequent follow-ups (P < 0·001). The detailed characteristics of the study population stratified by eGFR at baseline are presented in Table 2.
Table 1. Sample characteristics across three waves (n 1135)
(Numbers and percentages)
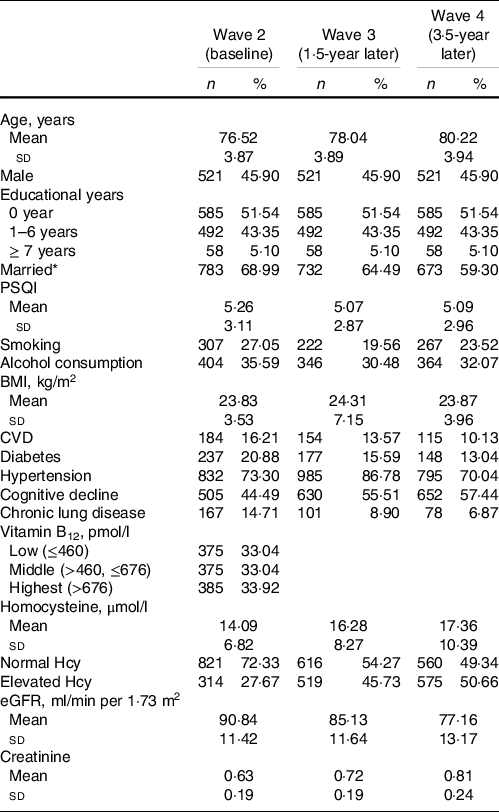
eGFR, estimated glomerular filtration rate; PSQI, Pittsburgh Sleep Quality Index.
* Married and living together.
Table 2. Characteristics of study population stratified by quartiles of eGFR at baseline
(Numbers and percentages)
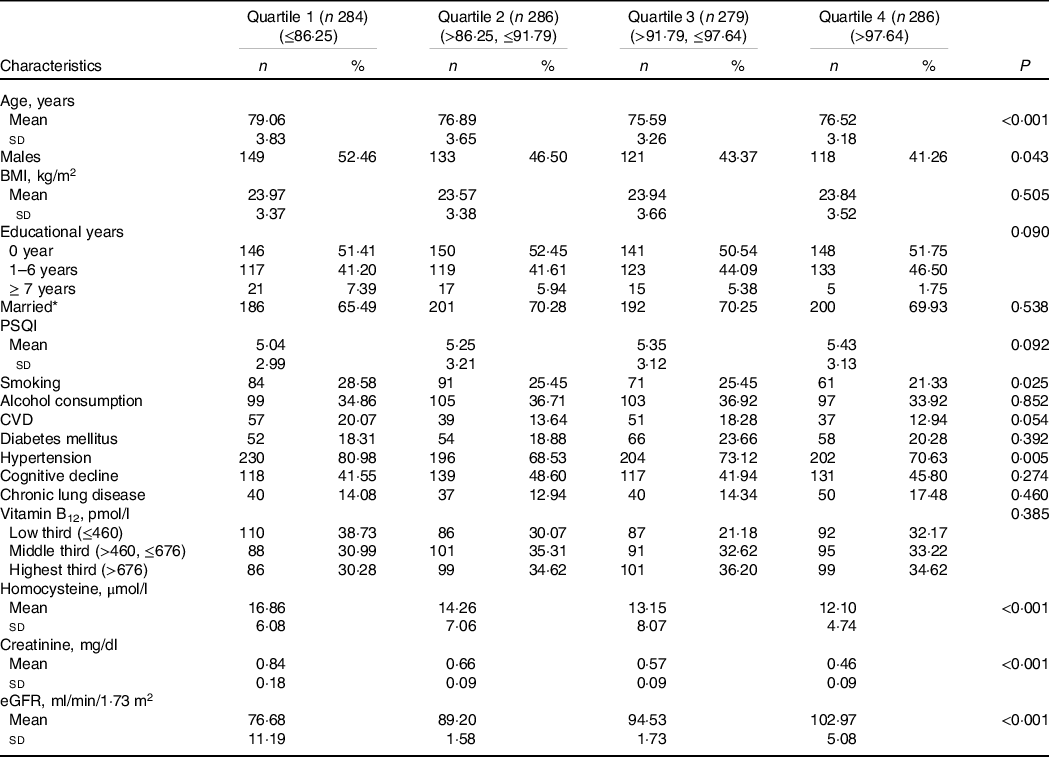
eGFR, estimated glomerular filtration rate; PSQI, Pittsburgh Sleep Quality Index.
* Married: Married and living together.
Associations of estimated glomerular filtration rate at baseline with plasma homocysteine levels during follow-ups
Associations between eGFR at baseline and subsequent plasma Hcy levels during follow-ups are shown in Table 3. In crude models, the interaction between time and eGFR at baseline was significant (β = −0·02, 95 % CI − 0·02, −0·01, P = 0·002). After considering covariates, the interaction remained (β = −0·02, 95 % CI − 0·02, −0·01, P = 0·003), suggesting that increased kidney function is associated with a more pronounced decrease in plasma Hcy levels during follow-ups.
Table 3. Associations of kidney function at baseline with subsequent plasma Hcy in all participants
(β-coefficients and 95 % confidence intervals)

eGFR, estimated glomerular filtration rate; Hcy, homocysteine. Model 1: unadjusted; model 2: adjusted for age, sex, smoking, alcohol consumption, education, marital status, CVD, diabetes, hypertension, chronic lung disease, cognitive function and sleep quality; model 3: adjusted for model 2 + Vitamin B12 and BMI.
* Compared with kidney function Q4 (>97·64 ml/min/1·73 m2).
Additionally, we analysed the impact of different quartiles of eGFR at baseline on subsequent plasma Hcy levels (Table 3). The interaction term between time and quartile 1 of eGFR at baseline was significant in both crude and adjusted models (for crude models: β = 0·49, 95 % CI 0·17, 0·81, P = 0·003; for adjusted models: β = 0·49, 95 % CI 0·16, 0·81, P = 0·003, respectively). These results indicated a significant difference in the slope for plasma Hcy levels over time between quartiles 1 and 4. The plasma Hcy levels increased approximately 0·49 points faster per year for subjects in quartile 1 than in quartile 4. The graphic analyses revealed that subjects in quartile 1 had a faster increased trajectory in plasma Hcy levels compared with those in quartile 4 (Fig. 1).
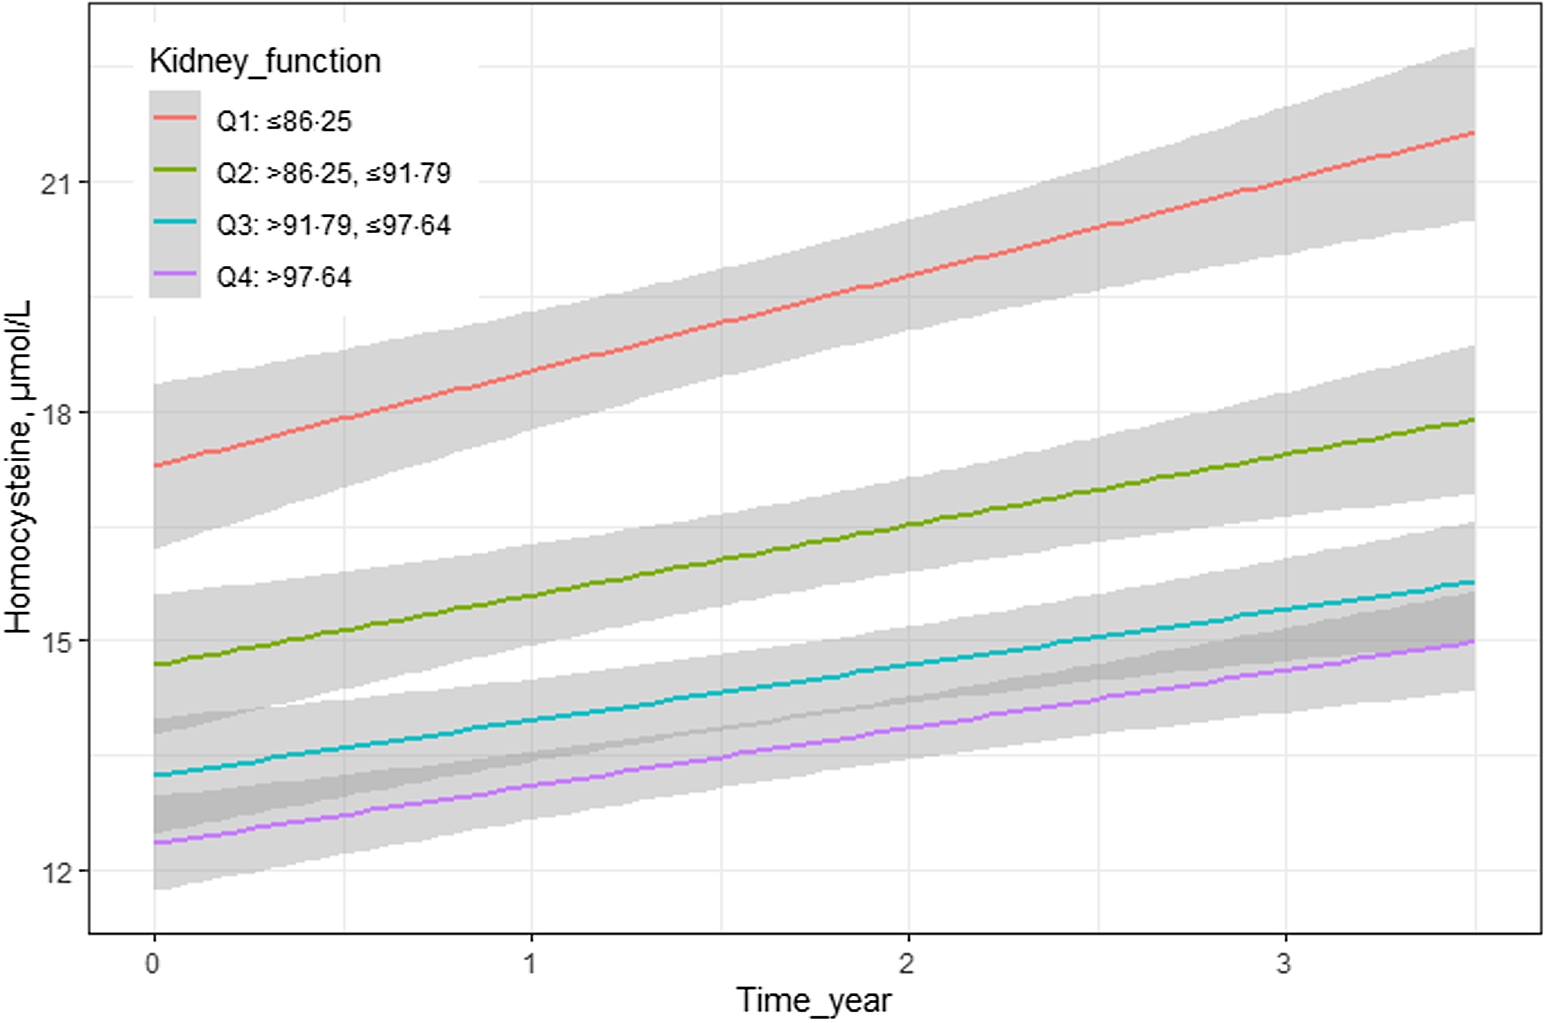
Figure 1 Longitudinal association of eGFR with subsequent plasma homocysteine during follow-ups.
Similarly, the interaction between time and eGFR at baseline was significant (β = −0·01, 95 % CI − 0·02, −0·00, P = 0·043) in both the crude and adjusted models after excluding participants without CVD or diabetes (online Supplementary Table S1 and Fig. S1).
Discussion
Principal findings
To our knowledge, this is the first study to explore the association of kidney function with longitudinal changes in Hcy levels over time using repeated measurements during a 3·5-year follow-up and illustrated that kidney function decline was associated with a more pronounced increase in plasma Hcy levels. Additionally, we adjusted for many clinical and lifestyle factors (especially age, hypertension, vitamin B12 level and cognitive function), which provided robust evidence that kidney function played an important role in Hcy metabolism.
Compared with previous studies
Few studies have investigated the trajectories of plasma Hcy levels at different levels of kidney function, describing both changes between the two surveys and the slope of change over time using repeated measurements. The National Health and Nutrition Examination Survey indicated a close association of renal insufficiency with an increased risk of elevated circulating Hcy in the general population using cross-sectional settings(Reference Francis, Eggers and Hostetter32). Consistently, plasma Hcy levels were significantly higher in subjects who had decreased kidney function in our study (Table 2). However, the findings in National Health and Nutrition Examination Survey were based on cross-sectional settings, which just demonstrated a link relationship between eGFR and Hcy levels. Our analyses were conducted using repeated measurements during the 3·5-year follow-up and observed a steeper increase in plasma Hcy concentrations in subjects with kidney function decline. Trajectory analysis is more sensitive for exploring the course change in outcome over time and reliably estimating the slope, illustrating the natural history of kidney function decline-induced Hcy levels. Therefore, our study provided more robust evidence to illustrate the significant association of kidney function with Hcy levels.
Coincidentally, renal transplant recipients had significantly decreased Hcy levels after renal transplant compared with before renal transplant(Reference Arnadottir, Hultberg and Wahlberg18). It was likely that the increased Hcy levels in renal transplant recipients would be partially cleared after renal transplant with healthy kidneys, which was consistent with our findings that better kidney function has better efficiency for cleaning Hcy. In addition, kidney donors had acutely and persistently increased Hcy levels after renal transplantation at subsequent 6- and 36-month follow-ups(Reference Kasiske, Anderson-Haag and Ibrahim19,Reference Kasiske, Anderson-Haag and Israni20,Reference Tsai, Aras and Sozen33) . It was conceivable that plasma Hcy levels may be increased considerably due to the cleaning efficiency of the kidney, because Hcy levels fell significantly after uninephrectomy. Unintendedly, the potential rejection of kidney allografts may affect efficient cleaning of Hcy. Since these studies were conducted in patients with severe renal disease or renal transplant, the generalisation of findings was limited to older populations. In our studies, we explored the association of kidney function with Hcy metabolism in a prospective and community-based cohort without severe renal disease or renal transplant, avoiding the potential effect of allograft rejection on Hcy levels. Hence, our studies would provide more generalised evidence than those studies conducted in patients with renal disease.
Possible mechanisms
The underlying cause of elevated Hcy levels in renal disease is not entirely understood, but it seems plausible that a reduction in renal Hcy clearance and metabolism was the cause(Reference Garibotto, Sofia and Valli34). Previous studies have reported that animal and human kidneys contain the necessary Hcy-metabolising enzymes, including trans-sulphuration and remethylation enzymes(Reference Garibotto, Sofia and Valli34). The normal kidney may compensate glomerular filtration by up- or down-regulating these pathways, thereby keeping Hcy levels constant(Reference Wollesen, Brattström and Refsum35). However, the loss of metabolically active kidney tissue normally involved in Hcy handling would decrease Hcy clearance and increase plasma levels(Reference Garibotto, Sofia and Valli34,Reference Wollesen, Brattström and Refsum35) .
Strengths and limitations
Strengths were presented in our studies. Our study was conducted based on a community-based population in a prospective longitudinal cohort. It might be valuable to generalise the findings to the older population. The repeated measurement of plasma Hcy and creatinine levels was simultaneously measured from each subject at the same facility, which could ensure stability and reliability. The limitation of our study was the relatively small sample size, so it is necessary to recruit more individuals to verify our results in the future. In addition, the follow-up period was relatively short, which may limit the accuracy of the trajectories of plasma Hcy levels. Therefore, it is essential to conduct longer-term follow-ups with more points at different times to achieve more robust conclusions.
Conclusion
In summary, according to community-based and longitudinal settings, our study demonstrated that kidney function plays an important role in Hcy metabolism. Kidney function decline is associated with a more pronounced increase in plasma Hcy levels among older adults. Kidney function should be primarily and carefully considered when conducting Hcy-lowering therapy and regimens. Additionally, the study recommended that it was important and feasible to trigger Hcy-lowering interventions by improving kidney function. Further studies with longer follow-up periods and larger sample sizes are needed to validate our findings.
Acknowledgements
The authors acknowledge all participants involved in the present study from the Rugao Longevity and Ageing Study. We acknowledge the support from the government of Rugao, the Public Health Bureau of Jiang’an Township and Rugao city, the Bureau of Civil Affairs, the Rugao People’s Hospital and all the local village physicians.
This work was supported by grants from the National Key R&D Program of China (2018YFC2000400/2018YFC2000400-3), the National Natural Science Foundation of China (81571372) and the Postdoctoral Science Foundation of China (2018 M640333).
Z. H., L. Y. and W. X. designed the research; Z. H., L. Y., J. X. and W. J. conducted the research; Z. H., L. Y. and H. M. analysed the data and performed the statistical analyses. Z. H., L. Y. and W. X. wrote the paper; Z. H. and W. X. had primary responsibility for the final content; and all authors read and approved the final manuscript.
Dr. Xiaofeng Wang reports grants from the National Key R&D Program of China (2018YFC2000400) and the National Natural Science Foundation of China (81571372). Dr. Yi Li reports grants from the Postdoctoral Science Foundation of China (2018 M640333). The authors declare that they have no relevant financial interests.
Supplementary material
For supplementary materials referred to in this article, please visit https://doi.org/10.1017/S0007114521001690


