


The interactions between different nutrients in the bioavailability of Fe and other minerals have been studied in recent decades. Prebiotics are included in the concept of fermentable dietary fibre, which according to physical–chemical characteristics, stand out among the nutrients that can interact with minerals in the intestine(Reference Van Loo, Cummings and Delzenne1). Inulin, extracted from chicory, and oligofructose are the prebiotics(Reference Kolida, Tuohy and Gibson2) that are studied most and offer new nutritional perspectives(Reference Marteau and Boutron-Ruault3). In terms of mineral metabolism, studies in animals and human subjects have shown the benefits of these prebiotics in the absorption of Ca and Mg minerals(Reference Coudray, Tressol and Gueux4–Reference van den Heuvel, Muys and Dokkum6), but there is little information concerning the effect on the absorption of Fe(Reference Ohta, Sakai and Takasaki7, Reference van den Heuvel, Schaafsma and Muys8).
In this context, studies that show a synergistic effect for the absorption of Ca and Mg must also be considered when fibres with different chain sizes are offered together(Reference Coudray, Tressol and Gueux4, Reference Younes, Coudray and Bellanger9). Some authors report that the enhancement of Ca absorption with products made from both types of dietary fibre, such as synergy1 (which is made up of 50 % high-performance (HP) inulin and 50 % oligofructose), could result from fermentation that extends along the entire large intestine(Reference Coudray, Tressol and Gueux4). To our knowledge, the effect of synergy1 on the absorption of Fe has not yet been compared to other types of fibres. Current studies show beneficial results on the absorption of Fe associated with more fermentable dietary fibre(Reference Lopez, Coudray and Levrat-Verny10, Reference Freitas, Amancio and Novo11).
There is also clinical relevance in evaluating the effect of functional fibres in Fe absorption concerning the introduction of fibre-rich complementary food in infant nutrition aiming to prevent the beginning of chronic constipation(Reference Medeiros, Morais and Tahan12, Reference Morais, Vítolo and Aguirre13). On the other hand, early introduction of foods rich in dietary fibre may have negative effects on growth and on the bioavailability of minerals, including Fe. In this stage of life, between 6 months and 24 months, Fe deficiency anaemia occurs at a high prevalence(Reference Davidsson, Galan and Cherouvrier14, Reference Aggett, Agostoni and Axelsson15) and may cause several negative repercussions in infant health(Reference Aggett, Agostoni and Axelsson15, Reference Lozoff, Jimenez and Hagen16). Optimising the bioavailability of Fe present in food(Reference Pitarresi, Tripodo and Cavallaro17, Reference Yasuda, Roneker and Miller18) is one of the ways to prevent Fe deficiencies. There is still no recommendation regarding the consumption of fibre in the first year of life, probably because of concerns that fibre may have negative effects on growth and on the bioavailability of minerals. Thus, the American Academy of Pediatrics, the American Health Foundation and the Institute of Medicine, which are responsible for the development of Dietary Reference Intake, exclude the first year of life in their recommendations(Reference Williams19, Reference Trumbo, Schlicker and Yates20). The lack of guidelines regarding fibre in this age group shows the necessity for evaluating whether the consumption of prebiotics interferes with the bioavailability of Fe.
Therefore, the present experimental study evaluates the effect of HP inulin, oligofructose and synergy1 prebiotics on the intestinal absorption of Fe, food intake, body growth, colon and caecum weight, caecal pH and weight of the faeces of rats with Fe deficiency anaemia compared to anaemic rats fed with rations without dietary fibre.
Experimental methods
Animals and diets
A total of forty-eight male Wistar rats, aged 21 d at the start of the experiment, were used in the present study. Throughout the study period, they received rations and deionised water through the MilliQ Plus system (Millipore Corporation) ad libitum. All rats were kept in individual metabolic cages made of acrylic and stainless steel (Nalgene-Metabolic Cages 650-0100) on a cycle of 12 h of light and at a temperature of 23 ± 1°C. The use of cages preventing coprophagia and contamination with Fe also allowed the apparent absorption to be evaluated.
Animals were fed with rations recommended by the American Institute of Nutrition (AIN93-G)(Reference Reeves, Nielsen and Fahey21), containing the nutrients needed for proper growth of rats. To induce Fe deficiency anaemia, Fe was not added to the rations during the first 2 weeks of the study. In the 5th week of life (36 d old), the rats were divided into four groups according to weight, body length and the rate of Hb and haematocrit, with the aim of forming similar groups based on these parameters. Thus, four groups were comprised of twelve animals that started to receive one of the following rations, with the respective added prebiotic (Orafti, Active Food Ingredients®): (1) HP inulin group – regular rations with 103·1 g of HP inulin (100 g of dietary fibre); (2) synergy1 group – regular rations with 112·36 g of synergy1 (100 g of dietary fibre); (3) oligofructose group – regular rations with 108·7 g of oligofructose (100 g of dietary fibre); (4) control group – regular rations without dietary fibre, which was replaced by 100 g of maize starch, as suggested in the literature(Reference Borel, Smith and Brigham22). The amount of HP inulin, synergy1 and oligofructose was subtracted from the total amount of maize starch in the ration.
Initially, a portion of the rations that was equivalent to the sum of the quantity to be ingested by the four groups during the experimental period was prepared. It was made up of the ingredients common to all groups of the study, in its smaller quantity, and to this volume elemental Fe (25 mg/kg of the ration) in the form of hydrated ferric citrate (Merck®) was added. This procedure aimed to avoid oscillations in the content of Fe offered to each of the four groups in the study. The content of Fe was determined in the rations, with or without added Fe, measured in three samples through an atomic absorption spectrometer, model Perkin–Elmer – 5100 PC(Reference Marks, Moore and Kanabrocki23). According to the laboratory dosage, the average quantities of elemental Fe in the ration, with or without added Fe, were: 36·0 and 10·0 mg/kg per ration, respectively. The total volume of the ration was divided into four equal parts and the necessary adjustments of the ingredients were made to form the four groups of the study. The composition of each diet is described in Table 1.
Table 1 AIN93-G ration composition, indicated for rats in the growth phase, changed by the replacement of 50 g of cellulose and 50 g of starch for 100 g of high-performance (HP) inulin, synergy1, oligofructose and maize starch (control diet) and a reduction of the iron content that was added (25 mg/kg ration)

* Composition of macronutrients in 100 g of the product inulin HP: carbohydrates, 0 g; protein, 0 g; total fat, 0 g; dietary fibre, 97 g.
† Synergy1: carbohydrates, 8 g; protein, 0 g; total fat, 0 g; dietary fibre, 89 g.
‡ Oligofructose: carbohydrates, 5 g; protein, 0 g; total fat, 0 g; dietary fibre, 92 g.
§ (Roche®): Composition in mg: nicotinic acid, 30; pantothenate, 15; pyridoxine, 6; thiamine, 5; riboflavin, 6; folic acid, 2; composition in μg: vitamin K, 750; d-biotin, 200; vitamin B12, 25; composition in IU: vitamin A, 4000; vitamin D3, 1000; vitamin E, 75.
∥ (Roche®): Composition in mg – essential minerals – Ca, 5000; P, 1561; K, 3600; S, 300; Na, 1019; Cl, 1571; Mg, 507; Zn, 30; Mn, 10; Cu, 6; I, 0·2; Mo, 0·15; Se, 0·15 – potentially beneficial minerals – Si, 5; Cr, 1; F, 1; Ni, 0·5; B, 0·5; Li, 0·1; V 0·1-without Fe.
Each week, after beginning the supply of the experimental diets, the weight and the length of each animal were measured. A calculation of the feed efficiency coefficient was conducted on each diet week through the following formula: weight gain (g)/ration consumption (g) in the same period.
Measurement of anaemia-related biochemical variables
The animal was anaesthetised by inhalation of isoflurane and a sample of blood was taken from the tail for determination of Hb and haematocrit. During this period, food intake was measured daily.
Then, 10 d after the start of the supply of experimental rations, 0·1 g of carmine-pink colorant was added to the ration of each animal and, during three consecutive days, faeces were collected the moment a change in colour (to a reddish colour) was observed. After 72 h of the addition of rose-carmine into the rations, Evans blue colorant (Inlab, soluble in water) was added to the ration. The collection was interrupted at the point when excretion of blue-coloured faeces began.
The faeces collected during this 3 d period were properly identified and stored in a freezer ( − 20°C). After the 3rd day of collection, the humid weight of the faeces was obtained on an electronic analytical balance (Metler Toledo – model AB204) with a sensitivity of 0·0001 g. Then, the faeces were dried in an oven at 105°C and, after 22 h, the faeces were weighed at 30 min intervals, until a constant weight was obtained. The humidity of the faeces was calculated using the formula: (fresh faecal weight − dry faecal weight/fresh faecal weight) × 100.
Following this, 500 mg of dried faeces from each animal were weighed and divided into two samples of 250 mg (duplicates) that were submitted to net digestion (using NO and perchloric acid). The Fe analysis was performed in an atomic absorption spectrometer. The amount of Fe intake in the same period of time was also calculated. The percentage of Fe absorbed was calculated using the following formula: (ingested Fe quantity − excreted Fe quantity/ingested Fe quantity) × 100.
On the 21st day of the experimental diets, the animals were killed by inhalation of isoflurane. Median incisions in the abdominal wall and in the peritoneum were made and the caecum was isolated by cutting between the ileocaecal valve and the beginning of the proximal colon. After removing the caecum, the colon was separated into two portions(Reference Jacobs and White24), with the first considered to be the proximal colon (located between the caecum and the median portion of the larger colonic curvature) and the second as the distal colon (located between the median portion of the larger colonic curvature and the peritoneal reflection of the rectum)(Reference Dirks and Freeman25). All of the intestinal portions were weighed fresh on filter paper on an electronic analytical balance (Metler Toledo – model AB204), with a sensitivity of 0·0001 g, after excision of the mesentery, and were washed with physiological serum for removal of the contents in the lumen. At this point, the pH of the caecal contents was also evaluated. The animals were killed between 06.00 and 10.00 hours, the period in which the intestinal fermentation is more active(Reference Younes, Coudray and Bellanger9, Reference Lopez, Levrat-Verny and Coudray26). The caecal content was placed in a beaker immediately after extraction of the organ and the pH was measured using a pH-meter (Micronal – pH-meter B374). Finally, the liver was excised. The liver was weighed fresh, submitted to drying in an oven for 22 h at 120°C and was weighed three more times consecutively until the constant dry weight was obtained.
Hb levels were determined by the method of cyanomethahaemoglobin and microhaematocrit by the Wintrobe method(Reference Wintrobe, Mollin and Herbert27). The determination of hepatic Fe was also performed after liquid digestion of the dry tissue through atomic absorption spectrophotometry, similar to the method mentioned earlier for faeces.
Statistical analysis
The results are expressed as mean values and standard deviations when the numerical variables had a normal distribution. An ANOVA was used for comparisons between groups. When the analysis showed a statistically significant difference, it was complemented with Tukey's test, which was calculated with the use of the Jandel Sigma-Stat program (Systat Software Inc.). Statistical significance was defined as P < 0·05.
The Kruskal–Wallis test was used for the numerical variables that did not have a normal distribution. When there was a statistically significant difference, the analysis was complemented with the Dunn test.
Ethical considerations
The study protocol was approved by the Research Ethics Committee of the Federal University of Sao Paulo and was conducted in compliance with the International Guiding Principles for Biomedical Research Involving Animals (Council for International Organizations of Medical Sciences) – Geneva, 1985.
Results
Growth and food intake
At the beginning of the dietary treatment, the weights of the rats in the HP inulin, synergy1, oligofructose and control groups were, respectively: 117·23 (sd 9·18), 114·66 (sd 9·08), 115·93 (sd 12·39) and 115·98 (sd 10·61) g (P = 0·946). The trend for body length (body+tail) was similar: 29·13 (sd 0·96), 29·04 (sd 1·23), 28·73 (sd 0·96) and 29·00 (sd 0·95) cm (P = 0·816). The Hb values obtained from the HP inulin, synergy1, oligofructose and control groups were, respectively: 56·5 (55·3–58·2), 57·1 (54·5–60·0), 58·0 (52·6–59·0) and 56·1 (53·6–59·3) g/l (P = 0·925). The haematocrit values, in the same order, were: 17·50 (16·75–18·00), 17·00 (16·50–19·00), 18·00 (17·00–19·00) and 18·00 (17·00–18·50) % (P = 0·857). Considering weight, length, Hb and haematocrit, the four groups were similar before the experimental diets were started.
After the experimental rations were offered, one animal in the oligofructose group had a low food intake, low weight gain, diarrhoea, and a behaviour quite different from the other animals. As the days passed, these symptoms continued, and the animal was removed from the study. Kept on standard rations, these symptoms continued, and the animal was killed.
Table 2 shows the weekly intake for each group, the total intake over a period of 21 d, the weekly weight and body length, and the feed efficiency coefficient generated in each period. There was no statistically significant difference between the groups in any of the weeks evaluated.
Table 2 Weekly and total intake of rations, weekly body weight and weekly and total feed efficiency coefficients (CEA) in animals of the high-performance (HP) inulin, synergy1, oligofructose and control groups
(Mean values and standard deviations)

The total volume of deionised water intake during the period of 21 d of dietary treatment for the HP inulin, synergy1, oligofructose and control groups was, respectively: 677·33 (sd 22·19), 645·00 (sd 16·09), 672·33 (sd 17·47) and 489·67 (sd 5·51) ml (P < 0·001), with a statistically significant difference between the HP inulin and control groups (P < 0·001), the synergy1 and control groups (P < 0·001), and the oligofructose and control groups (P < 0·001). No statistically significant difference was observed between the groups receiving the prebiotic (P>0·05) according to the multiple-comparisons Tukey's test.
Anaemia-related values
Fig. 1(a) shows the changes in the weekly values of Hb (g/l) presented by the four groups after initiation of the dietary treatment. The synergy1 and control group values progressed without statistically significant differences between them, while the HP inulin and oligofructose groups presented a higher elevation of the Hb and haematocrit with statistically significant differences in relation to the control group (P < 0·05). The difference between synergy1 and HP inulin or oligofructose was not significant at any of the time points.

Fig. 1 Median and percentiles (25th–75th) of the values of (a) Hb (g/l) and (b) haematocrit (%) in the high-performance (HP) inulin (■, ![]() ), synergy1 (
), synergy1 (![]() , ▲), oligofructose (
, ▲), oligofructose (![]() ,
, ![]() ) and control (
) and control (![]() ,
, ![]() ) groups, before treatment and at each week of the experimental rations. There were no significant differences (a, P < 0·925; b, P = 0·857). Week 1: HP inulin > control; oligofructose > control; synergy1 ≃ control; HP inulin ≃ oligofructose; HP inulin ≃ synergy1; oligofructose ≃ synergy1 ((a) P = 0·010; (b) P = 0·002). Week 2: HP inulin > control; oligofructose > control; synergy1 ≃ control; HP inulin ≃ oligofructose; HP inulin ≃ synergy1; oligofructose ≃ synergy1 (P = 0·001). Week 3: HP inulin>control; oligofructose>control; synergy1≃control; HP inulin≃oligofructose; HP inulin≃synergy1; oligofructose≃synergy1 (P ≤ 0·001).
) groups, before treatment and at each week of the experimental rations. There were no significant differences (a, P < 0·925; b, P = 0·857). Week 1: HP inulin > control; oligofructose > control; synergy1 ≃ control; HP inulin ≃ oligofructose; HP inulin ≃ synergy1; oligofructose ≃ synergy1 ((a) P = 0·010; (b) P = 0·002). Week 2: HP inulin > control; oligofructose > control; synergy1 ≃ control; HP inulin ≃ oligofructose; HP inulin ≃ synergy1; oligofructose ≃ synergy1 (P = 0·001). Week 3: HP inulin>control; oligofructose>control; synergy1≃control; HP inulin≃oligofructose; HP inulin≃synergy1; oligofructose≃synergy1 (P ≤ 0·001).
The weekly values of haematocrit confirmed the evolution of the Hb (Fig. 1(b)). During the 3 weeks of evaluation, the synergy1 and control group values progressed without statistically significant differences between them, while the HP inulin and oligofructose groups presented a higher elevation of haematocrit, with a statistically significant difference in relation to the control group (P < 0·05).
The apparent absorption of Fe was evaluated over 72 h and was considered as the difference between the total intake and the total amount excreted in the faeces. The apparent absorption showed a statistically significant difference between the HP inulin and control groups and between the oligofructose and control groups. This was not observed between the synergy1 and control groups (P>0·05). In absolute terms, the averages presented by the HP inulin, synergy1, oligofructose and control groups were, respectively: 68·21 (sd 17·69), 56·71 (sd 22·74), 72·02 (sd 15·31) and 46·83 (sd 19·14) % (P = 0·010).
The fresh weight of the liver was 12·53 (sd 2·02) g in the HP inulin group, 12·67 (sd 1·73) g in the synergy1 group, 12·60 (sd 2·06) g in the oligofructose group and 12·57 (sd 2·84) g in the control group (P = 0·999). The content of hepatic Fe determined in the dry tissue was 224·97 (sd 79·33) μg/g in the HP inulin group, 215·20 (sd 70·56) μg/g in the synergy1 group, 212·73 (sd 49·38) μg/g in the oligofructose group and 180·67 (sd 77·22) μg/g in the control group (P = 0·454).
Weight of faeces
Fig. 2 shows the differences in the weight of the fresh faeces collected over 72 h from the 10th day that the experimental rations were offered to the four groups. These statistical differences remained after the faeces were dried in the oven. The averages of the dry weights of the faeces were: 1·68 (sd 0·55), 1·64 (sd 0·33), 1·32 (sd 0·41) and 1·11 (sd 0·24) g for the HP inulin, synergy, oligofructose and control groups, respectively (P = 0·003). The humidity of the faeces was 54·94 (sd 10·28) % in the HP inulin group, 50·84 (sd 12·38) % in the synergy1 group, 49·61 (sd 14·35) % in the oligofructose group and 37·46 (sd 6·40) % in the control group (P = 0·003). Significant differences between the HP inulin group and the control group and between the synergy1 group and the control group were observed.
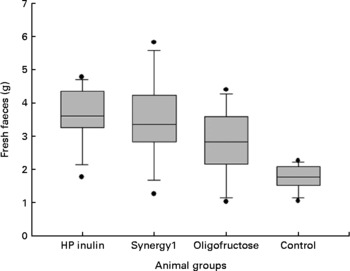
Fig. 2 Median and 25th and 75th percentiles of the fresh faeces (weight) collected over a period of 72 h during the experimental rations. High-performance (HP) inulin > control; synergy1 > control; oligofructose ≃ control; HP inulin ≃ oligofructose; HP inulin ≃ synergy1; synergy1 ≃ oligofructose (P ≤ 0·001).
Caecal characteristics
Table 3 shows the weights of the different intestinal areas extracted after the animals were killed and the statistical differences obtained in each case. Fig. 3 shows the macroscopic aspect of the caecum of the different groups. The average values of the caecum pH in the HP inulin, synergy1, oligofructose and control groups were, respectively: 5·05 (sd 0·42), 5·09 (sd 0·29), 4·82 (sd 0·19) and 6·61 (sd 0·22). A statistically significant difference was observed between the groups receiving prebiotics and the control group (P ≤ 0·001), while no significant difference was observed in the comparison between the groups consuming prebiotics (P>0·05).
Table 3 Weights (g) of: the caecum with the caecal content, the caecal wall, the proximal colon, the distal colon and the total colon in animals of the high-performance (HP) inulin, synergy1, oligofructose and control groups
(Median values with their 25th and 75th percentiles)*

a,b Median values within a row with unlike superscript letters were significantly different in comparisons between groups (P < 0·05).
* Kruskal–Wallis test.

Fig. 3 Caecum immediately after extraction from each group. (a) High performance inulin group; (b) Synergy1 group; (c) oligofructose group; (d) control group.
Discussion
The present study shows that inulin and oligofructose increase Fe biodisponibility while synergy1 did not differ from the control group. All the experimental groups (except the control group) presented an increase in the caecum weight and a decrease in the luminal pH. On the other hand, growth was similar in all groups.
There is evidence in the literature that interference with food intake can have negative effects on the growth of infants(Reference Sierra Salinas, Martínez Costa and Dalmau Serra28) and in the absorption of minerals(Reference Dagnelie, van Staveren and Verschuren29), which probably justifies why there is no fibre recommendation for children up to 1 year of age(Reference Williams19, Reference Trumbo, Schlicker and Yates20). However, recent studies mention the benefits of dietary fibre(Reference Freitas, Amancio and Novo11, Reference Kanauchi, Araki and Andoh30) and prebiotics for the absorption of Ca and Mg in animals(Reference Younes, Coudray and Bellanger9, Reference Lopez, Coudray and Levrat-Verny10, Reference Ohta, Ohtsuki and Baba31) and humans(Reference Holloway, Moynihan and Abrams5, Reference van den Heuvel, Muys and Dokkum6). Few studies have been conducted on animals to evaluate the absorption of Fe, which showed either a benefit or a lack of influence(Reference Medeiros, Morais and Tahan12, Reference Delzenne, Aertssens and Verplaetse32–Reference Weber, Freitas and Amancio35). In our study, the progression in the values of Hb and haematocrit during the 3 weeks of prebiotic intake showed a higher Hb regeneration in the HP inulin and oligofructose groups, in accordance with the literature(Reference Medeiros, Morais and Tahan12, Reference Delzenne, Aertssens and Verplaetse32–Reference Sakai, Ohta and Shiga34). In addition to the previous studies(Reference Delzenne, Aertssens and Verplaetse32–Reference Sakai, Ohta and Shiga34), the present study also evaluated the effect of synergy1 on Fe absorption. Although the synergy1 group had a higher and faster regeneration of haemoglobinic mass in relation to the control group, it was not significantly different in any of the three evaluations performed.
To sensitise the model used in our study, we made the haemoglobinic regeneration slower, and the amount of Fe used in this experiment was less than that recommended by the American Institute of Nutrition (AIN93-G: 35 mg/kg of ration)(Reference Reeves, Nielsen and Fahey21). Thus, 25 mg of Fe/kg of ration was added. Experiments that were carried out in our laboratory previously showed that this model is efficient to evaluate the effects of dietary fibre(Reference Freitas, Amancio and Novo11, Reference Weber, Freitas and Amancio35, Reference Catani, Amancio and Fagundes-Neto36) on the absorption of Fe.
Progression of the values of Hb and haematocrit during the 3 weeks of prebiotic intake showed a higher Hb regeneration in the HP inulin and oligofructose groups, in accordance with the literature(Reference Ohta, Sakai and Takasaki7, Reference Delzenne, Aertssens and Verplaetse32–Reference Sakai, Ohta and Shiga34). However, although the synergy1 group had a higher and faster regeneration of haemoglobinic mass in relation to the control group, it was not significantly different in any of the three evaluations performed.
Studies have reported that synergy1 benefits the absorption of Ca and Mg in the upper level compared to the prebiotics offered separately, with a synergistic effect apparently coming from the combination of prebiotics(Reference Coudray, Tressol and Gueux4). This effect was not found regarding the absorption of Fe when compared to HP inulin and oligofructose, indicating that the apparent absorption of Fe confirmed the Hb and haematocrit results.
In the literature, there is a strong interest in defining how some types of dietary fibre could benefit the absorption of minerals(Reference Blachier, Vaugelade and Robert37, Reference Johnston, Johnson and Marks38). Regarding Fe, a partial explanation comes from recent studies on the Fe absorption capacity of the large intestine in animals. The large intestine is the location of fermentation of prebiotics, which increases the expression of genes for the absorption of Fe, although these receptors exist in lower concentrations than in the duodenum(Reference Blachier, Vaugelade and Robert37–Reference Tako, Glahn and Welch39). In 2007(Reference Blachier, Vaugelade and Robert37), a study on pigs showed that colonic absorption in these animals was equivalent to 14 % of the duodenal absorption.
Parallel to this capability, the increase in the superficial area of absorption is a consequence of the trophic effect generated by non-digestible oligosaccharides on the caecum and colon(Reference Lopez, Levrat-Verny and Coudray26, Reference Pérez-Conesa, López and Ros40), which is related to the production of SCFA(Reference Frankel, Zhang and Singh41). The trophic effect produced by the prebiotics studied here may be indicated by the larger weight of the caecal wall and the proximal and distal colon in relation to the control group.
Also, the production of SCFA decreases the value of caecal pH, generating benefits on the intestinal absorption of minerals and allowing higher solubility of ions, including Fe(Reference Pérez-Conesa, López and Ros40). In this study, the pH measured in the caecum was lower among the groups receiving the prebiotics than the control group. It is also known that SCFA can form soluble complexes with Fe(Reference Bouglé, Vaghefi-Vaezzadeh and Roland42), facilitating the entry of Fe into intestinal cells. Another study observed that Fe deficiency in young women in South India was associated with low levels of lactobacilli in the faeces(Reference Balamurugan, Regina Mary and Chittaranjan43), suggesting that the intestinal bacterial flora may facilitate absorption of Fe from the caecum and proximal colon. It was observed that inulin enhanced the abundance of beneficial bifidobacteria and lactobacilli in the microbiota adherent to intestinal mucus in various gut segments of pigs. Therefore, the ability of dietary inulin to alter intestinal bacterial populations may partially account for the Fe bioavailability-promoting effect(Reference Patterson, Yasuda and Welch44, Reference Tako, Glahn and Welch45).
However, it should be emphasised that the effects of fibre on absorption are not restricted to the colon. The apparent absorption of minerals in pigs receiving resistant starch or digestible starch had higher absorption of these substances, including Fe in the group receiving resistant starch, although the digested material was collected in the terminal ileum. The authors relate the increase in the transition time generated by the resistant starch to higher absorption due to the increased time in which the food was in contact with the intestinal wall(Reference Morais, Feste and Miller46). An increase in the surface generated by the fibre and in the products of fermentation can also occur in the small intestine through a stimulus via systemic mediation. The possible causes of this mediation are the autonomic nervous system, the peptide hormone YY, enteroglucagon, glucagon-like peptide, gastrin(Reference Frankel, Zhang and Singh41, Reference Fukunaga, Sasaki and Araki47) and the increased number of Fe receptors stimulated by the intake of prebiotics(Reference Tako, Glahn and Welch39).
It is interesting to observe the effect of synergy1 on the absorption of Fe. Although there is more regeneration of Hb in this group in comparison to the control group, this difference is not statistically significant. In turn, the effect on the caecal pH and the weight of the intestinal wall in this group was similar to the other groups consuming prebiotics.
In 2007, Tako et al. (Reference Tako, Glahn and Welch39) offered synergy1 as a source of inulin and confirmed the increase of such receptors when evaluating the change of receptors for Fe in different places of the intestines of pigs that consumed prebiotics. Despite this result, the change in the concentration of Hb compared to the control group only occurred in the sixth and last week of the study. Other studies that evaluated the effects of a mixture of fibre found that the Fe balance was significantly lower for rats that were fed the fibre blend(Reference Galibois, Desrosiers and Guévin48, Reference Wang, Funk and Garleb49).
It can be speculated, considering the positive effects of the fructans (inulin and oligofructose) on mineral absorption, that the levels of 5 % of inulin associated with 5 % of oligofructose (synergy1) are not sufficient to generate the same effects on the absorption of Fe as 10 % of these prebiotics offered separately. Thus, the magnitude of the effect on the absorption of trace elements is affected by the type and dose of fructan(Reference Scholz-Aherns and Schrezenmeir50). Wolf et al. (Reference Wolf, Firkins and Zhang51) studied the effects of oligofructose (1, 3 and 5 %) on the apparent absorption and balance of various minerals, including Fe, Mg, Zn, Ca and P, and found that only the absorption of Mg, in the group that received 5 % of oligofructose in rations, was significantly higher than in the control group. A study comparing an intake of 5 and 10 % of fructo-oligosaccharides with different chain sizes found that the highest concentration of fructo-oligosaccharides benefited the absorption of Ca and Mg, but the size of the chain did not generate significant differences(Reference Ohta, Ohtsuki and Baba52).
It can be speculated that the higher stimulus to the absorption of Ca generated by synergy1, as shown in some studies, could inhibit the absorption of Fe, since the studies clearly showed an antagonistic relationship between Ca and dietary Fe absorption(Reference Hallberg, Brune and Erlandsson53).
Diets rich in dietary fibres could potentially reduce energy intake; so there is still no recommendation regarding the consumption of fibre in the first year of life, probably because of concerns that fibre may have negative effects on growth. This hypothesis is suggested because children have a lower gastric capacity and the energy density of foods rich in dietary fibre is low and these foods are capable of delaying gastric emptying, thus prolonging satiety(Reference Sierra Salinas, Martínez Costa and Dalmau Serra28). However, in this study, there was no decrease in food intake or body growth.
The weight of the fresh and dried faeces and the faecal humidity showed that the HP inulin and synergy1 prebiotics cause effects similar to those of soluble fibres(Reference Nyman54). These fibres are probably generated by the content of faecal water that is increased, and by the presence of bacteria, since these fibres are fully fermented and this fermentation extends to the most distal parts of the intestine, unlike with oligofructose.
In conclusion, this experimental study conducted with anaemic rats in the growth phase showed the benefit of HP inulin and oligofructose prebiotics on the regeneration of haemoglobinic mass. Synergy1 did not generate results to the same extent. The body growth and food intake were not prejudiced by the consumption of any of the studied prebiotics. It is important to emphasise that new studies evaluating the effect of synergy1 on intestinal absorption of Fe are needed, as well as studies in human infants evaluating the safety of foods that are rich in dietary fibre.
Acknowledgements
The present research was supported by ‘Coordination of Improvement of Higher Education’ – CAPES and the ‘São Paulo Research Foundation’ – FAPESP, Brazil. The authors’ contributions were as follows: K. d. C. F., M. B. d. M. and O. M. S. A. were instrumental in the conception and design of the study. K. d. C. F. and M. B. d. M. were responsible for the generation of the study. K. d. C. F. and M. B. d. M. performed the assembly, analysis and interpretation of the data (statistical analysis). K. d. C. F., M. B. d. M. and O. M. S. A. contributed to the revision of the manuscript. None of the authors had any personal or financial interest in any organisation sponsoring this research or any conflict of interest related to their participation in this study.


