


Patients with chronic kidney disease (CKD) are at increased risk of malnutrition. Among CKD patients, malnutrition characterised by the loss of body protein mass and energy reserves is more aptly called protein-energy wasting (PEW)(Reference Fouque, Kalantar-Zadeh and Kopple1). The prevalence of PEW ranged from 18 % to 75 % in previous reports(Reference Carrero, Thomas and Nagy2). PEW can occur in the early stages of CKD and increases with the progression of kidney function(Reference Kovesdy, Kopple and Kalantar-Zadeh3–Reference Hyun, Lee and Han5). Complications caused by PEW, such as infection, CVD, frailty and depression, can also aggravate the extent of PEW(Reference Obi, Qader and Kovesdy6). Compared with non-malnourished patients, the hospitalisation rate, readmission rate and mortality of CKD patients with PEW increased significantly(Reference Inoue, Ishikawa and Shirai7,Reference Chao, Tang and Cheng8) .
Sustained systemic inflammation is a prominent feature of CKD and is considered a main cause of malnutrition in CKD patients(Reference Zha and Qian9–Reference Ikizler, Cano and Franch11). Elevated serum levels of inflammatory factors, such as C-reactive protein, IL-6 and TNF-α, have been reported in patients with CKD(Reference Eustace, Astor and Muntner12,Reference Amdur, Feldman and Gupta13) . A chronic inflammatory state leads to muscle catabolism, anorexia, decreased secretion of insulin-like growth factor-1 and decreased voluntary activity, all of which can lead to PEW in CKD patients(Reference Zha and Qian9,Reference Ikizler14,Reference Carrero and Stenvinkel15) .
Recently, the neutrophil to lymphocyte ratio (NLR) was considered an inflammatory marker. Studies have shown that the NLR is associated with the risk of end-stage renal disease, CVD and even mortality in patients with CKD(Reference Yoshitomi, Nakayama and Sakoh16–Reference Woziwodzka, Dziewierz and Pawica20). A study from Diaz-Martinez found that the NLR was associated with albumin (Alb) and BMI in patients undergoing haemodialysis(Reference Diaz-Martinez, Campa and Delgado-Enciso21). A cross-sectional study of ninety-five geriatric patients found that the NLR was an independent factor predicting malnutrition or the risk of malnutrition in elderly patients(Reference Kaya, Acikgoz and Yildirim22). However, the relationship between the NLR and nutritional parameters in non-dialysis CKD patients is still unclear.
Thus, the aim of this study was to investigate the relationship between the NLR and nutritional parameters in non-dialysis CKD patients.
Methods
Study participants
In this single-centre cross-sectional study, non-dialysis CKD inpatients and outpatients at Sun Yat-sen Memorial Hospital from 1 September 2019 to 1 November 2020 were enrolled. The exclusion criteria were severe gastrointestinal disease, class III or IV heart failure, cancer, haematological diseases, active infection, pregnancy and the use of immunosuppressants. Patients who could not cooperate to complete the anthropometric measurements and Subjective Global Assessment (SGA) were also excluded. According to the median NLR, there were ninety-three patients in the low NLR group and ninety-four patients in the high NLR group. The study protocol was approved by the Ethics Committee of Sun Yat-sen Memorial Hospital, with the approval number SYSEC-KY-KS-2021-100. The Ethics Committee agreed that this study was exempt from informed consent.
Measurement and data collection
Anthropometric data were measured by a trained nutritionist from the clinical nutrition department of Sun Yat-sen Memorial Hospital. SGA and dietary intake were also assessed by the same nutritionist.
Anthropometric data
Anthropometric indicators, including BMI, waist and hip circumference, triceps skinfold thickness (TSF) and mid-arm circumference, were measured according to the protocol proposed by Lohman(Reference Lohman, Roche and Martorell23). BMI was calculated as body weight (kg) divided by squared height (m2). A standard skinfold caliper was used to measure TSF halfway between the left acromion process and the left olecranon process to the nearest 0·1 mm. We calculated the mid-arm muscle circumference (cm) as mid-arm circumference (cm) − 0·3142 × TSF (mm). The handgrip strength was measured by a digital grip strength dynamometer (Camry Digital Hand Dynamometer, Model EH101). Mean grip strength for each hand calculated across three attempts was used, and the highest value was noted.
Subjective Global Assessment
SGA included weight change, dietary intake, gastrointestinal symptoms, functional capacity, disease and its relative nutritional requirements and physical examination (loss of subcutaneous fat, muscle wasting, oedema and ascites). Patients were classified as well nourished (SGA class A), moderately malnourished (SGA class B) or severely malnourished (SGA class C). Patients with SGA class B or C were uniformly defined as PEW(Reference Detsky, McLaughlin and Baker24).
Dietary assessment
Three-day 24-h dietary recalls were used to estimate dietary intakes. Through face-to-face interviews, individuals were asked to recall the type of food, total amount consumed and preparation method for the 3 d before enrolment. The daily dietary energy intake and daily dietary protein intake (DPI) were calculated using nutrient analysis software, which was established by the use of China Food Composition Tables (the sixth edition).
Other variables
Data regarding demographics, causes of CKD, history of hypertension and diabetes mellitus were collected. Laboratory indicators were also collected. Laboratory data included serum K, serum Na, Ca, serum P, glucose, serum creatinine (Scr), serum bicarbonate, Alb, total cholesterol, TAG, HDL, LDL, erythrocyte, neutrophil, lymphocyte, Hb and 24-h urine protein. The NLR was calculated as the neutrophil count divided by the lymphocyte count. The estimated glomerular filtration rate was calculated by the Chronic Kidney Disease Epidemiology Collaboration (CKD-EPI) equation(Reference Levey, Stevens and Schmid25).
Statistical analyses
Data analyses were performed using SPSS (version 25) and GraphPad Prism 7.0, with P < 0·05 considered significant. Normally distributed variables and non-normally distributed variables are expressed as the mean values and standard deviations and median (interquartile range), respectively. Categorical variables were described using frequency and proportion. Chi-square or Fisher’s exact tests were performed to compare categorical variables between the high NLR group and the low NLR group, while Student’s t test or Mann–Whitney U test was used for continuous variables. The Kruskal–Wallis test was used to compare NLR levels in CKD stages 1–5. Spearman’s rank correlation was used to examine correlations between the NLR and nutritional parameters. For variables that were closely associated with PEW in univariable analyses (P < 0·05), multivariable binary logistic regression models were used to determine the independent associations of each variable and PEW. Receiver operating characteristic curve analysis was performed to identify the sensitivity and specificity of the NLR cut-off in distinguishing PEW. The optimal cut-off point was determined by the Youden index.
Results
Baseline characteristics
A total of 187 patients were enrolled in this study. The median age was 47·0 (95 % CI 35·0, 57·0), and seventy-nine patients (42·2 %) were male. The most common aetiology was chronic glomerulonephritis (n 135, 72·2 %), followed by diabetic nephropathy (n 24, 12·8 %), interstitial nephritis (n 13, 7·0 %), hereditary nephropathy (n 5, 2·7 %), hypertensive nephropathy (n 4, 2·1 %), obstructive nephropathy (n 4, 2·1 %) and purpuric nephritis (n 2, 1·1 %). In terms of co-morbid diseases, 55·1 % of the patients had hypertension, and 20·8 % had diabetes mellitus.
The median level of NLR was 2·51 (95 % CI 1·83, 3·83). The NLR was 2·12 (95 % CI 1·57, 3·11), 2·03 (95 % CI 1·58, 3·50), 2·25 (95 % CI 1·61, 3·01), 3·04 (95 % CI 2·06, 4·38) and 3·23 (95 % CI 2·55, 4·07) in stages 1–5 CKD, respectively. Compared with CKD stage 1 patients, NLR level in stage 4 and stage 5 was significantly higher (Fig. 1). The baseline characteristics are shown in Table 1.
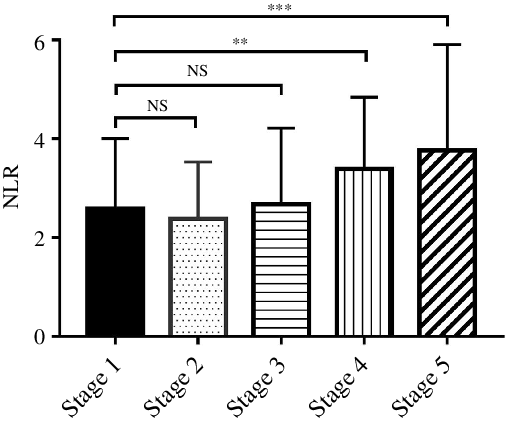
Fig. 1. The NLR was significantly different between CKD stages 1–5 (Kruskal–Wallis test, P < 0·001). The difference between stage 2, stage 3 and stage 1 was not significant, but compared with stage 1, NLR level was significantly increased in stage 4 and stage 5. NLR, neutrophil to lymphocyte ratio; CKD, chronic kidney disease. **P < 0·01, ***P < 0·001.
Table 1. Comparison of clinical characteristic between the low NLR group and the high NLR group (Mean values and standard deviations; numbers and percentages)
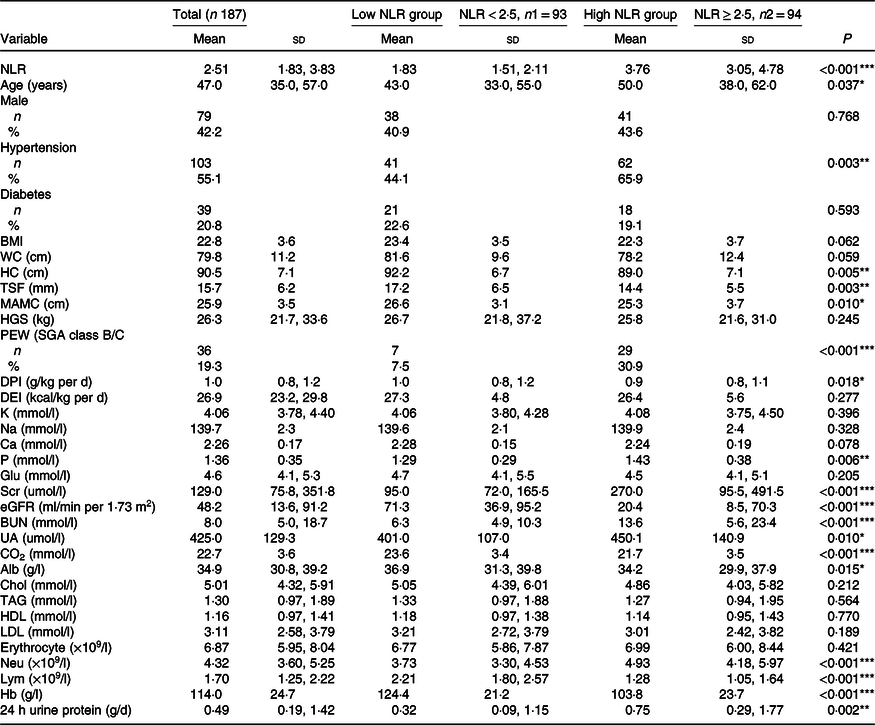
NLR, neutrophil to lymphocyte ratio; WC, waist circumference; HC, hip circumference; TSF, triceps skinfold thickness; MAC, mid-arm circumference; MAMC, mid-arm muscle circumference; HGS, handgrip strength; PEW, protein-energy wasting; SGA, Subjective Global Assessment; DPI, dietary protein intake; DEI, dietary energy intake; K, serum potassium; Na, serum sodium; P, serum phosphorus; Glu, glucose; Scr, serum creatinine; eGFR, estimated glomerular filtration rate; BUN, blood urea nitrogen; UA, uric acid; CO2, serum bicarbonate; Alb, albumin; Chol, total cholesterol Neu, neutrophil; Lym, lymphocyte.
*P < 0·05, **P < 0·01, ***P < 0·001.
Comparison of the low neutrophil to lymphocyte ratio group and the high neutrophil to lymphocyte ratio group
Patients with an NLR < 2·5 and NLR ≥ 2·5 were defined as the low NLR group and high NLR group, respectively. The median NLR in the low NLR group was 1·83 (95 % CI 1·51, 2·11), and that in the high NLR group was significantly higher (3·76 (95 % CI 3·05, 4·78), P < 0·001). As shown in Table 1, patients in the high NLR group were more likely to be older, have hypertension, have PEW and have higher levels of Scr, serum P and 24-h urine protein than those in the low NLR group (P < 0·05). The levels of nutritional parameters, including hip circumference, TSF, mid-arm muscle circumference, DPI, Alb and Hb, significantly decreased in patients in the high NLR group (P < 0·05). Significant differences in median levels of estimated glomerular filtration rate and serum bicarbonate between the two groups were observed.
Correlations between the neutrophil to lymphocyte ratio and nutritional parameters
A positive correlation was observed between the NLR and SGA class (r 0·301, P < 0·001) and serum P (r 0·219, P = 0·003). A negative correlation was detected between the NLR and BMI (r –0·169, P = 0·023), waist circumference (r –0·195, P = 0·014), hip circumference (r –0·281, P < 0·001), TSF (r –0·024, P = 0·003), mid-arm muscle circumference (r –0·234, P = 0·002), DPI (r –0·159, P = 0·030) and Hb (r –0·375, P < 0·001). Alb was negatively correlated with the NLR but not significantly (r –0·116, P = 0·117). Correlation analysis data are presented in Table 2.
Table 2. Correlation between the NLR and nutritional parameters
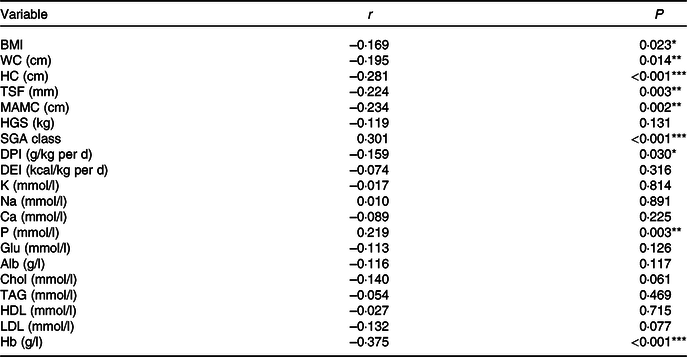
WC, waist circumference; HC, hip circumference; TSF, triceps skinfold thickness; MAC, mid-arm circumference; MAMC, mid-arm muscle circumference; HGS, handgrip strength; SGA, Subjective Global Assessment; DPI, dietary protein intake; DEI, dietary energy intake; K, serum potassium; Na, serum sodium; P, serum phosphorus; Glu, glucose; Alb, albumin; Chol, total cholesterol.
*P < 0·05, **P < 0·01, ***P < 0·001.
Association of the neutrophil to lymphocyte ratio with protein-energy wasting
The prevalence of PEW (SGA class B/C) was 19·3 % (n 36). There were 13·2 % (7/53), 9·7 % (3/31), 17·2 % (5/29), 25·0 % (6/24) and 30·0 % (15/50) of patients suffering from PEW in stages 1–5 CKD, respectively (P = 0·021). By univariate logistic regression analysis, high NLR, Scr, blood urea nitrogen and uric acid levels were risk factors for PEW, while high DPI, dietary energy intake and Hb were protective indictors (Table 3). The NLR remained associated with PEW after adjusting for DPI, dietary energy intake, Scr, blood urea nitrogen, uric acid and Hb. The results showed that for every 1 unit increase in the NLR, the odds of PEW increased by 1·393-fold (OR = 1·393, 95 % CI 1·078, 1·800, P = 0·011, Table 3).
Table 3. Logistic regression analysis of clinical predictors for PEW (SGA class B/C) (Odds ratios and 95 % confidence intervals)
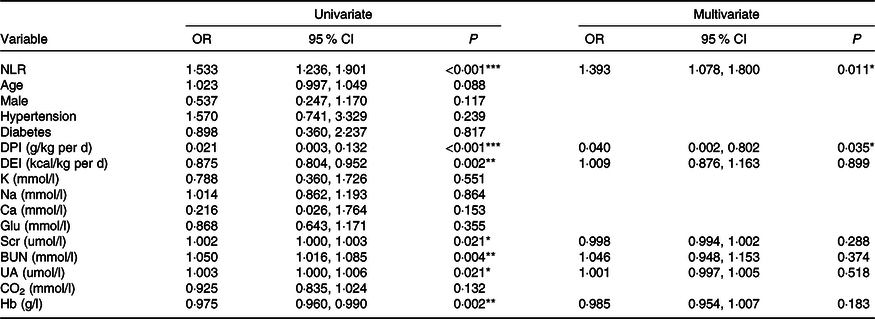
PEW, protein-energy wasting; SGA, Subjective Global Assessment; DPI, dietary protein intake; DEI, dietary energy intake; K, serum potassium; Na, serum sodium; Glu, glucose; Scr, serum creatinine; BUN, blood urea nitrogen; UA, uric acid; CO2, serum bicarbonate.
*P < 0·05, **P < 0·01, ***P < 0·001.
Cut-off value of the neutrophil to lymphocyte ratio in evaluating protein-energy wasting
Receiver operating characteristic analysis showed that an NLR ≥ 2·62 had the highest ability to identify PEW among CKD patients. It demonstrated a sensitivity of 77·8 % and a specificity of 62·3 %, and the AUC was 0·71 (95 % CI 0·63, 0·81, P < 0·001, Fig. 2).
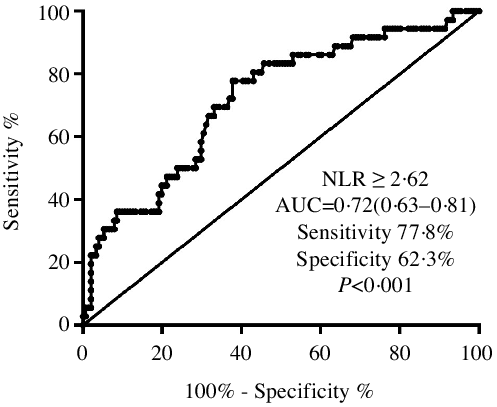
Fig. 2. The ROC curve plot showed that the sensitivity and specificity of an NLR ≥ 2·62 to distinguish PEW were 77·8 and 62·3 %, respectively. ROC, receiver operating characteristic; NLR, neutrophil to lymphocyte ratio; PEW, protein-energy wasting.
Discussion
The present study observed that the NLR gradually increased with increasing CKD stage. Patients with a higher NLR had worse clinical nutritional parameters and a higher prevalence of PEW. The NLR was an independent risk factor for PEW in CKD patients. Furthermore, the NLR showed moderate power to diagnose PEW among CKD patients.
The median NLR in our study was 2·51 (95 % CI 1·83, 3·83), which was similar to the results of 1·87–2·81 in previous reports(Reference Yoshitomi, Nakayama and Sakoh16,Reference Yuan, Wang and Peng17,Reference Solak, Yilmaz and Sonmez19,Reference Okyay, Inal and Onec26) . Compared with patients with a low NLR, patients with a high NLR in our study were older and had a higher incidence of hypertension, worse kidney function and higher urine protein excretion. Studies from Yoshitomi R(Reference Yoshitomi, Nakayama and Sakoh16) and Yuan Q(Reference Yuan, Wang and Peng17) also revealed an older age in the high NLR group. A single-centre observational study involving patients with CKD stages 1–5 found a positive association between the NLR and average nighttime systolic blood pressure (r 0·25, P = 0·01), and the NLR was an independent predictor of average nighttime systolic blood pressure (hazard ratio = 11·2, 95 % CI 1·8, 20·6, P = 0·02)(Reference Klimczak-Tomaniak, Pilecki and Zochowska27). These results indicate that NLR might contribute to hypertension, which needs to be verified in future studies. As previously reported(Reference Yoshitomi, Nakayama and Sakoh16,Reference Yuan, Wang and Peng17,Reference Solak, Yilmaz and Sonmez19) , the NLR gradually increased with the progression of CKD, and the high NLR group showed markedly higher Scr levels. Moreover, the NLR was significantly elevated in patients with CKD compared with those without CKD(Reference Okyay, Inal and Onec26,Reference Kuo, Wang and Lin28) and was associated with poor renal outcomes in CKD patients(Reference Yoshitomi, Nakayama and Sakoh16–Reference Kocyigit, Eroglu and Unal18). In addition, the NLR was related to urine protein(Reference Yilmaz, Sevinc and Ustundag29), which is a powerful risk predictor for the progression of renal function. Therefore, it is necessary to monitor the NLR clinically and explore treatments to prevent an increase in the NLR during the course of CKD.
As shown in Table 2, the NLR was closely related to the nutritional index from multiple measurements, including anthropometric parameters (BMI, waist circumference, hip circumference, TSF and mid-arm muscle circumference), dietary intake (DPI), nutrition scale scores (SGA class) and laboratory examinations (Hb). Our results indicate that the NLR might be a novel inflammatory indicator for monitoring nutritional status. Alb is routinely used as a clinical parameter to assess nutritional status, and it was negatively correlated with the NLR in previous studies(Reference Diaz-Martinez, Campa and Delgado-Enciso21,Reference Okyay, Inal and Onec26) . However, no significant relation between the NLR and Alb was discovered among our patients, which might be due to the limited sample size in this study.
Studies have demonstrated that 11–31 % of patients with CKD were malnourished, as defined by SGA(Reference Cuppari, Meireles and Ramos30–Reference Seo, Lee and Kim33). The prevalence of PEW measured by SGA was 19·6 % in our study. It is well known that systemic inflammation plays a vital role in PEW. Through a series of complex mechanisms, such as up-regulating myostatin (a TNF-β superfamily protein), reducing secretion of insulin-like growth factor-1 and decreasing voluntary activity, inflammation preferentially increases protein catabolism and inhibits protein anabolism, leading to net protein loss and PEW in patients with CKD(Reference Zha and Qian9). The NLR is considered a marker of inflammation, and for the first time, this study confirmed that the NLR is an independent risk factor for PEW. For every additional unit of the NLR, the risk of PEW increased by 39·3 % (OR = 1·393, 95 % CI 1·078, 1·800, P = 0·011). Interestingly, we also found that an NLR ≥ 2·62 had the ability to identify PEW among CKD patients.
However, this study had limitations. First, it was a single-centre study with a relatively small sample size, and the number of patients with PEW was limited. Second, potential factors that may affect inflammation and nutritional status, such as medication, lifestyle and dietary pattern, were not included in the analysis. Third, this is an observational study, so we cannot assume cause and effect associations between NLR and PEW in non-dialysis CKD patients. Further and larger studies are necessary to strengthen the validity of our findings.
Conclusion
Our study suggests that the NLR was closely associated with nutritional status and that a higher NLR indicated worse nutritional status. The NLR may be a novel inflammatory indicator for monitoring nutritional status in non-dialysis CKD patients. This is the first study in which an NLR cut-off was investigated and used to evaluate malnutrition assessed by SGA in non-dialysis CKD patients. These findings could contribute to a convenient assessment of the nutritional status of CKD patients for clinicians.
Acknowledgements
The authors thank all nephrologists and nurses in our centre for their management of the CKD patients, and B. Li for his assistance in the statistical analyses. The authors also thank the atients who participated in this study.
This work was supported by the National Natural Science Foundation of China (no. 81770709); the Guangzhou Municipal Science and Technology Project (no. 201904010142) and Sun Yat-sen Memorial Hospital Clinical Research and Cultivation Project (no. SYS-C-201903).
Q. H., S. L. and Q. Y. designed and supervised the study. F. H. and C. C. performed nutritional measurement and SGA assessment. S. L., R. Z., X. X., R. H. and F. Q. enrolled patients and completed data collection. Q. H. and S. L. completed data analysis. Q. H., S. L. and Q. Y. wrote the manuscript. All authors have thoroughly reviewed the manuscript and approved the final manuscript for publication.
The authors declare that this study was conducted without any commercial or financial relationships or conflicts of interest.


