


Sleep curtailment is a risk factor for obesity-associated metabolic diseases, possibly due to the important role of sleep in maintaining glucose homeostasis(Reference Briancon-Marjollet, Weiszenstein and Henri1). For example, impaired glucose clearance and whole-body insulin sensitivity can occur following a single night of either sleep deprivation (e.g. limiting the habitual duration), broken sleep (i.e. two periods of sleep separated by an extended waking interval – e.g. 23.00–01.00 and 05.00–07.30 hours) or non-specific sleep fragmentation (e.g. random arousal stimuli throughout the night)(Reference Donga, van Dijk and Gert van Dijk2–Reference Wang, Greer and Porter5). Studies to date have employed differing protocols to curtail sleep; however, to our knowledge, only one previous study has examined the influence of hourly sleep fragmentation on postprandial metabolism(Reference Gonnissen, Hursel and Rutters6). In that study, postprandial insulin was lower following breakfast in the fragmentation condition relative to a normal night of sleep. However, whilst the use of metabolic units used in that study allowed for a highly controlled situation in which subjects are in a stable environment, it is important to consider the first night effect of an unfamiliar environment on sleep quality(Reference Tamaki, Won Bang and Watanabe7), and therefore to see whether these findings translate into more ecologically valid contexts (i.e. participants sleep in their own beds).
From an ecological standpoint, coffee is a commonly used means of combatting feelings of lethargy and fatigue(8), therefore acting as a ‘therapeutic tool’ following disrupted sleep. However, whilst moderate habitual caffeinated coffee consumption is associated with reduced risk of cardiovascular mortality and cancer incidences(Reference Poole, Kennedy and Roderick9), studies by Moisey et al. (Reference Moisey, Robinson and Graham10) (approximately 62 mg caffeine/100 ml coffee) and Robertson et al. (Reference Robertson, Clifford and Penson11) (100–400 mg caffeine) demonstrate the potential for a single serving of caffeinated coffee to acutely impair postprandial glucose metabolism in both normal-weight and overweight individuals. This raises the possibility that coffee consumption could potentiate any negative effects of sleep disruption on glucose metabolism. Furthermore, this effect of caffeine upon postprandial glycaemia seems to be modulated by a SNP in the CYP1A2 gene, which codes for an enzyme responsible for caffeine metabolism in the liver(Reference Sachse, Brockmöller and Bauer12). Caffeine is primarily metabolised (>95 %) through CYP1A2 activity(Reference Thorn, Aklillu and McDonagh13). However, this modulating role has yet to be investigated under a variety of scenarios(Reference Robertson, Clifford and Penson14,Reference Banks, Tomko and Colquhoun15) .
It is remarkable therefore that no study to date has investigated the combined effects of morning caffeinated coffee following disrupted sleep upon waking glucose control, although one study has investigated the combined influence of caffeinated coffee (65 mg caffeine) prior to sleep deprivation on next-day glucose control. Higher fasting serum insulin and increased levels of glucose and insulin were observed after an oral glucose tolerance test (OGTT) following sleep deprivation (4 h in bed) with consumption of caffeinated coffee relative to decaffeinated coffee(Reference Rasaei, Abd Talib and Ismail Noor16). However, coffee was consumed prior to sleep, which is not an ecologically valid model of when coffee is usually consumed, especially as a remedy following disrupted sleep. In addition, caffeine is a fast-acting pharmacological agent, with metabolic effects that occur rapidly and may subside within hours (especially amongst habitual caffeine consumers(Reference Bell and McLellan17)), so there is also a clear physiological rationale to examine the acute effects of caffeine intake upon waking immediately prior to the first intake of nutrients following the overnight fast.
The aim of this study, therefore, was to determine the effects of one night of sleep fragmentation with and without morning caffeinated coffee on glycaemic control relative to an undisturbed night of sleep in healthy young adults. An exploratory aim of the study was to examine whether individual responses were mediated by the CYP1A2 genotype of participants. It was hypothesised that sleep fragmentation per se would impair insulin sensitivity and that morning coffee would exacerbate this response, with the latter effect modulated by the relevant polymorphism of CYP1A2.
Methods and materials
Participants
Twenty-nine healthy men and women (age: 21 (sd 1) years, BMI: 24·4 (sd 3·3) kg/m2) participated in the study (Table 1). Exclusion criteria included BMI outside of the range of 18·5–29·9 kg/m2, any diagnosed metabolic disease (e.g. type 1 or type 2 diabetes), reported use of substances which may pose undue personal risk to the participants or introduce bias into the experiment and non-standard sleep–wake cycle (e.g. shift worker). All were informed of any potential risks and discomfort involved in the study prior to providing written and oral informed consent. The study was given a favourable ethical opinion by the Research Ethics Approval Committee for Health (REACH) at the University of Bath (SES/HES: 18R1-019). The measurements of CY1PA2 gene polymorphism were completed as part of a wider screening project for which ethical approval was granted by the National Health Service Research Ethics Committee (18/NW/0573). All procedures were performed in accordance with the Declaration of Helsinki.
Experimental design
Participants underwent three trials in a randomised crossover design, with a washout interval of 7–14 d. For 48 h prior to each trial, participants standardised diet and physical activity and refrained from consuming caffeine and alcohol. Main trials involved an OGTT following a habitual night of sleep (Control; in bed, lights-off trying to sleep eight consecutive hours, waking <1 h prior to arrival at the laboratory) and a night of sleep fragmentation (Fragmented; as control but waking hourly for 5 min – prompted and verified by repeated text messaging), with and without morning coffee (Fragmented + Coffee; 300 mg caffeine as black coffee 30 min prior to OGTT).
Experimental protocol
Participants arrived in the laboratory at between 08.00 and 10.00 hours (within 1 h of waking) in an overnighted fasted state (approximately 10 h). Height, body mass and waist:hip circumference were assessed before participants completed baseline subjective assessments of sleep quality, mood and appetite on a 0–100 mm scale. Waist and hip circumferences were measured using a tape measure around the mid-point between bottom rib and top of the iliac crest and at the largest circumference between the waist and thighs, respectively(Reference Rimm, Stampfer and Colditz18). An intravenous cannula was placed into an antecubital vein, and a baseline sample of 5 ml venous blood collected (BD Venflon Pro). Cannulae were kept patent throughout all trials by flushing with 0·9 % NaCl infusion (B. Braun). Participants would then either consume a cup of caffeinated coffee (8·8 g Nescafé Original, Nestlé, SUI with 300 ml water; approximately 300 mg caffeine, approximately 163 mg total caffeoylquinic acids) or a matched volume of hot water over a 10-min period, 30-min prior to undergoing an OGTT. At the end of this 30-min period, a 5 ml blood sample was obtained before ingesting a 75 g oral load of glucose (113 ml Polycal; Nutricia with 87 ml water). Further blood samples were then taken at 15- and 30-min intervals for the first and second hour of the protocol, respectively, alongside hourly assessments of subjective mood and appetite.
Sleep fragmentation
Participants were asked to achieve 8-h time in bed, trying to sleep (approximately 23.00–07.00 hours – modifiable according to individual preference and time of testing the next day). Audible alarms were set on the hour every hour throughout the night. Upon waking, participants would receive a series of ten text messages from a member of the research team, at a rate of 1 every 30 s, which required simple responses prior to being able to fall asleep again (e.g. simple arithmetic). This would be repeated until wake time. Participants rated subjective sleep fragmentation using visual analogue scales upon entering the laboratory.
Blood analysis
All blood samples were immediately transferred into tubes treated with EDTA prior to centrifugation (10 min, 4000 g , 4°C) before the plasma supernatant was aliquoted and stored at –80°C for subsequent metabolite analysis. In the control trial, the buffy coat layer of the centrifuged bloods was removed and stored at –80°C for later genetic profiling. All plasma samples were later analysed for plasma glucose, using a spectrophotometric analyser (RX, Daytona, Randox Laboratories Ltd; inter-assay CV: <2 %) and insulin via ELISA (Crystal Chem; inter-assay CV: 13 (sd 3) %, intra-assay CV: 6 (sd 2) %).
DNA extraction and analysis
DNA was extracted from the buffy coat layer using a QIAamp DNA Blood Mini Kit following manufacturer’s instructions (Qiagen) and frozen at –80°C until analysis. Extracted DNA was then analysed for the rs762551 SNP using a 5′-nuclease allelic discrimination assay (Taqman drug metabolism genotyping assay SNP ID rs762551, C___8881221_40 [C/A], gene CYP1A2; ThermoFisher Scientific).
Statistical analysis
Sample size estimations were performed using G*Power software v3.1.9.4. Based on differences in plasma insulin following sleep deprivation (d = 1·58), and considering the multi-level (i.e. three condition) design of the study, a sample size of thirty was deemed adequate to provide a 95 % chance of detecting such an effect at α = 0·05.
All in-text values are reported as means with normalised CI, unless otherwise stated. Normality of data was assessed using the Shapiro–Wilk test, with a paired t test or Wilcoxon’s test employed to analyse parametric data and non-parametric data, respectively. A mixed model ANOVA (condition, time and condition × time) was used to examine differences in blood glucose and insulin data, with post hoc Bonferroni corrections applied in GraphPad Prism (GraphPad Software Inc.). Statistical significance was accepted at P < 0·05. Error bars shown on figures are also normalised CI corrected for between-participant variation, such that the magnitude of these CI therefore directly infers the contrast between paired means at each time point rather than variance of individual values around the mean(Reference Loftus and Masson19). Using this approach, error bars not overlapping their respective comparison would typically be deemed significantly different according to conventional null hypothesis testing (i.e. P < 0·05). Incremental AUC (iAUC – trapezoid method(Reference Wolever20)) and Matsuda insulin sensitivity index (Matsuda index(Reference Matsuda and DeFronzo21)) were calculated from plasma glucose and insulin data using Microsoft excel (version 16.04848.1000, Microsoft). Updated homoeostatic model of insulin resistance(Reference Levy, Matthews and Hermans22) was calculated using publicly available online software (https://www.dtu.ox.ac.uk/homacalculator/). Distribution of the rs762551 SNP was tested for fit against the global expected distribution using a Pearson’s χ 2 test with 1 df. All values for genotype data were taken from the Fragmented + Coffee condition, with ΔiAUC calculated as the difference between Fragmented + Coffee and Fragmented. As data for genotype were not paired, differences between means were compared using standard 95 % CI. Effects of trial order were assessed using two-way ANOVA testing for effects of Condition, Sequence or Sequence × Condition interactions(Reference Wellek and Blettner23,Reference Betts, Gonzalez and Burke24) .
Results
Glycaemia, insulinaemia and insulin sensitivity
Mixed model ANOVA revealed main effects for glucose for condition (P < 0·01), time (P < 0·01) and condition × time (P < 0·01). Plasma glucose concentrations did not differ between conditions at baseline and remained similar prior to ingestion of the oral glucose load (i.e. following caffeine or hot water ingestion; Fig. 1(a)). At the group level, after ingestion of the oral glucose load, plasma glucose concentrations rose to a greater extent in the Fragmented + Coffee v. the Fragmented and Control conditions (8·61 (95 % CI 8·25, 8·96) mmol/l v. 7·92 (95 % CI 7·57, 8·28) mmol/l, and 7·57 (95 % CI 7·21, 7·92) mmol/l, respectively; P < 0·05). Plasma glucose concentration remained higher in the Fragmented + Coffee condition relative to Control and Fragmented conditions at 120 min (P < 0·05). As such, plasma glucose iAUC was higher in the Fragmented + Coffee condition relative to the Fragmented (P = 0·02) but not Control (P > 0·05) conditions (196·6 (95 % CI 175·4, 217·7) v. 130·3 (95 % CI 114·3, 146·4) v. 153·1 (95 % CI 137·0, 169·1) mmol/l × 120 min, respectively).

Fig. 1. (a) Time course plasma glucose and (b) time course plasma insulin response to an oral glucose load following a habitual night of sleep (Control), a night of fragmented sleep (Fragmented) or sleep fragmentation + caffeinated coffee (Fragmented + Coffee). *P < 0·05. ![]() , Coffee/boiled water;
, Coffee/boiled water; ![]() , control;
, control; ![]() , fragmented;
, fragmented; ![]() , fragmented + coffee. OGTT, oral glucose tolerance test.
, fragmented + coffee. OGTT, oral glucose tolerance test.
Plasma insulin displayed effects of time (P < 0·01), but not condition (P = 0·06) or condition × time (P = 0·053). Baseline plasma insulin concentrations were similar between conditions pre-OGTT (Fig. 1(b)). Following ingestion of the glucose load, insulin rose to a greater extent in the Fragmented + Coffee condition, relative to both Control and Fragmented conditions (272 (95 % CI 251, 293) pmol/l v. 227 (95 % CI 206, 248) pmol/l and 223 (95 % CI 202, 244) pmol/l), respectively, at 30 min (P < 0·05) (Fig. 1(b)). Plasma insulin iAUC was not different in the Fragmented + Coffee condition relative to the Fragmented (P = 0·06) and Control (P = 0·08) conditions (10 035 (95 % CI 8892, 11 178) v. 7837 (95 % CI 7260, 8980) v. 8425 (95 % CI 7848, 9001) pmol/l × 120 min, respectively). Time to peak insulin, homoeostatic model of insulin resistance and Matsuda insulin sensitivity index were not different between conditions (Table 2).
Table 1. Summary of participant characteristics
(Mean values and standard deviations)
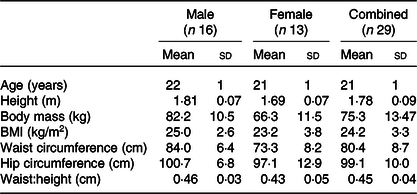
Table 2. Peak and time to peak glucose and insulin values in each condition alongside Matsuda insulin sensitivity index (ISI)
(Mean values and normalised confidence intervals calculated from individual peak and time to peak values)

au, Arbitrary units; HOMA2-IR, homoeostatic model of insulin resistance.
* Difference from Fragmented (P < 0·05).
Order effect
Analysis of Sequence × Condition interactions revealed no effect of first trial on the observed effect of Fragmented + Coffee (P = 0·101). However, an order effect in plasma glucose iAUC was observed whereby values in participants first trial were higher than both the second and third trial (197·0 (95 % CI 173·4, 220·6) v. 147·5 (95 % CI 125·7, 169·3) v. 132·2 (95 % CI 106·5, 158·0) mmol/l × 120 min, respectively).
Subjective sleep quality
Time to sleep (median (interquartile range (IQR)); 23.30 (IQR 23.00–00.00) v. 23.30 (IQR 23.00–00.01), v. 23.45 (IQR 23.05–24.10) hours) and wake time (07.00 (IQR 06.52–07.17) v. 07.00 (IQR 07.00–07.16) v. 07.00 (IQR 06.55–07.20) hours) did not differ between Control, Fragmented and Fragmented + Coffee conditions, respectively. Subjective ratings of sleep fragmentation (i.e. ‘How fragmented was your night’s sleep?’) were greater in the Fragmented and Fragmented + Coffee conditions, relative to the Control condition (83 (95 % CI 78, 87) v. 81 (95 % CI 77, 85) v. 8 (95 % CI 3, 11) mm/100, respectively).
Genotyping
Of the twenty-six genotyped, fifteen participants were homozygous for the A allele, with the remaining eleven carrying the C allele (n 2 CC; n 9 AC). The distribution of genotypes was therefore as expected within the given population and therefore did not deviate from the Hardy–Weinberg equilibrium (Pearson’s χ 2 test with 1 df, P > 0·05).
Secondary analysis: glycaemia and insulinaemia by genotype
The glucose iAUC (AA 208·5 (95 % CI 126·2, 290·8) v. AC/CC 188·7 (95 % CI 103·9, 273·4) mmol/l × 120 min; P = 0·54) and peak plasma glucose concentrations (AA 8·86 (95 % CI 7·94, 9·78) v. AC/CC 9·13 (95 % CI 8·33, 9·93) mmol/l; P = 0·71) did not differ between ‘fast metaboliser’ (AA) and ‘slow metaboliser’ (AC/CC) genotype. Furthermore, ΔiAUC for glucose between the sleep fragmentation and coffee trials was similar between ‘fast’ and ‘slow’ genotypes, respectively (81·8 (95 % CI 18·5, 145·1) v. 55·7 (95 % CI –8·1, 119·4) mmol/l × 120 min; P = 0·26).
Similarly, peak insulin concentration (AA 309·9 (95 % CI 220·7, 399·1) v. AC/CC 345·5 (95 % CI 283·7, 407·4) pmol/l; P = 0·84), insulin iAUC (AA 10 234·5 (95 % CI 6720·2, 13 748·8) v. AC/CC 10 842·9 (95 % CI 6558·2, 15 127·7) pmol/l × 120 min; P = 0·80) and ΔiAUC for insulin did not differ between ‘fast metaboliser’ or ‘slow metaboliser’ genotype, respectively (2680·3 (95 % CI 423·0, 4937·6) v. 2047·8 (95 % CI –3447·06, 7542·6) pmol/l × 120 min; P = 0·75).
Discussion
The present study demonstrates that one night of hourly sleep fragmentation had no effect on next-day insulin sensitivity or glucose tolerance, relative to a habitual night of sleep, in young, healthy men and women. However, consumption of caffeinated coffee after sleep fragmentation increased glucose iAUC by approximately 50 %.
A recent survey found that approximately 40 % of people in the UK drink caffeinated coffee upon waking, and therefore the coffee condition in the present study provided an important ecological comparison with the sleep fragmentation alone condition(8). Previous studies have demonstrated acute reductions in glucose tolerance when caffeinated coffee is ingested prior to assessment of glucose metabolism(Reference Moisey, Robinson and Graham10). In the present study, glucose iAUC was approximately 50 % greater following caffeinated coffee relative to sleep fragmentation alone; this agrees with the other study to have investigated the combination of caffeinated coffee and sleep disruption(Reference Rasaei, Abd Talib and Ismail Noor16), albeit in the reverse order (i.e. caffeine before v. after sleep) and in relation to overall sleep deprivation (i.e. lower total duration) rather than the fragmentation reported here. Indeed, in that previous study, there was no habitual sleep control condition and the caffeinated coffee was ingested during the sleep deprivation period; the present study therefore extends those findings by isolating the independent effects of sleep deprivation and caffeinated coffee, with the latter consumed following, rather than prior to sleep disruption.
Whilst not investigated in the present study, there are several potential mechanisms following caffeinated coffee ingestion that may explain the reduction in glucose tolerance. Primarily, within a circulating range of 25–40 mmol/l, caffeine acts as an antagonist for adenosine receptors, particularly in skeletal muscle where caffeine may inhibit glucose uptake via A1 adenosine receptor antagonism(Reference Thong and Graham25–Reference Vergauwen, Hespel and Richter27). Additionally, caffeine ingestion is a stimulant for the release of adrenaline, which suppresses the action of insulin through β-adrenergic receptor activation(Reference Avogaro, Toffolo and Valerio28–Reference Deibert and DeFronzo30). It is also worth considering the lipolytic effects of caffeine ingestion on glucose uptake into skeletal muscle. The dose of caffeine provided in the present study is probably sufficient to induce lipolysis prior to the OGTT, subsequently impairing glucose uptake into the muscle(Reference Kovacs, Stegen and Brouns31,Reference Gonzalez32) . Finally, the role of cortisol in disruption of glucose metabolism must also be considered. Specifically, cortisol is elevated following both caffeine ingestion(Reference Lovallo, Whitsett and al’Absi33) and sleep disruption(Reference Stamatakis and Punjabi3), which elevates postprandial glucose responses(Reference De Feo, Perriello and Torlone34).
The rate of caffeine metabolism is affected by the rs762551 SNP in the CYP1A2 gene, with individuals classed as either fast (AA) or slow (AC/CC) metabolisers(Reference Yang, Palmer and de Wit35). Recent evidence suggests that postprandial glycaemic and insulinaemic responses to both chronic and acute caffeine ingestion are modulated by this polymorphism(Reference Robertson, Clifford and Penson14). Despite observing the expected distribution of the rs762551 SNP, no difference in the insulinaemic or glycaemic response to the glucose load was found between genotype following caffeinated coffee ingestion. While this may suggest that the modulating effect of the rs762551 SNP was not present, this analysis was included on an exploratory basis and thus the study was not directly powered to detect differences between ‘fast’ and ‘slow’ metabolisers. Future work should therefore investigate the acute effect of this SNP on the response to coffee both after a night of disrupted v. habitual sleep in a larger sample.
The present study observed no difference in insulin sensitivity or glucose tolerance following sleep fragmentation relative to a habitual night of sleep. This is interesting considering that previous work has shown even a single night of sleep restriction is sufficient to induce reductions in both peripheral and hepatic insulin sensitivity relative to a habitual night of sleep(Reference Donga, van Dijk and Gert van Dijk2). In similar fashion to Gonnissen et al. (Reference Gonnissen, Hursel and Rutters6), the present study observed one time point at which postprandial plasma insulin concentration was lower following Fragmented v. Control, which in the former was speculated to be due to a difference in night-time glycogen use from waking. However, this cannot be directly concluded from one time point alone. Speculatively, lack of postprandial differences in the present and previous study(Reference Gonnissen, Hursel and Rutters6) may be explained by the total magnitude of sleep disruption achieved through hourly sleep fragmentation. In the present study, wake time was approximately 70–80 min total. Comparatively, Donga et al. (Reference Donga, van Dijk and Gert van Dijk2) employed a broken sleep protocol (i.e. sleep time 23.00–01.00 and 05.00–07.30 hours) in healthy lean subjects, observing an approximately 22 % increase in endogenous glucose production alongside an approximately 20 % decrease in the rate of glucose disposal, indicative of reduced hepatic and peripheral insulin sensitivity, respectively. Similarly, two nights of sleep reduction (approximately 50 % of habitual sleep duration: 442 (sd 78) v. 235 (sd 34) min) also reduced Matsuda insulin sensitivity index by approximately 19 % relative to habitual sleep(Reference Sweeney, Jeromson and Hamilton4). The total duration of sleep loss accumulated over one or more nights may therefore be proportionate to the effect on postprandial glycaemia. Speculatively, this could be explained by lesser disruption of slow-wave sleep (that is, stage III of non-rapid eye movement sleep) with the current protocol compared with previous studies. As slow-wave sleep is thought to be the most important mediator of metabolic, hormonal and neurophysiological changes during sleep, studies observing greater reductions in insulin sensitivity are likely to have done so through employment of sleep disruption protocols that provide a greater degree of disruption to slow-wave sleep(Reference Donga, van Dijk and Gert van Dijk2,Reference Sweeney, Jeromson and Hamilton4,Reference Tasali, Leproult and Ehrmann36) . Conversely in the present study, participants were roused from sleep every hour, which based on the average length of each stage of sleep (approximately 5–15 min) and one sleep cycle (approximately 90–110 min) would potentially not provide as much slow-wave sleep disruption as previous literature(Reference Roebuck, Monasterio and Gederi37).
Whilst the dose of caffeine ingested in the present study is above that typically consumed in one cup of coffee on a daily basis (approximately 100–200 mg)(Reference Desbrow, Hughes and Leveritt38,Reference Ludwig, Clifford and Lean39) , studies employing lower doses (approximately 60 mg) have observed disrupted glucose control(Reference Moisey, Robinson and Graham10). Despite this, a strength of the present study is the perhaps more ecologically valid model of consumption following one night of sleep curtailment relative to previous research(Reference Rasaei, Abd Talib and Ismail Noor16). Furthermore, the effects shown in this study are present in a relatively large sample size for an acute study of this nature. One potential limiting factor in the interpretation of the present results is the apparent order effect whereby mean plasma iAUC was higher in participants first trial compared with both the second and third trials (197 (173–221) v. 148 (126–169) v. 132 (106–158) mmol/l, respectively). However, repeated-measures ANOVA revealed no interaction effect between which trial participants performed first and the effect of Coffee on postprandial glycaemia relative to Fragmented and habitual sleep. Simply put, the higher responses in the Fragmented + Coffee condition were not due to the participants who performed the Fragmented + Coffee trial first. Furthermore, the addition of a fourth condition (i.e. habitual sleep + coffee) to the study would have provided an interesting comparison to fully assess the independent effects of caffeinated coffee relative to sleep disruption. The lack of assessment of hormones potentially linked to the mechanism of disruption (e.g. cortisol) also limits further discussion surrounding the effects reported. Finally, the present study also did not strictly control for the menstrual phase in female participants, and this may have influenced our primary outcomes(Reference Valdes and Elkind-Hirsch40).
In summary, no effect of hourly fragmented sleep (totalling < 80 min) was found on postprandial glucose and insulin responses to breakfast the next morning. However, the common approach of consuming a strong caffeinated coffee following disrupted sleep resulted in a reduction in glucose tolerance. Following a night of disrupted sleep, individuals should balance the potential stimulating benefits of caffeinated coffee consumption with the potential to increase postprandial glucose excursions.
Acknowledgements
The authors thank the participants of this study for volunteering their time and effort. Further thanks are to be given to the 2018/2019 cohort enrolled in the HL30054 Nutrition and Metabolism unit for their assistance with data collection.
Author contributions were: H. A. S.: design, data collection, analysis and write up. A. H.: data collection, analysis and write up. J. T.: data collection and write up. J.-P. W.: analysis and write up. P. H.: data collection and write up. O. P.: data collection and write up. Y.-C. C.: data collection and write up. J. T. G.: design, data collection and write up. J. A. B.: design, data collection, analysis and write up.
This research project did not receive any direct funding. J. T. G. has received financial support from, has received research funding, and/or has acted as a consultant for Arla Foods Ingredients, Lucozade Ribena Suntory, Kenniscentrum Suiker and Voeding, and PepsiCo. J. A. B. has received financial support from, has received research funding, and/or has acted as a consultant for GlaxoSmithKline, Lucozade Ribena Suntory, J. T. G. has received research funding from Arla Foods Ingredients, Lucozade Ribena Suntory, Kenniscentrum Suiker and Voeding, and PepsiCo. J. A. B. has received research funding from BBSRC, GlaxoSmithKline, Nestlé, Lucozade Ribena Suntory, Kellogg’s, PepsiCo and the Rare Disease Foundation.


