


Fluoride is mainly associated with calcified tissues in the body( Reference Whitford 1 ). It stimulates bone cell proliferation and increases new mineral deposition in cancellous bone( Reference Palmer and Wolfe 2 ). Topical fluoride when applied to erupted teeth, for example through water fluoridation and tooth-brushing with a fluoridated dentifrice, can help reduce dental caries by almost 50 % and is therefore a valuable public health measure to improve oral health( Reference Palmer and Wolfe 2 ). Dental decay in primary and permanent teeth of children continues to be a major public health problem, with un-treated decay being the most common disease affecting humans worldwide( Reference Frencken, Sharma and Stenhouse 3 ). Decay experience is higher in lower socio-economic groups: 83·4 % of 5-year-olds in lower-middle income countries have tooth decay compared with 49 % of 5-year-olds in higher-income countries( Reference Frencken, Sharma and Stenhouse 3 ). This high prevalence of decay highlights the importance of primary fluoride-based prevention programmes, including fluoridated water, salt and milk. However, several studies( Reference Szpunar and Burt 4 , Reference Pendrys and Stamm 5 ) have shown increased prevalence of dental fluorosis (mainly mild) in both fluoridated and non-fluoridated communities as a result of excessive systemic exposure to fluoride from multiple sources. Dental fluorosis is visible clinically as a white or brown ‘mottling’ of the tooth surface. The critical period for development of fluorosis in developing primary teeth is from 4 months in utero until 11 months of age( Reference Warren, Levy and Kanellis 6 ). Nonetheless, dental fluorosis in permanent maxillary central incisors is most likely to result from excessive fluoride exposure during the first 4 years of life, with the first 12 months being the most vulnerable period( Reference Hong, Levy and Broffitt 7 ).
In children, the tolerable upper intake level (UL) of 0·1 mg/kg body weight (BW) per d has been suggested to minimise the risk of dental fluorosis( 8 , 9 ). Therefore, total daily fluoride intake (TDFI) at both individual and community levels should be considered when setting guidelines for fluoride use to maximise decay prevention and minimise dental fluorosis. Milk (breast milk or formula milk) is the main source of fluoride intake in infants aged <6 months old. However, introducing complementary feeding (i.e. weaning) and tooth-brushing, which usually starts at about 6 months of age, could have a marked impact on TDFI( Reference Zohoori, Whaley and Moynihan 10 ).
Several factors such as diet composition, age and body size could alter the rate of fluoride ingestion, absorption and retention( Reference Whitford 1 , Reference Maguire and Zohoori 11 ). Therefore, it is important to quantify the body-retained fluoride rather than only the absolute TDFI.
Knowledge about body fluoride retention originates from studies of healthy adults or laboratory animals, despite the first year of human life being the critical period for dental development and the risk of dental fluorosis. This is mainly because of the practical difficulties in recording dietary fluoride intake and collecting 24-h urine and faeces samples from infants and young children to estimate TDFI, total daily fluoride excretion (TDFE) and, consequently, body fluoride retention. Therefore, this study aimed to measure TDFI, TDFE and total daily fluoride retention (TDFR) in infants up to 12 months of age living in fluoridated and non-fluoridated water areas at pre- (<6 months old) and post-weaning (6–12 months old) stages of development.
Methods
This study was conducted according to the guidelines laid down in the Declaration of Helsinki, and all procedures involving human subjects/patients were approved by the School of Health and Social Care, Teesside University (#079/13), and the Faculty of Medical Sciences, Newcastle University (#00673/2013). Written informed consent was obtained from parental participants.
This observational study focused on parents of infants, aged 1–12 months, living in fluoridated and non-fluoridated water areas of North East England. The parents were recruited between January 2014 and February 2016 through major universities, nurseries and ‘baby-group-centres’ in the selected areas. The participants were visited at their homes when weights of infants were measured, using a calibrated digital baby scale (Learning Curve Brands Inc.), and samples/data were collected. The infants were included if they were healthy, had lived continuously in the selected areas and were fed exclusively either breast milk or formula milk.
Estimation of total daily fluoride intake
A food diary was given to each parent with instructions on how to complete it on three consecutive days for their infant. Each parent was interviewed on the 4th day to ensure that all food/drink items consumed by their infant had been recorded. Samples of breast and/or formula milk, consumed by all infants, as well as samples of all home-made food and drink consumed by weaned infants during the 3-d dietary assessment, were collected for fluoride analysis. Information on fluoride concentration in commercially available baby food/drinks was taken from an existing fluoride database( Reference Zohoori and Maguire 12 ). Dietary fluoride intake (µg/d) for each infant was estimated by multiplying the average intake of each item (g/d) by its fluoride concentration (µg/g). In breast-fed infants, consumption of breast milk was quantified from reported energy requirements, by age and sex( Reference Butte 13 ), and the average energetic density of human milk of 651 kcal/l (2724 kJ/l)( 14 ).
A parental oral hygiene questionnaire with interview was used to obtain information on the infant’s tooth-brushing habits, and the frequency of cleaning/brushing, type and amount of any dentifrice used were recorded. The amount of fluoride ingested through brushing was estimated from the weight and frequency of dentifrice use, assuming that almost all dentifrice used in brushing is swallowed by an infant at this age.
No infant used fluoride supplements; therefore, the TDFI for each infant was calculated by combining fluoride intake from diet and dentifrice use.
Estimation of total daily fluoride excretion
Parents were supplied with specially designed pads (Uricol; Sterisets) for use inside the child’s diaper (nappy)( Reference Zohouri, Swinbank and Maguire 15 ) and instructed on how to collect and store wet (urine) and/or soiled/wet (urine and faeces) pads/diapers over 48 h. For wet pads/diapers, parents were asked to withdraw a 5-ml urine sample from the pad, using the plastic syringe provided, and transfer the sample to a labelled container. The collected samples were weighed to measure the weight of urine and/or faeces excreted. The faeces were removed from the pads using a disposable wooden spatula, transferred into a labelled bag and stored at –20°C before fluoride analysis.
To quantify the fluoride content of each individual excrement (mg/sample), its measured fluoride concentration (µg/g) was multiplied by the corresponding weight of excreta (i.e. either urine or combined urine and faeces; g). The TDFE for each infant was then computed by summing the calculated fluoride content of individual excreta.
Fluoride analysis
Sample analyses were conducted from February 2016 to December 2017. Fluoride concentrations in home-prepared food and milk samples consumed by infants and in excreted faeces were measured by the acid-diffusion method, with fluoride assay of urine, non-milk-based drink and water samples undertaken using a direct method with fluoride-ion-selective electrode (Model 9409; Orion) and meter (Model 900A; Orion) after addition of TISAB-III (total ionic strength adjustment buffer), with the sample–TISAB ratio of 10:1 (v/v)( Reference Martínez-Mier, Cury and Heilman 16 ).
Analytical quality control (AQC) was undertaken by (i) conducting incurred sample re-analysis (ISR) and (ii) using a certified reference material (CRM). ISR( Reference Thway, Eschenberg and Calamba 17 ) was performed by re-analysing 5 % of samples in separate runs on different days from when the analysis was performed. The percentage difference between the results was determined using the following formula: ((repeat–original)/mean)×100( Reference Thway, Eschenberg and Calamba 17 ). In addition, a paired t test was used to test for the difference between the original and the re-analysed (repeat) data. A certified reference ‘urine fluoride’ sample (#PC-U-F1703; Institut National de Santé Publique du Québec) was used as the CRM and tested blind by the study technician.
Data analysis
TDFR (mg/d) was calculated by subtracting TDFE (mg/d) from TDFI (mg/d) for each infant, and the relevant variables were normalised by BW (mg/kg BW per d). Fractional fluoride retention (FFR) was estimated as the ratio between TDFR and TDFI.
Statistical analysis
Sample size
A power analysis was undertaken using R to estimate appropriate sample size based on results from a previous study of TDFI by Zohoori et al. ( Reference Zohoori, Whaley and Moynihan 10 ), which used nineteen infants per group. It was estimated that 3·9 individuals per group would be needed for 80 % power.
ANOVA was used to evaluate the effects of weaning stage (pre- v. post-weaning), area of residency (fluoridated v. non-fluoridated) and type of feeding (breast milk v. formula milk) on TDFI, TDFE and TDFR. Initially, the area of residency, weaning stage and type of feeding were used as predictors, plus all interaction terms; non-significant interaction terms were sequentially removed, along with main effects where necessary, until the best minimal model was identified. Mean and 95 % CI of the differences were calculated for the terms in the minimal model. Effect sizes were calculated as η 2 ( Reference Cumming 18 ), which are more useful than the more widely used measure of Cohen’s d in an ANOVA design such as our experiment, where feasibility of recruitment to the study was a limiting factor. η 2 can be interpreted as the proportion of total variability in the response variable that can be accounted by the explanatory variable( Reference Lakens 19 ). Cohen( Reference Cohen 20 ) provided approximate η 2 benchmarks for ‘small’ (0·01), ‘medium’ (0·06) and ‘large’ (0·14 or greater) effect sizes. As the effect size is basically a way of quantifying the absolute size of the difference between two groups, the larger the effect size, the more reliable the difference. A result is more likely to be biologically meaningful if it is both statistically significant and has a large effect size.
Long-term relationships between age (predictor) and the response variables (i) TDFI, (ii) TDFE and (iii) TDFR were evaluated with the aid of standard linear regressions and Pearson’s correlation coefficients.
Results
Initially, seventy-seven parents expressed interest to participate in the study, of whom twenty-eight subsequently did not sign the consent form owing to the extent of the required commitment from them (e.g. collection of urine/faeces samples). Two infants were excluded, as they were receiving combined feeding (breast and formula).
The majority (64 %) of infants were male. Table 1 presents mean (sd) age and weight of the forty-seven infants, who completed the study, per group. The study managed to recruit more than four infants per group for all but two exposure combinations: un-weaned breast-fed infants living in a non-fluoridated area (n 2) and weaned formula-fed infants living in a non-fluoridated area (n 3). The overall mean age and weight of the sixteen un-weaned infants were 3·4 (sd 1·1) months and 6·3 (sd 1·1) kg, respectively, and of the thirty-one weaned infants the mean age and weight were 10·0 (sd 1·2) months and 8·9 (sd 0·8) kg, respectively.
Table 1 Infant data stratified by weaning stage, type of feeding and area of residency (Mean values and standard deviations)
FA, fluoridated area (fluoride concentration of tap water: 0·86 (sd 0·23) mg/l); NFA, non-fluoridated area (fluoride concentration of tap water: 0·12 (sd 0·09) mg/l).
In total, 416 wet (urine) and 245 soiled/wet (urine and faeces) diapers were collected from all infants; that is on average seven diapers/d per child. In addition, 124 breast milk samples and 138 water samples, as well as ninety-four food diaries, were collected.
Regarding the AQC, the mean ISR was 11 (sd 9) %, well below the recommended ISR acceptance criteria (within 20 % for small molecules and 30 % for macromolecules)( Reference Thway, Eschenberg and Calamba 17 ). There was no statistically significant difference in fluoride concentration between original and repeat analyses (mean difference: 0·011 mg/l; 95 % CI –0·019, 0·041 mg/l). The measured fluoride concentrations of the original and repeat CRM samples were 0·232 and 0·235 mg/l, respectively, which were within the acceptable range (certified target value: 0·283 mg/l; and acceptable range: 0·182–0·384 mg/l).
Fig. 1 shows weight-normalised TDFI, TDFE and TDFR for all infants by weaning stage, type of feeding and area of residency. The mean TDFI of all infants was <0·1 mg/kg BW per d. TDFR was negative in the breast-fed infants living in fluoridated (–0·005 mg/kg BW per d) and non-fluoridated (–0·003 mg/kg BW per d) areas, as well as in the un-weaned formula-fed infants living in the non-fluoridated area (–0·007 mg/kg BW per d), whereas the highest mean TDFR (0·061 mg/kg BW per d) was observed in the weaned formula-fed infants living in the fluoridated area. The best linear models (Table 2) indicated that TDFI was significantly higher in fluoridated areas (P<0·001), in formula-fed infants (P<0·001) and post weaning (P=0·002). There was also a strong interaction between the area of residency and type of feeding, with TDFI being significantly higher (P<0·001) where infants were both formula-fed and residing in fluoridated areas. However, the observed small, medium and large effect sizes for area of residency (η 2=0·001), weaning stage (η 2=0·068) and type of feeding (η 2=0·308), respectively, clearly imply that type of feeding was the main factor affecting TDFI, whereas weaning stage was the second most important factor.
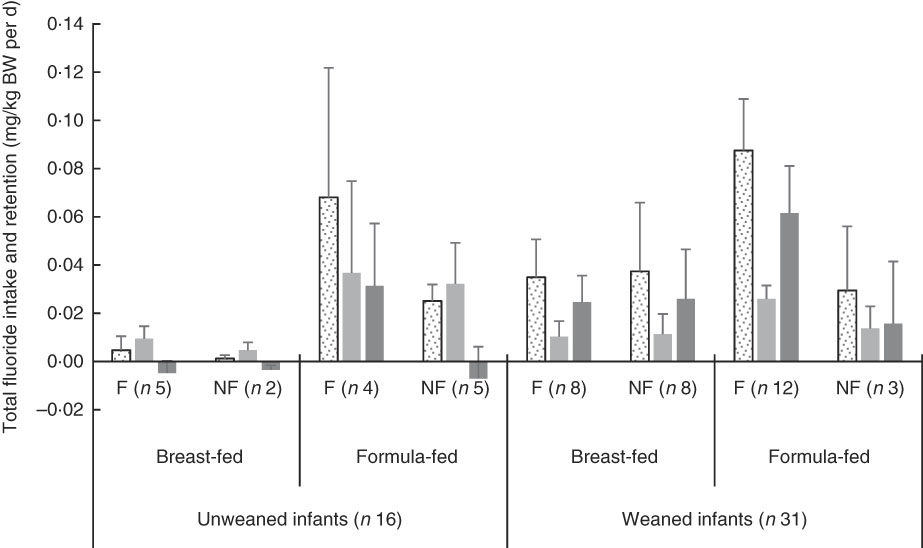
Fig. 1 Total fluoride intake, excretion and retention (mg/kg body weight (BW) per d) stratified by weaning stage (pre- v. post-weaning), type of feeding (breast- v. formula-milk) and area of residency (fluoridated (F) v. non-fluoridated (NF)) in infants younger than 12 months. Fluoridated area (0·86 parts per million (ppm) fluoride); non-fluoridated area (0·12 ppm fluoride); unweaned infants (<6 months old); weaned infants (6–12 months old). ![]() , Total daily fluoride intake (mg/kg BW per d);
, Total daily fluoride intake (mg/kg BW per d); ![]() , total daily fluoride excretion (mg/kg BW per d);
, total daily fluoride excretion (mg/kg BW per d);
![]() , total daily fluoride retention (mg/kg BW per d). Values are means, with 95% confidence intervals represented by vertical bars.
, total daily fluoride retention (mg/kg BW per d). Values are means, with 95% confidence intervals represented by vertical bars.
Table 2 Summary of results of best sequential linear model, with weight-normalised total daily fluoride intake, excretion and retention (as the response)* (Mean values and 95 % confidence intervals)
NFA, non-fluoridated area (fluoride concentration of tap water: 0·12 (sd 0·09) mg/l); FA, fluoridated area (fluoride concentration of tap water: 0·86 (sd 0·23) mg/l); FF, formula-fed; BF, breast-fed.
* The non-significant variables are not presented in the table.
TDFE was significantly (P<0·001) lower in breast-fed compared with formula-fed infants (with a large effect size; η 2=0·145), and there was an interaction between weaning stage and type of feeding, with TDFE being significantly (P<0·001) lower in un-weaned breast-fed infants. As the area of residency had no effect on TDFE, either as a main effect or any interaction term, it was omitted from the final model.
TDFR was significantly higher in fluoridated areas (P<0·001) and in weaned infants (P<0·001) but lower in breast-fed infants (P=0·001). There was a significant interaction between area of residency and type of feeding (P<0·001), with TDFR being lower than would otherwise be expected, where infants were breast-fed and lived in non-fluoridated areas. The large effect sizes detected for both weaning stage (η 2=0·168) and type of feeding (η 2=0·210) denote the significance of these two factors in TDFR.
Mean body-retained fluoride as a percentage of TDFI (i.e. FFR) for all infants is shown in Fig. 2. At pre-weaning, the FFR was only positive in formula-fed infants living in the fluoridated area. The overall mean FFR for all thirty-one infants, at the post-weaning stage, was 65 (se 3) %.
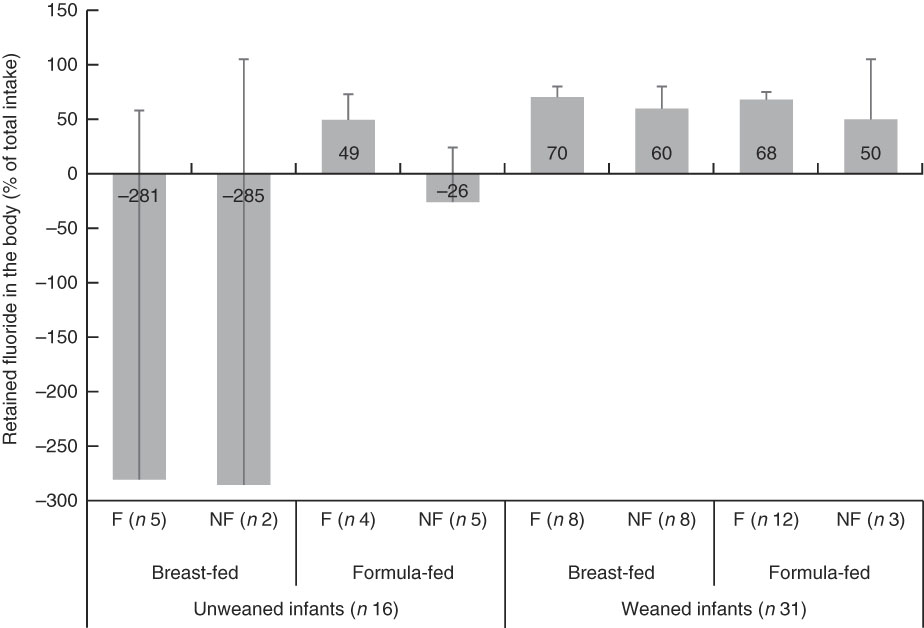
Fig. 2 Retained fluoride in the body as a percentage of total fluoride intake (fractional fluoride retention), stratified by weaning stage (pre- v. post-weaning), type of feeding (breast- v. formula-milk) and area of residency (fluoridated (F) v. non-fluoridated (NF)) in infants younger than 12 months old. Fluoridated area (0·86 parts per million (ppm) fluoride); non-fluoridated area (0·12 ppm fluoride); unweaned infants (<6 months old); weaned infants (6–12 months old). Values are means, with 95% confidence intervals represented by vertical bars.
The linear relationships between age and weight-normalised TDFI, TDFE and TDFR for breast-fed infants and formula-fed infants are presented in Fig. 3 and 4, respectively. In breast-fed infants (Fig. 3), the statistically significant positive correlation between age and TDFI (mg/kg BW per d) was moderate (ρ=0·51, P=0·012), but it was strong (ρ=0·63, P=0·001) between age and TDFR. In formula-fed infants (Fig. 4), there was a statistically significant positive moderate correlation between age and TDFI (ρ=0·41, P=0·044), as well as between age and TDFR (ρ=0·56, P=0·004).
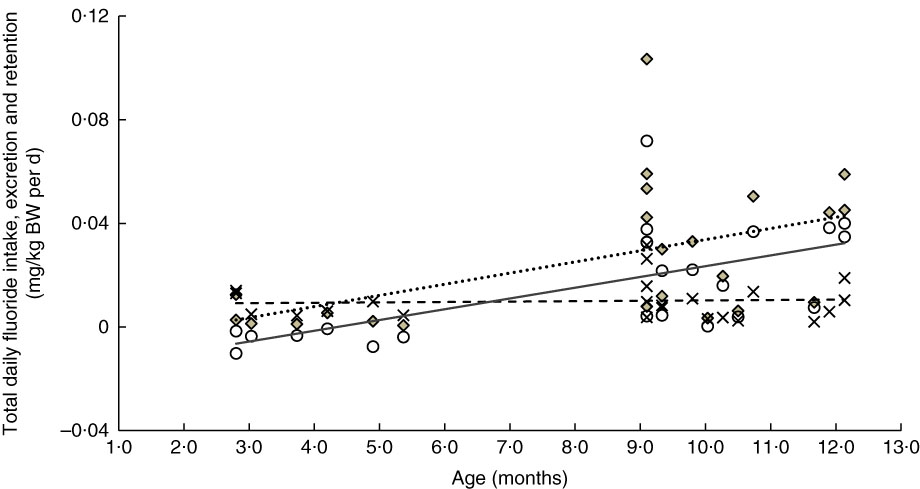
Fig. 3 Relationship between age- and weight-normalised – (i) total daily fluoride intake (TDFI), (ii) total daily fluoride excretion (TDFE) and (iii) total daily fluoride retention (TDFR) in breast-fed infants (n 23). TDFI (
![]() ,
,
![]() , mg/kg body weight (BW) per d)=–0·009+0·004 (age (months)) (ρ=0·51, P=0·012), TDFE (
, mg/kg body weight (BW) per d)=–0·009+0·004 (age (months)) (ρ=0·51, P=0·012), TDFE (
![]() ,
,
![]() , mg/kg BW per d)=0·009+0 (age (months)) (ρ=0·06, P=0·774) and TDFR (
, mg/kg BW per d)=0·009+0 (age (months)) (ρ=0·06, P=0·774) and TDFR (
![]() ,
,
![]() , mg/kg BW per d)=–0·018+0·004 (age (months)) (ρ=0·63, P=0·001).
, mg/kg BW per d)=–0·018+0·004 (age (months)) (ρ=0·63, P=0·001).
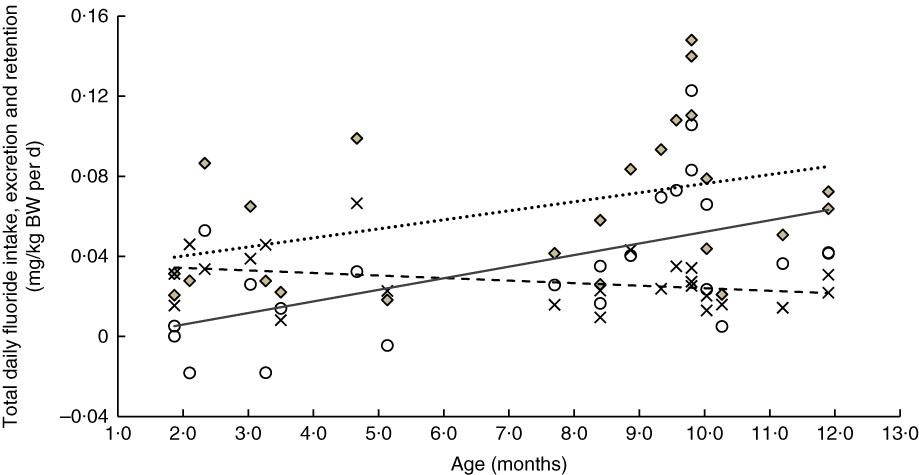
Fig. 4 Relationship between age- and weight-normalised (i) total daily fluoride intake (TDFI), (ii) total daily fluoride excretion (TDFE) and (iii) total daily fluoride retention (TDFR) in formula-fed infants (n 24). TDFI (
![]() ,
,
![]() , mg/kg body weight (BW) per d)=–0·031+0·005 (age (months)) (ρ=0·41, P=0·044), TDFE (
, mg/kg body weight (BW) per d)=–0·031+0·005 (age (months)) (ρ=0·41, P=0·044), TDFE (
![]() ,
,
![]() , mg/kg BW per d)=0·037–0·001 (age (months)) (ρ=–0·32, P=0·122), TDFR (
, mg/kg BW per d)=0·037–0·001 (age (months)) (ρ=–0·32, P=0·122), TDFR (
![]() ,
,
![]() , mg/kg BW per d)=–0·006+0·006 (age (months)) (ρ=0·56, P=0·004).
, mg/kg BW per d)=–0·006+0·006 (age (months)) (ρ=0·56, P=0·004).
Discussion
Clinically, the affinity of fluoride for bone and teeth is high, and fluoroapatite crystals that form at the surface of bone or enamel are important for tooth enamel hardness and bone mineral matrix stability( Reference Bergman, Gray-Scott and Chen 21 ). Uptake of fluoride during the pre-eruptive stage of enamel formation is dentally important owing to the increased risk of dental fluorosis development if systemic ingestion of fluoride is chronically excessive in early infancy. Therefore, for fluoridation policy decision-making and informing caries prevention programmes, continued assessment of total fluoride exposure in young children has been recommended( 22 , 23 ).
The mean TDFI of all infants, in the present study, was below the UL of 0·1 mg/kg BW per d( 8 , 9 ). Moreover, the present study showed that, in infants, the TDFI was overwhelmingly affected by type of feeding, whereas the effects of weaning stage and area of residency were moderate (see interaction terms in Table 2). At the pre-weaning stage, milk (either breast milk or formula milk) was the sole source of fluoride intake for these infants. The mean TDFI of infants <6 months old exclusively breast-fed and living in both fluoridated and non-fluoridated areas was almost negligible (Fig. 1; 0·005 and 0·001 mg/kg BW per d, respectively). Generally, the fluoride concentration of breast milk is very low (<0·02 µg/ml), with no significant difference in breast-milk fluoride concentration found between mothers living in fluoridated and non-fluoridated areas( Reference Spak, Hardell and De Chateau 24 ), owing to the limited transfer of fluoride from plasma to breast milk( Reference Ekstrand, Boreus and de Chateau 25 ). Breast-fed infants typically receive up to a maximum ‘dose’ of 0·2 % of the maternal fluoride intake( Reference Ekstrand, Spak and Falch 26 ). A considerable difference in fluoride intake between exclusively breast-fed and formula-fed infants has also been reported for US infants aged 2–6 months living in a fluoridated area with 1 mg fluoride/l in drinking water: 0·001 mg/kg BW per d in the three breast-fed v. 0·141 mg/kg BW per d in the five formula-fed infants( Reference Ekstrand, Hardell and Spak 27 ).
A significant increase in the weight-corrected TDFI with increasing age was observed in both breast-fed (Fig. 3) and formula-fed (Fig. 4) infants. This increase is likely to be due to introduction of weaning food/drinks containing fluoride and post-weaning fluoridated dentifrice use (i.e. in 6–12 month-olds). A positive trend between TDFI and age has also been reported for infants aged 1–12 months, living in non-fluoridated areas in England( Reference Zohoori, Whaley and Moynihan 10 ). However, an inverse relationship between age and TDFI has been reported for 1–12 month-old English infants( Reference Zohoori, Whaley and Moynihan 10 ) living in a fluoridated area (0·97 mg fluoride/l) and US (Iowa)( Reference Levy, Warren and Davis 28 ) infants living in areas with fluoride water concentrations of <0·3–2·0 mg/l. The between-studies differences in the age–TDFI relationship could be due to differences in age, feeding pattern and oral hygiene habits of the studied infants. For example, in the UK study( Reference Zohoori, Whaley and Moynihan 10 ), more than 70 % of infants were younger than 6 months, with 10 % being exclusively breast-fed, compared with 34 and 15 %, respectively, in the present study.
Despite the significant increase in TDFI with age, the TDFE remained almost constant with increasing age (Fig. 3 and 4). This finding can be explained by the low renal function found in infancy, even when the appropriate correction is made for the small body size( Reference Barnett 29 ). After birth, maturation is still a process involving all organs including the kidneys. Effective renal plasma flow increases from 83 ml/min per 1·73 m2 in full-term infants to an adult rate of 650 ml/min per 1·73 m2 at approximately 2 years of age and glomerular filtration rate increases from 40 ml/min per 1·73 m2 at birth to normal adult values of 100–125 ml/min per 1·73 m2 by 2 years of age( Reference Sulemanji and Vakili 30 ). Consequently, infants and toddlers have limited capacity for metabolism and elimination of different drugs and elements such as fluoride from the body, as their renal function only reaches full capacity by the age of 2 years.
The TDFE was largely influenced by type of feeding, with significantly lower TDFE in the breast-fed compared with formula-fed infants (Fig. 1). However, the effect of type of feeding on TDFE was moderated by the weaning stage (Table 2). Although lower TDFE in the breast-fed infants could be explained largely by their lower TDFI, as observed in the study, differences in the degree of fluoride absorption between breast- and formula-fed infants should also be considered. The systemic bioavailability of fluoride from different sources is influenced by the presence or absence of other nutrients; for example, Al, Ca, Mg and chloride increase faecal fluoride excretion, whereas dietary fats improve fluoride absorption( Reference Whitford 1 ). Breast milk contains more fat but fewer minerals than infant formula; therefore, faecal fluoride excretion (and consequently TDFR) would be expected to be lower in breast-fed infants.
The TDFR was largely influenced by weaning stage and type of feeding (Table 2). In un-weaned infants (<6 month-olds), those breast-fed living in both fluoridated- and non-fluoridated areas, as well as those formula-fed living in the non-fluoridated area, had a negative fluoride retention (Fig. 2) indicating a negative fluoride balance (i.e. fluoride excretion>fluoride intake). A negative fluoride balance has also been reported for five 2–6 month-old breast-fed US infants living in a fluoridated area( Reference Ekstrand, Hardell and Spak 27 ). Fluoride balance in infants can depend on plasma fluoride concentration and the concurrent fluoride concentration in the rapidly exchangeable fluoride pool of bone; that is, a fall in plasma fluoride concentration results in a net migration of fluoride from bone to plasma and vice versa. Fluoride can cross the placenta and accumulate in fetal calcified tissues( Reference Shen and Taves 31 ). However, when fluoride intake of very young infants is lower than that needed to maintain the in utero plasma fluoride concentration (e.g. in breast-fed infants), mobilisation of fluoride from calcified tissues into plasma occurs, which results in fluoride excretion that exceeds the levels of fluoride intake (i.e. negative balance)( Reference Whitford 1 ). However, the study found (Fig. 2) no statistically significant differences in the proportion of TDFI, which was retained in the body of weaned infants (6–12 month-olds), indicating the effect of weaning (i.e. eating other sources of food other than just milk) on FFR. For example, the bioavailability of fluoride from infant milk formula reconstituted with water is 65 %, whereas a mixed diet may reduce absorption of fluoride by 47 %( Reference Ekstrand and Ehrnebo 32 , Reference Zohoori 33 ).
The mean FFR of 49 % (Fig. 2) for the 2–6 month-old formula-fed infants living in the fluoridated area was lower than the corresponding figure of 58 % calculated for 2–6 month-old formula-fed US infants living in a fluoridated area( Reference Ekstrand, Hardell and Spak 27 ). In addition, overall mean FFR in the thirty-one (65 %) infants aged 6–12 months was higher than the corresponding value of 50 % reported for six US infants aged 6–12 months living in a fluoridated area( Reference Ekstrand, Ziegler and Nelson 34 ) but in agreement with the 65 % reported for 212 children aged <7 years( Reference Villa, Anabalon and Zohouri 35 ).
Limitations
The possible limitations of this study are the sample size (though only in two of the eight sub-groups), convenience sampling strategy and non-equally sized subgroups. Despite the prolonged recruitment efforts, the poor recruitment rate was mainly due to the high burden of collecting detailed exposure data over 3 d, as well as samples of urine and faeces over 2 d from infants by parents. However, the number of infants in the present study (n 47) was substantially higher than those recruited in similar studies: ‘five breast-fed and five bottle-fed infants’ in a fluoride balance study( Reference Ekstrand, Hardell and Spak 27 ) and ‘two breast-fed and fifteen formula-fed infants (eleven females and six males)’ in a fluoride pharmacokinetic study( Reference Ekstrand, Fomon and Ziegler 36 ).
The main limitation of this study is that urine and faeces were not collected separately owing to ethical issues related to more invasive methods of urine and faeces collection, such as the use of metabolic beds, needed to separate collection of these types of samples( Reference Ekstrand, Fomon and Ziegler 36 ). Therefore, no conclusions can be drawn from this study about the effect of type of feeding (breast v. formula) on the degree of excretion of the ingested fluoride (i.e. faecal excretion) or the absorbed fluoride (i.e. urinary excretion).
Conclusion
The data showed that the type of feeding is the single most important factor in fluoride intake, exertion and retention in infants, although the area of residency also has smaller but significant impacts on fluoride intake and retention. The data have confirmed that fluoride intakes of exclusively breast-fed infants, irrespective of area of residency, as well as un-weaned formula-fed infants living in non-fluoridated areas, are so low that they result in a negative fluoride balance (i.e. mobilisation of fluoride from calcified tissues). However, in weaned infants, a relatively large proportion of fluoride intake is retained in the body (i.e. deposited in calcifying tissues). It is important that this is taken into consideration when implementing fluoride-based prevention programmes for young children. The goals for these interventions should be to maximise caries prevention while minimising dental fluorosis risk. Current evidence is that the main caries preventive effects of fluoride are due to its local topical effects at the tooth surface, whereas dental fluorosis results from chronic excessive systemic ingestion of fluoride from different sources during crucial periods of tooth development. In view of this, recommendations from the American Dental Association( Reference Berg, Gerweck and Hujoel 37 ) such as ‘continue breast-feeding throughout the first year of life’ and ‘use (infant) formula reconstituted with water that is either fluoride-free or has low concentrations of fluoride when the potential risk for enamel fluorosis is a concern’ remain key to harnessing the caries benefits of fluoride while minimising risk of fluorosis.
Acknowledgements
The authors thank the parents for their participation and cooperation.
The present study was funded by a grant from the Organix Foundation, gratefully acknowledged, which was disclosed to the study participants. The views expressed in this paper are those of the authors and not those of the funding body.
F. V. Z. conceptualised and designed the study, supervised data collection, drafted the initial manuscript and reviewed and revised the manuscript. N. O. collected data and samples, carried out the laboratory analyses of samples and reviewed the manuscript. R. A. S. coordinated data analysis and critically reviewed the manuscript for important intellectual content. R. A. V. co-supervised data collection and reviewed and revised the manuscript. A. M. conceptualised and designed the study, co-supervised data collection and reviewed and revised the manuscript. All authors approved the final manuscript as submitted and agree to be accountable for all aspects of the work.
The authors declare that there are no conflicts of interest.


