


Hypertension is recognised as a major cause of CVD, the leading contributor to the global burden of disease(1). Substantial mechanistic and epidemiological evidence links dietary salt intake to hypertension, and the WHO(1) has recommended reducing salt (Na) intake in whole populations through cost-effective public health interventions. In the UK, the Committee on Medical Aspects of Food and Nutrition Policy and latterly the Scientific Advisory Committee on Nutrition have advised that average salt intakes should be reduced to no more than 6 g/d(2, 3). In 2003, The UK Food Standards Agency (FSA) and the Department of Health in England committed to reducing salt intakes to this level and proposed that this could be attained via two general strategies. First, by a gradual reduction in the salt content of foods through engagement with the food industry on reformulation of industrially processed foods and, second, by increasing consumer awareness of the impact of salt on health via a public awareness campaign using a variety of media outlets to provide consumers with strategies to reduce their salt intake(3).
The UK salt reduction strategy has been hailed as a success in various quarters(Reference He and MacGregor4). The FSA's own analyses based on 24 h urinary Na excretion levels have suggested that the mean population salt intake, which was as high as 9·5 g/d in 2001, fell after the salt reduction campaign to 9 g/d by 2005/6(Reference Henderson, Irving and Gregory5, 6), to 8·6 g/d by 2008(7), and to latest estimates of 8·1 g/d in 2011(8). Independent econometric analysis of spot urinary Na levels taken between 2003 and 2007 supports a reduction in salt intake of the order of 10 %, attributable to the campaign(Reference Shankar, Brambila-Macias and Traill9). Furthermore, evaluations of consumer behaviour collected in national surveys have revealed increases in both public awareness of the salt campaign and the selection of processed food purchases based on their reported salt content(10, 11). Strong demographic and sex differences in these trends have been noted, with lower socio-economic groups and males demonstrating less awareness of the link between salt and health(12).
Previous evaluations of the national salt reduction campaign have tended to focus on overall salt intake, which can conflate the effect of the awareness campaign with the effects flowing from food reformulation, or on public awareness of the campaign. No previous study has assessed directly the effect of the campaign on the addition of salt at the table by consumers. Although the majority of salt intake is from processed foods, salt added at the table or during cooking remains a significant source, with an estimated 15–20 % of salt in the diet obtained from discretionary sources(3). This study uses large nationally representative samples of households in England to assess whether discretionary use of salt at the table was affected by the national salt reduction campaign.
Subjects and methods
Study design and participants
Data were obtained from repeated cross-sections of the Health Survey for England (HSE), an annual survey of a nationally representative sample of the general population living in households in England. The HSE utilises a multistage stratified probability sampling design with postcode sectors as the primary sampling unit and the Postcode Address File as the sampling frame for households(13–18). For the purpose of the present study, participants were adults over the age of 16 years in the general population sample of the HSE. Children under the age of 16 years were omitted from the analysis due to inconsistencies in the data on salt use. Ethical approval for each annual data collection cycle of the HSE was obtained from the London Multi-Centre Research Ethics Committee and from all Local Research Ethics Committees in England.
Variables and coding
The HSE has collected data on reported salt use in the general population in the years 1997, 1998, 2003, 2005, 2006 and 2007. Specifically, participants were asked to categorise their salt use at the table into one of four options: (1) ‘generally add salt to food without tasting it first’, (2) ‘taste the food, but then generally add salt’, (3) ‘taste the food, but only occasionally add salt’, or (4) ‘rarely, or never, add salt at the table’. In the primary analysis, salt use was coded as an ordered categorical variable with four levels of discretionary salt use. In further sensitivity analysis, salt use was coded as a binary variable combining the first two options into those who ‘generally add salt at the table’ and the second two options as those who ‘do not generally add salt at the table’.
The HSE questionnaires also provided information on demographic variables. Independent variables were selected and categorised as age (16–24, 25–64 or 65+ years), ethnic group (white or other), total annual income (low < £23 400, medium £23 400–£59 999 or high £60 000+) and region (north, midlands or south) using data on Government Office Regions. Independent variables were selected where evidence exists showing associations with salt consumption or dietary behaviour(Reference Shankar, Brambila-Macias and Traill9, 12).
Statistical analysis
The HSE datasets were obtained from the Economic and Social Data Service. Statistical analysis was conducted in Stata (version 11.0; Stata Corporation) using the ‘svy’ survey commands to allow for the complex sample design of the HSE. Sex-specific estimates of the percentage of adults generally adding salt were calculated and stratified by independent variables. Multivariable ordinal logistic regression was performed to assess whether the introduction of the salt campaign was associated with salt behaviour at the table, exploiting the ordered ranking to the salt behaviour variable. The salt campaign was included in the model as a binary variable with the years up to and including 2003 as pre-campaign, and the years 2005–7 as post-campaign. The model also included four socio-economic and demographic variables (age, ethnicity, income and region). Dummy variables for each year were also incorporated to control for possible unknown year-specific shocks or background trends that may have influenced salt use due to factors not otherwise captured in the model. As a sensitivity analysis, logistic regression was also performed, treating responses to the salt behaviour variable as binary. Effects were estimated as OR with 95 % CI.
Weighting
Weights were used in estimates to account for the HSE sampling design throughout the analysis where possible. As the HSE does not provide probability weights for years before 2003, all statistical analyses were conducted twice: once using all years between 1997 and 2007 but without incorporating weights, and once using the years 2003–7 only and incorporating weights. No weighting for selection bias was required as all adults in responding households were selected(19). When pooling datasets for all years, the individual weights were rescaled to allow for the fact that multiple survey samples were being combined. For this, the individual weights reported for each year were scaled by dividing them by the mean weight for that year, and then in order to account for unequal sample sizes used each year, the rescaled weights were multiplied by the proportion that each annual survey represented of the combined pooled sample(Reference Morris, Sutton and Gravelle20).
Results
In total, 67 980 individuals answered the HSE salt behaviour question between 1997 and 2007. There was a decrease in the survey response rate from 71 % in 1997 to 58 % in 2007, and the samples included in the more recent HSE surveys had greater mean age and were more likely to come from higher-income groups than those in the earlier surveys (Table 1).
Table 1 Characteristics of the participants aged 16 years and over from 1997 to 2007 in the Health Survey for England

The proportion of adults who generally added salt at the table (unweighted estimates) decreased from 40·1 % in 1997 to 31·7 % in 2007. This decline was apparent in both men and women, though a consistently lower percentage of women than men reported generally adding salt at the table across all years (Fig. 1). The trend was also present in the weighted estimates for the years 2003–7, which showed a decline in the percentage of adults who generally added salt at the table from 32·5 % in 2003 to 23·2 % in 2007 (Table 2). The decline in the percentage of adults adding salt at the table between 2003 and 2007 was present in both sexes and across all age and income groups, as well as in all regions and ethnic groups. However, differences in the proportions of adults adding salt at the table between subgroups were apparent. Compared with younger age groups, a greater proportion of adults aged over 65 years reported that they generally added salt at the table in all years except 2003. Compared with adults in the highest-income group, adults in the low-income group were consistently more likely to add salt at the table across all years. Adding salt at the table was most common in adults living in the north and least common in adults living in the south of England across all years. Finally, compared with other ethnic groups, white populations were more likely to add salt at the table across all survey years.
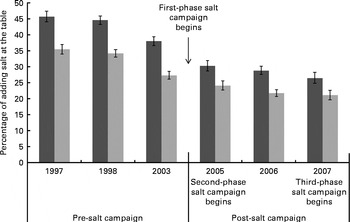
Fig. 1 Proportion of men (![]() ) and women (
) and women (![]() ) over 16 years who ‘generally add salt at the table’, 1997 to 2007. Values are percentages, with confidence intervals represented by vertical bars. Estimates shown are an weighted in order to display maximum years of the Health Survey for England data.
) over 16 years who ‘generally add salt at the table’, 1997 to 2007. Values are percentages, with confidence intervals represented by vertical bars. Estimates shown are an weighted in order to display maximum years of the Health Survey for England data.
Table 2 Percentage of adults who ‘generally add salt at the table’ by age, sex, region and income, from 2003 to 2007 (weighted estimates) (Percentages and 95 % confidence intervals)

After adjusting for age, sex, region, total annual income, ethnicity and year-specific shocks, ordinal logistic regression analysis revealed that the odds of adding salt at the table were significantly lower after the introduction of the national salt reduction campaign (OR 0·58; 95 % CI 0·54, 0·63; Table 3). In the adjusted model, women were less likely to add salt at the table than men (OR 0·71; 95 % CI 0·68, 0·74); adults living in central England (OR 0·90; 95 % CI 0·84, 0·98) and southern England (OR 0·82; 95 % CI 0·77, 0·88) were less likely to add salt at the table compared with adults living in northern England. The total annual household income was significantly associated with salt use at the table, with those in the higher-income group (OR 0·75; 95 % CI 0·69, 0·82) and medium-income group (OR 0·79; 95 % CI 0·75, 0·84) being less likely to add salt at the table compared with those in the low-income group. Adults in non-white ethnic groups were also less likely to add salt at the table compared with adults in the majority white ethnic group (OR 0·69; 95 % CI 0·62, 0·77). These results were not materially changed in sensitivity analysis using logistic regression (Table 4).
Table 3 Ordinal logistic regression analyses to identify independent predictors of salt behaviour* at the table, 2003–7 (weighted estimates) (Odds ratios and 95 % confidence intervals)

* Salt use was coded as an ordered categorical variable with four levels of discretionary salt use: (1) ‘generally add salt to food without tasting it first’, (2) ‘taste the food, but then generally add salt’, (3) ‘taste the food, but only occasionally add salt’, or (4) ‘rarely, or never, add salt at the table’.
† Adjusted for age, sex, region, total household income, ethnicity and year-specific shocks.
Table 4 Logistic regression analysis to identify independent predictors of salt behaviour* at the table, 2003–7 (weighted estimates) (Odds ratios and 95 % confidence intervals)

* Salt use was coded as a binary variable: those who ‘generally add salt at the table’ and those who ‘do not generally add salt at the table’.
† Adjusted for age, sex, region, total household income, ethnicity and year-specific shocks.
Discussion
The present study indicates that in England, over the period 1997–2007, there was a steady decline in salt use at the table, and importantly that the reduction in salt use at the table was significantly greater after the introduction of the FSA's salt reduction campaign in 2004. Salt use at the table accounts for 15–20 % of total salt intake, and this is the first time that the impact of the FSA salt reduction campaign on salt use at the table has been quantified. The present analysis also suggests that adding salt at the table was more common in males, those of white ethnicity, those living in the north of England and those from lower total household income groups.
Compared with other studies that have used small, single surveys(12, 21), the present study has several strengths, including the use of the large, nationally representative HSE datasets and the use of repeated cross-sectional surveys which facilitated the assessment of annual trends using consistent data collection methods across the years. Sensitivity analysis using binary rather than ordinal logistic regression did not substantially alter the present findings.
Limitations of the HSE datasets reduced the number of years that could be included for analysis and small sample sizes in specific years meant utilising broad subcategories, particularly when stratifying by ethnic group. Other study limitations included the subjective nature of self-reported salt use, a lack of validation of the HSE methods to monitor dietary behaviour(Reference Roberts22) and the unavailability of sample weights before 2003, which reduced the number of pre-campaign years included in the present analysis. The possible influence of unobserved variables on salt behaviour might also lead to uncertainty in attributing the reduction in salt use to the FSA's campaign. However, the inclusion of dummy variables (one for each year) in our model allowed us to estimate the change in salt use associated with the policy over and above trends due to unobserved influences, such as the apparent decrease in salt use at the table from 1997.
The present results are consistent with previous findings of a beneficial effect of the salt campaign on self-reported consumer behaviour(10, 11, 21, Reference Wyness, Butriss and Stanner23), and add to this evidence base by identifying actual changes in behaviour (salt use at the table) across different sociodemographic profiles. The present results confirm previous findings that highlight greater use of salt by males(12, Reference Millett, Laverty and Stylianou24), those in lower socio-economic groups(12, Reference Millett, Laverty and Stylianou24–Reference Purdy, Armstrong and McIlveen27) and those living in the north of England(Reference Shankar, Brambila-Macias and Traill9).
While the present analysis suggests a step change in salt use at the table after the introduction of the salt campaign in 2003, the observed trends (Fig. 1) suggest that the proportion of adults in England adding salt at the table remained fairly stable after 2005. Furthermore, in 2007, there remained approximately a quarter of all adults in England who add salt at the table, suggesting that continued efforts are needed in order to maintain the achieved salt reductions in the UK population.
The observed demographic differences in salt use indicate a need for future efforts to be tailored to specific target groups. It is particularly important for public health interventions that require behaviour change to be effective in reaching socially disadvantaged populations to avoid increasing already present disparities between socio-economic groups. Although there is some evidence to suggest that this is possible(Reference Michie, Jochelson and Markham26), a lack of research into the effectiveness of health promotion techniques in lower socio-economic status groups hampers the progress in the reduction of health inequalities(Reference Michie, Jochelson and Markham26). The prevalence of CVD increases with age and is higher in men than in women(Reference Scarborough, Bhatnagar and Wickramasinghe28), suggesting that future salt reduction strategies might usefully target men who currently report greater salt use at the table. The lower use of salt at the table in non-white ethnic groups may reflect previous findings of high salt use during cooking in these groups(Reference Millett, Laverty and Stylianou24, Reference Masango and Kohckhar29). With high rates of hypertension and previous research indicating a lack of awareness of government guidance on salt use in South Asian and African populations(Reference Millett, Laverty and Stylianou24, Reference Masango and Kohckhar29), future campaign efforts should also focus on limiting salt use in these populations(Reference Scarborough, Bhatnagar and Kaur30). Subsequent phases of the salt campaign, 2005, 2007 and 2009, warrant further analysis once more rounds of HSE data are available, and future campaigns would benefit from the incorporation of specific and rigorous impact evaluations.
Changing consumer behaviour forms only part of a national strategy to reduce population salt intake, and other strategies such as the reduction of salt in processed foods are critical and have already shown considerable successes(Reference Nutbeam31, Reference He and MacGregor32). Recent commitments by the food industry under the Department of Health's ‘Public Health Responsibility Deal’ in England to further reduce salt in processed foods are welcomed. However, reliance on industry reformulation may underestimate the potential impact of a health education strategy, and public awareness campaigns, together with regular evaluations, have been recommended as a central component to a successful population-wide salt reduction strategy(Reference Nutbeam31, Reference Cappuccio, Capewell and Lincoln33). Salt intake levels in the UK remain well above target levels of 6 g/d and further efforts are still needed. Future programmatic and research efforts may benefit from focusing on those population groups such as men, and poorer families, whose current salt intake and health profile are the most worrying.
Acknowledgements
We gratefully acknowledge the Economic and Social Data Service for granting permission to access and use the HSE datasets. The original data creators, depositors or copyright holders, the funders of the HSE Data Collections and the UK Data Archive bear no responsibility for their further analysis or interpretation. A. D. D. and B. S. identified the study topic and design. J. S. obtained the survey data, conducted the statistical analysis and wrote the first draft. P. E. provided the statistical support. All authors contributed to and approved the final draft of the paper. This study received no specific grant from any funding agency in the public, commercial or not-for-profit sectors. All authors declare that there are no conflicts of interest.


