


As people naturally eat a combination of many different foods, the association between single dietary factors and chronic disease risk can be difficult to determine and interpret( Reference Kant 1 ). Therefore, methods to investigate dietary patterns associated with morbidity and mortality have gained increasing interest as a complementary approach in nutrition science( Reference Li, Hou and Chen 2 ). Several systematic literature reviews (SLR) have summarised evidence from studies that investigate the association of dietary patterns with chronic disease risk – for example CVD or type 2 diabetes( Reference Rodriguez-Monforte, Flores-Mateo and Sanchez 3 , Reference Jannasch, Kroger and Schulze 4 ). Alongside a priori approaches, which use preliminary knowledge about the detriment or benefit of certain foods for a health outcome, exploratory approaches – using data at hand without any previous hypothesis – have been commonly applied to derive dietary patterns. Examples for exploratory approaches are factor analysis and principal component analysis (PCA), which use the covariance matrix of the food groups to reduce the dimensionality from a high number of food groups to few patterns of food consumption( Reference Hu 5 ). While principal components are linear combinations of the observed variables, factors derived by factor analysis can be understood as latent constructs( Reference Hatcher 6 ). Another exploratory approach is cluster analysis, which groups participants with similar dietary habits instead of correlated food groups( Reference Newby and Tucker 7 ). Contrary to factor analysis and PCA, where study participants can belong to more than one factor or principal component, cluster analysis groups participants into mutually exclusive, non-overlapping clusters( Reference Devlin, McNulty and Nugent 8 ). The mixed approaches, reduced rank regression (RRR) and partial least square method, also use the covariance matrix of the food groups and combine this with previous knowledge about nutrients or biomarkers, which are involved in the development of a certain health outcome( Reference Weikert and Schulze 9 ).
In comparison with a priori indices, which are applicable across different study populations, exploratory approaches result in population-specific dietary patterns, because these methods are exclusively based on data at hand. In particular, in investigations including different populations with likely differences in culinary habits, as can be expected, for example, in pan-European investigations, the population specificity of exploratory dietary patterns constitutes a challenging task, because differences in food intake distributions lead to heterogeneous dietary pattern compositions. With regard to methodological considerations, exploratory approaches require several decisions to come to a final solution of factors or clusters, and partially subjective decisions cannot be ruled out.
So far, to our knowledge, no systematic investigation of methodological characteristics of exploratory dietary pattern approaches related to investigations in the context of multi-centre or multi-country studies has been conducted. In the Framework of the Joint Programming Initiative ‘A Healthy Diet for a Healthy Life’ within the EU Committee, the DEterminants of DIet and Physical ACtivity (DEDIPAC) Knowledge Hub has been developed. This was a European transdisciplinary research network programme, which aimed to realise a more effective promotion of healthy diets and physical activity. Therefore, it aimed to identify state-of-the-art methods, enabling future cross-country interventions and policies( Reference Lakerveld, van der Ploeg and Kroeze 10 ). Within this framework, this systematic literature review specifically aimed to identify and compare (validated, if possible) exploratory dietary pattern methods, which were conducted in pan-European studies in order to deduce recommendations for such analyses in pan-European settings and beyond and to identify potential research gaps.
Methods
Data sources and study selection
A detailed plan for the conduction of the systematic review of pan-European studies was established in advance, and the respective protocol for the SLR can be accessed from PROSPERO (CRD42014014318). A systematic literature search was conducted in the databases MEDLINE, Web of Science and Embase, which encompassed search terms covering different thematic areas. The first area was described by terms that depict dietary habits or patterns. These were linked to the second area of a posteriori statistical methods. Terms for a priori methods were also included in the search to identify studies that might have applied several dietary pattern approaches. As one aim was to detect pan-European studies, which means that they were conducted in more than two European countries, the search included the names of European countries, as well as terms that addressed the multi-country aspect. The language was restricted to English. To ensure the inclusion of studies whose focus was on humans, animal studies were excluded. Owing to the relatively recent application of the a posteriori approaches on nutrition data, the search was limited to literature published between 1 January 1990 and 15 January 2018. Details of the search strategy can be found in the online Supplementary Table S1.
The screening of titles and abstracts of the identified articles was conducted by F. J. and F. R. independently. If doubts occurred, which could not be resolved, the article was retained for the next screening step. Any disagreement during the final full-text review stage was resolved through discussion of the articles concerned. No exclusions were made regarding any age group, sex, socio-economic status or ethnicity, but the study populations were required to be free-living and healthy. In addition, no restriction was set to the study design. Additionally, reference lists of the identified articles and reviews, which seemed to be relevant, were screened for a comprehensive overview. No ‘grey literature’ – that is conference papers or unpublished manuscripts – were included in this SLR. In case of the DIETSCAN study and European Prospective Investigation into Cancer and Nutrition (EPIC)-Elderly( Reference Bamia, Orfanos and Ferrari 11 , Reference Bamia, Trichopoulos and Ferrari 12 ), which were identified several times( Reference Balder, Virtanen and Brants 13 – Reference Mannisto, Dixon and Balder 15 ), the publications with the most detailed dietary pattern method( Reference Bamia, Orfanos and Ferrari 11 , Reference Balder, Virtanen and Brants 13 ) were retained for further consideration.
Data extraction and quality assessment
Data extraction was done by one reviewer and confirmed by a second reviewer. An excel sheet, which captured all relevant information to answer the research question, was developed and included the following data: title, author, year, name and design of the study, countries and their contributing sample size and follow-up time. Details of the study population were also extracted: for example, sex, age, ethnicity, socio-economic status and educational level. The dietary assessment method, the statistical method to derive dietary patterns, the pattern label and variation between different study populations were considered as relevant.
As the search was not limited to a distinct health outcome, quality assessment tools such as the SIGN checklist (developed by Scottish Intercollegiate Guidelines Network) were not applicable. A more general quality assessment was developed, which included five questions and a formula to calculate a score. Possible answers were scored as follows: ‘yes’ (2 points), ‘partially’ (1 point), if at least some information was provided, ‘no’ (0 points) (online Supplementary Table S2):
(1) Is the design evident to answer our study question?
(2) Are the subject characteristics sufficiently described?
(3) Is the method of diet assessment described?
(4) Is the diet pattern method well defined and are the details of assessment reported?
(5) Is some estimate of variance reported for the dietary patterns?
 $$ \eqalign { & {\rm Summary}\,{\rm score} \cr & {{\equals}} {{\left( {\left {({\rm number}\,{\rm of}\,{\rm yes}^{{\rm '}} \,{\times}\,{\rm 2})} \right{\rm {\plus}}\left {({\rm number}\,{\rm of}\,{\rm partial}^{{\rm '}} {\times}\,{\rm 1})} \right} \right)} \over {{\rm 10 \ (total}\ {\rm possible}\,{\rm sum)}}}.$$
Additional search for validation studies
Notwithstanding the PROSPERO protocol, an additional search strategy (online Supplementary Table S3) was developed and the search was conducted on 1st July 2016 in the databases Medline and Web of Science to identify studies that validated dietary patterns, because none of the identified studies according to the main aim of the SLR focused on the validation of the derived dietary patterns. As this SLR aims to give an overview of methodological considerations of exploratory statistical approaches, the additional search was not limited to pan-European studies.
Results
Description of the included studies
The initial search identified 2816 articles, which resulted in 2554 articles after removing all duplicates. Titles and abstracts were screened regarding the inclusion criteria, and the full-text screening comprised twenty articles (Fig. 1), which resulted in five articles being retained( Reference Bamia, Orfanos and Ferrari 11 , Reference Haveman-Nies, De Groot and Van Staveren 16 – Reference Pala, Lissner and Hebestreit 19 ). On the basis of the reference screening of the remaining articles, one additional publication( Reference Balder, Virtanen and Brants 13 ) was included for data extraction, resulting in a total of six final articles.
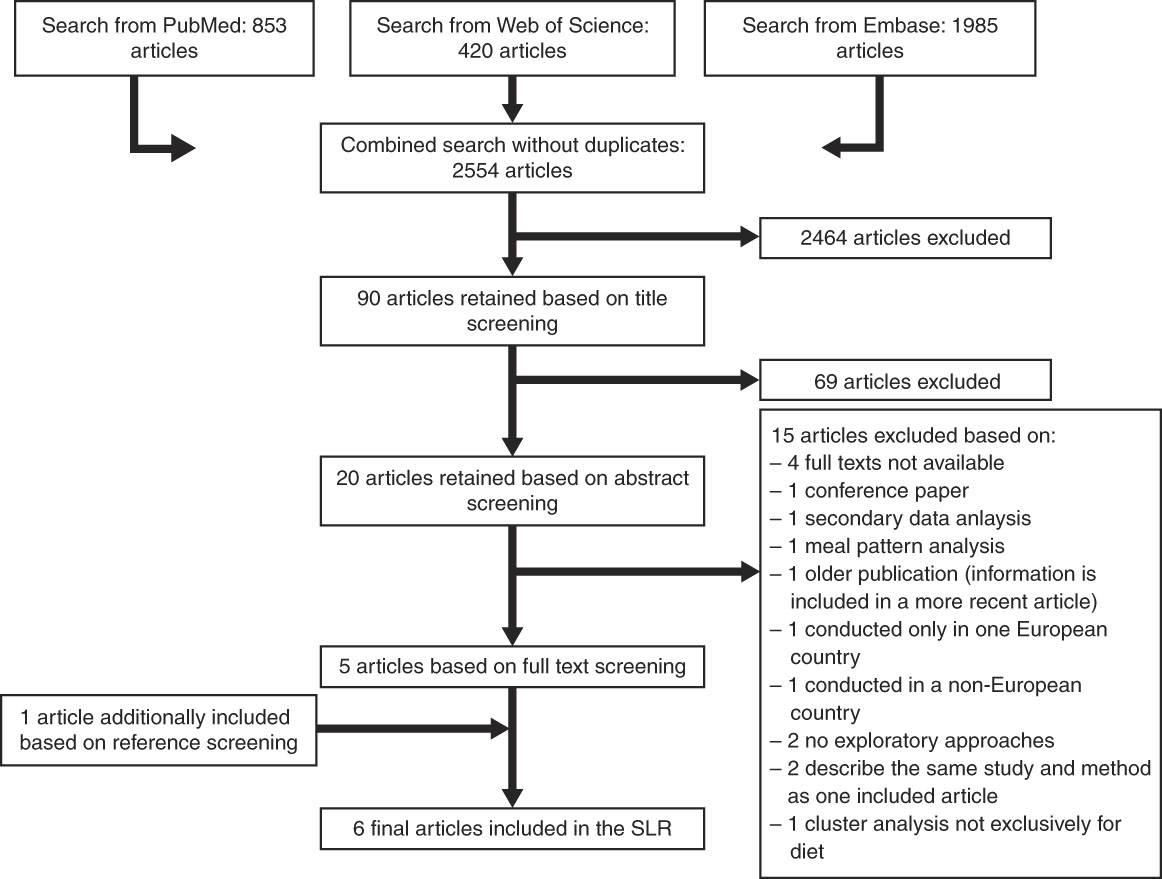
Fig. 1 Flow diagram of the article screening process. SLR, systematic literature review.
The main characteristics of the included studies are described in Table 1. The number of included European countries ranged from four( Reference Balder, Virtanen and Brants 13 ) to twelve( Reference Iqbal, Anand and Ounpuu 17 ). The number of participants ranged from small studies with 807 participants( Reference Haveman-Nies, De Groot and Van Staveren 16 ) to larger studies with 107 673 participants( Reference Balder, Virtanen and Brants 13 ). One study investigated dietary patterns in children( Reference Pala, Lissner and Hebestreit 19 ), two studies in participants aged over 60 or 70 years (EPIC-Elderly( Reference Bamia, Orfanos and Ferrari 11 ) and SENECA( Reference Haveman-Nies, De Groot and Van Staveren 16 )), whereas the other studies( Reference Balder, Virtanen and Brants 13 , Reference Iqbal, Anand and Ounpuu 17 , Reference Menotti, Kromhout and Blackburn 18 ) investigated dietary patterns in adults aged between 35 and 76 years. Information about the socio-economic status of participants was reported in one included publication( Reference Iqbal, Anand and Ounpuu 17 ) and education as an important characteristic of the study population was described in two publications( Reference Bamia, Orfanos and Ferrari 11 , Reference Iqbal, Anand and Ounpuu 17 ). In the INTERHEART study( Reference Iqbal, Anand and Ounpuu 17 ), education was considered as part of the socio-economic status.
Table 1 Summary of the included studies (n 6) and their characteristics
SES, socio-economic status; DIETSCAN, Dietary Patterns and Cancer; ATBC, Alpha-Tocopherol, Beta-Carotene Cancer Prevention Study; NLCS, Netherlands Cohort Study; SMC, Swedish Mammography Cohort; ORDET, Hormones and Diet in the Etiology of Breast Cancer Risk; EPIC, European Prospective Investigation into Cancer and Nutrition; AMI, acute myocardial infarction; IDEFICS, Identification and prevention of Dietary- and lifestyle-induced health EFfects In Children and infantS.
The exploratory approaches used to generate dietary patterns in the identified pan-European studies were limited to two. Factor analysis( Reference Iqbal, Anand and Ounpuu 17 , Reference Menotti, Kromhout and Blackburn 18 ) or PCA( Reference Bamia, Orfanos and Ferrari 11 , Reference Balder, Virtanen and Brants 13 , Reference Pala, Lissner and Hebestreit 19 ) was applied in five studies (Table 2), whereas cluster analysis was applied in two studies( Reference Bamia, Orfanos and Ferrari 11 , Reference Haveman-Nies, De Groot and Van Staveren 16 ) (Table 3). For those studies that applied factor analysis or PCA, the number of identified patterns ranged from one pattern in the Seven Countries Study( Reference Menotti, Kromhout and Blackburn 18 ) and EPIC-Elderly( Reference Bamia, Orfanos and Ferrari 11 ) to seven patterns in the DIETSCAN study( Reference Balder, Virtanen and Brants 13 ). Labels were given to patterns according to the food groups that characterised the patterns – for example, the ‘pork, processed meat and potatoes’ pattern or ‘(salad) vegetables’ pattern in the DIETSCAN study( Reference Balder, Virtanen and Brants 13 ) or the ‘plant-based’ dietary pattern in the EPIC-Elderly study( Reference Bamia, Orfanos and Ferrari 11 ). Another approach to labelling the patterns involved description of regional dietary habits such as the ‘oriental’ or ‘western’ pattern in the INTERHEART study( Reference Iqbal, Anand and Ounpuu 17 ). In the Identification and prevention of Dietary- and lifestyle-induced health EFfects In Children and infantS (IDEFICS) study( Reference Pala, Lissner and Hebestreit 19 ), the pattern labels were a mixture of eating behaviour (snacking), food groups characterising the pattern (‘vegetables and whole meal’) and macronutrients (‘protein and water’). The Seven Countries Study( Reference Menotti, Kromhout and Blackburn 18 ) did not use any label for the single derived pattern. In the SENECA study, where exclusively snack food was considered, five clusters were labelled with regard to food groups that characterised them( Reference Haveman-Nies, De Groot and Van Staveren 16 ). In EPIC-Elderly, three clusters were identified and labelled A, B and C( Reference Bamia, Orfanos and Ferrari 11 ).
Table 2 Overview of the studies using factor analysis or principal component analysis (PCA) to derive dietary patterns (DP)
DIETSCAN, Dietary Patterns and Cancer; ATBC, Alpha-Tocopherol, Beta-Carotene Cancer Prevention Study; NLCS, Netherlands Cohort Study; SMC, Swedish Mammography Cohort; ORDET, Hormones and Diet in the Etiology of Breast Cancer Risk; EPIC, European Prospective Investigation into Cancer and Nutrition; IDEFICS, Identification and prevention of Dietary- and lifestyle-induced health EFfects In Children and infantS; CEHQ, Children's Eating Habits Questionnaire.
Table 3 Overview of the studies using cluster analysis to derive dietary patterns (DP)
EPIC, European Prospective Investigation into Cancer and Nutrition.
Four of the six identified studies achieved a good appraisal with nine to ten quality points. The remaining two studies achieved a moderate appraisal with seven points (online Supplementary Table S2).
Methods to generate dietary patterns
Details of the dietary assessment instruments
The most commonly used dietary assessment instrument throughout the studies was the FFQ (Table 2). In most publications, information was available on the number of food groups, which were frequently condensed from a larger number of food items implemented in the questionnaires. For example, in the DIETSCAN project( Reference Balder, Virtanen and Brants 13 ) the FFQ from the different cohorts included sixty-seven to 276 single food items, which were aggregated to fifty-one common food groups to be defined as having a specific role in the diet and a possible relevance to the aetiology of the health outcome. In contrast to that, investigators of the INTERHEART study( Reference Iqbal, Anand and Ounpuu 17 ) used a generic questionnaire applicable in multiple countries with a small number of preselected food groups (n 19). To assess dietary habits in 2- to 9-year-old children in the IDEFICS study( Reference Pala, Lissner and Hebestreit 19 ), the Children’s Eating Habits Questionnaire was developed, comprising forty-three food groups, which was provided in local languages and with additional explanations for the parents or other caregivers. In EPIC-Elderly, dietary intake was mainly assessed with FFQ, partly also semi-quantitative FFQ, which were characterised by country-specific components. Subsequently, twenty-two food groups were aggregated, which were comparable among all participating EPIC centres( Reference Bamia, Orfanos and Ferrari 11 ). In the Seven Countries Study( Reference Menotti, Kromhout and Blackburn 18 ), dietary records were used to capture the dietary intake: in fourteen of sixteen countries 7-d records were applied, except in the USA (1-d record) and Japan (4-d record). The food items were then summarised into eighteen food groups. In the SENECA study, participants were asked to record their food intake with 3-d dietary records( Reference Haveman-Nies, De Groot and Van Staveren 16 ). As this study aimed to investigate snack patterns, information about eating occasions was collected and a selection of fifteen food groups was considered as snack foods.
Three studies( Reference Bamia, Orfanos and Ferrari 11 , Reference Balder, Virtanen and Brants 13 , Reference Pala, Lissner and Hebestreit 19 ) reported to use validated dietary assessment instruments, whereas one study stressed that only face validity of the instrument was investigated( Reference Iqbal, Anand and Ounpuu 17 ). However, no information on the validity or reliability of the assessment instruments was provided in the other two studies( Reference Haveman-Nies, De Groot and Van Staveren 16 , Reference Menotti, Kromhout and Blackburn 18 ).
Details of the identification of dietary patterns
The aim of exploratory statistical approaches is the identification of certain underlying structures of dietary intake. Although those approaches are exclusively data-based, decisions to identify these dietary patterns remain arbitrary. Three studies reported that factor analysis was applied( Reference Balder, Virtanen and Brants 13 , Reference Iqbal, Anand and Ounpuu 17 , Reference Menotti, Kromhout and Blackburn 18 ). However, the criteria to identify the dietary patterns were specifically described for PCA. In one study( Reference Pala, Lissner and Hebestreit 19 ), the Kaiser–Meyer–Olkin criterion was applied to investigate the adequacy of sampling of the food groups used in the PCA. From the five identified studies applying PCA, three studies( Reference Bamia, Orfanos and Ferrari 11 , Reference Iqbal, Anand and Ounpuu 17 , Reference Pala, Lissner and Hebestreit 19 ) used the criteria eigenvalue>1, scree plot and interpretability of the principal components to decide upon the number of dietary patterns to retain, whereas one study( Reference Balder, Virtanen and Brants 13 ) solely used the first two criteria. Menotti et al.( Reference Menotti, Kromhout and Blackburn 18 ) did not report any criteria. The eigenvalue>1 criterion implies that only those principal components with an eigenvalue>1 will be retained. Considering that the eigenvalue is the amount of variance accounted for by one principal component and each observed food variable contributes one unit of variance to the total variance, principal components with eigenvalues>1 represent a data reduction( Reference Hatcher 6 ). Nevertheless, with this criterion the number of retained factors can be quite large. Therefore, a plot of the eigenvalues of principal components (scree plot) may help to decide the final number of retained principal components, by visually distinguishing a small number of components, which explain a lot of variance in the food groups, from the residual components, which explain a minor amount of variance( Reference Hatcher 6 ). Besides these two criteria, investigators frequently took into account the interpretability of identified patterns. Interpretability usually considers the conceptual meaning of an identified principal component, but in terms of dietary patterns it is difficult to adjudicate on a combination of food groups. Furthermore, in the articles, where interpretability was listed as a criterion, no explanations were given as to what was meant by this. Although the retained principal components consisted of all original food groups, cut-offs for the factor loadings of food groups were frequently set to identify those foods that were meaningful contributors to the pattern. This cut-off ranged between factor loadings of 0·20( Reference Pala, Lissner and Hebestreit 19 ) and 0·35( Reference Balder, Virtanen and Brants 13 ) in the identified studies. In two articles( Reference Bamia, Orfanos and Ferrari 11 , Reference Balder, Virtanen and Brants 13 ), the food groups were energy-adjusted with the residual method, developed by Willett and Stampfer( Reference Willett and Stampfer 20 ), before they were included in the analyses to account for total energy intake.
The second identified exploratory method, namely cluster analysis, was applied in two pan-European studies( Reference Bamia, Orfanos and Ferrari 11 , Reference Haveman-Nies, De Groot and Van Staveren 16 ). Both studies used the Ward’s minimum variance method but different criteria to derive the final cluster solution. In general, two clustering techniques for deriving dietary patterns can be distinguished: the hierarchical and non-hierarchical clustering. As a hierarchical approach of clustering people according to their dietary habits, the Ward’s minimum variance method was applied in the identified study( Reference Haveman-Nies, De Groot and Van Staveren 16 ). This is an agglomerative method, starting with each observation as its own cluster and merging together to a larger cluster( Reference Walthouwer, Oenema and Soetens 21 ). For that purpose, the ANOVA, retaining only those pairs of clusters with the smallest increase in the error sum of squares, is usually used( Reference Lo Siou, Yasui and Csizmadi 22 ). The number of cluster solutions was chosen based on the proportion of the explained variance of all variance (R2) of the clusters and on their composition( Reference Haveman-Nies, De Groot and Van Staveren 16 ).
Validity of dietary patterns
Although the included studies partly assessed the validity of the dietary assessment instrument( Reference Bamia, Orfanos and Ferrari 11 , Reference Pala, Lissner and Hebestreit 19 ), none of the identified pan-European studies has yet investigated the validity of dietary patterns. However, existing attempts at validation, which were not limited to the pan-European context, were identified with an additional systematic literature search (online Supplementary Table S3). Seven studies could be included( Reference Ambrosini, O’Sullivan and de Klerk 23 – Reference Okubo, Murakami and Sasaki 29 ) (Table 4). Of these, two studies investigated dietary patterns in adolescents( Reference Ambrosini, O’Sullivan and de Klerk 23 , Reference Appannah, Pot and O’Sullivan 24 ), whereas adults were investigated in the other five studies( Reference Asghari, Rezazadeh and Hosseini-Esfahani 25 – Reference Okubo, Murakami and Sasaki 29 ). Six published articles validated dietary patterns derived by factor analysis( Reference Ambrosini, O’Sullivan and de Klerk 23 , Reference Asghari, Rezazadeh and Hosseini-Esfahani 25 , Reference Khani, Ye and Terry 27 ) or PCA( Reference Hu, Rimm and Smith-Warner 26 , Reference Nanri, Shimazu and Ishihara 28 , Reference Okubo, Murakami and Sasaki 29 ) and one study by RRR( Reference Appannah, Pot and O’Sullivan 24 ), respectively. The dietary assessment instruments to measure food intake were predominantly FFQ, which were validated in the majority of studies( Reference Ambrosini, O’Sullivan and de Klerk 23 , Reference Appannah, Pot and O’Sullivan 24 , Reference Hu, Rimm and Smith-Warner 26 ). In the Japanese study, a diet history questionnaire referring to the previous month was used( Reference Okubo, Murakami and Sasaki 29 ). Dietary records mostly served as validation instruments, but the recording methods differed with regard to the time frame from 3 d( Reference Ambrosini, O’Sullivan and de Klerk 23 , Reference Appannah, Pot and O’Sullivan 24 ), 4 d( Reference Okubo, Murakami and Sasaki 29 ) to 1 week( Reference Hu, Rimm and Smith-Warner 26 , Reference Khani, Ye and Terry 27 ). In the study by Asghari et al.( Reference Asghari, Rezazadeh and Hosseini-Esfahani 25 ), the mean of twelve 24-h dietary recalls was applied. The frequency of application ranged from one time( Reference Ambrosini, O’Sullivan and de Klerk 23 , Reference Appannah, Pot and O’Sullivan 24 ) to four times( Reference Okubo, Murakami and Sasaki 29 ) for dietary records. Dietary patterns derived by PCA/factor analysis were either retained by using the scree plot( Reference Hu, Rimm and Smith-Warner 26 , Reference Okubo, Murakami and Sasaki 29 ), the eigenvalue and scree plot( Reference Appannah, Pot and O’Sullivan 24 ) or all three common criteria (including interpretability as an additional criterion)( Reference Hu, Rimm and Smith-Warner 26 , Reference Nanri, Shimazu and Ishihara 28 ). In the study by Khani et al.( Reference Khani, Ye and Terry 27 ), only those principal components with eigenvalues >1·8 were retained. The authors reported to use the same criteria for deriving the dietary patterns, except for Ambrosini et al., who applied different eigenvalue criteria (>1 for FFQ-derived dietary data, <1 for food record-derived data)( Reference Ambrosini, O’Sullivan and de Klerk 23 ). The retained dietary patterns resulted in similar numbers and comparable compositions, when patterns derived by the study instrument were validated against patterns derived by the reference instrument (Table 4). The correlation coefficients between the derived scores were modest in all included studies. Ambrosini et al.( Reference Ambrosini, O’Sullivan and de Klerk 23 ) reported higher correlation coefficients if energy-adjusted dietary patterns were used. The percentage of the variance explained in dietary patterns using data from dietary records was higher than from FFQ in two studies( Reference Asghari, Rezazadeh and Hosseini-Esfahani 25 , Reference Khani, Ye and Terry 27 ), whereas it was comparable in the study by Okubo et al.( Reference Okubo, Murakami and Sasaki 29 ). The dietary patterns derived by RRR using data from an FFQ and from a food record were similar in composition, and modest agreement between the dietary pattern scores was observed( Reference Appannah, Pot and O’Sullivan 24 ).
Table 4 Overview of included studies that validated their dietary patterns
PCA, principal component analysis; FA, factor analysis; FR, food record; n.a., no analysis; DR, dietary record; SMC, Swedish Mammography Cohort; DHQ, diet history questionnaire; RRR, reduced rank regression.
Discussion
Two exploratory dietary pattern approaches were identified in pan-European studies: PCA/factor analysis and cluster analysis. Although factor analysis and PCA are conceptually different, strong similarities in their application using standard statistical software made it, in many cases, unclear as to which method was indeed used by the included studies. We therefore discuss such studies together. In studies that applied PCA/factor analysis to derive dietary patterns, two criteria to select dietary patterns (eigenvalue, scree plot) were commonly applied, whereas the third criterion of interpretability was applied in half of the studies. As the latter criterion was insufficiently described, it highlights the demand for a better reporting of what is exactly meant by ‘interpretability’ to enhance transparency and enable the replication of pattern methods. The described three criteria have also been applied in numerous single-country studies, as summarised in recent comprehensive SLR( Reference Rodriguez-Monforte, Flores-Mateo and Sanchez 3 , Reference Jannasch, Kroger and Schulze 4 ). Hence, they appear to be commonly applied methods. As we aimed to deduce recommendations for future investigations, the quality of the included studies was investigated to ensure best practice methods. We developed our own quality rating system to consider important criteria such as the sufficient reporting of the dietary assessment and dietary pattern approach. Common quality rating systems rather take into account risk assessments between dietary exposures and the development of a certain disease outcome, which was not the focus of this review. Furthermore, information on validated dietary assessment instruments was also part of our quality rating, as this could determine the overall quality of the study. Although four of the six studies were rated good, two studies were rated moderate owing to their lack of using validated assessment instruments.
Two pan-European studies used cluster analysis to derive dietary patterns. Both applied Ward’s minimum variance method, but reported different criteria to come to a final cluster solution. To put it in a wider context, a review published by Devlin et al.( Reference Devlin, McNulty and Nugent 8 ) stated that cluster analysis techniques are highly influenced by researcher bias, for example the decision for the final number of clusters, as there is no standard available. A comparison of three cluster analysis methods, namely Ward’s minimum variance method, k-means procedure and flexible-beta method, was undertaken by Lo Siou et al.( Reference Lo Siou, Yasui and Csizmadi 22 ) and it was concluded that clusters derived by the k-means procedure were more reproducible than the other two methods. However, the authors also concluded that it is likely that other methods would be more appropriate as data reduction techniques, but up to now reviews identified the k-means procedure as the most commonly applied method( Reference Newby and Tucker 7 , Reference Devlin, McNulty and Nugent 8 ).
In the context of pan-European investigations, the standardisation of dietary assessment and dietary data processing with regard to the availability of food items across different countries (either included in a specific questionnaire or later condensed from a higher number of assessed food items) constitutes an important part of the methodology. Nevertheless, this can potentially be at the expense of country-specific food choices, which could mean a possible loss of relevant details in the determination of a diet–disease relationship( Reference Balder, Virtanen and Brants 13 ). This issue could be also extrapolated as relevant to other multi-country comparisons or even single-country multi-centre studies, when differences in dietary habits and culinary usage are present. Regarding the actual dietary pattern composition, it is deemed necessary to evaluate whether this pattern is applicable across several countries or whether it rather reflects country-specific differences. Indeed, the majority of studies investigated this issue and three studies( Reference Bamia, Orfanos and Ferrari 11 , Reference Iqbal, Anand and Ounpuu 17 , Reference Menotti, Kromhout and Blackburn 18 ) identified rather region-specific patterns. In contrast, Balder et al.( Reference Balder, Virtanen and Brants 13 ) identified in all countries the first two components with comparable compositions, whereas the components 3 to 5 rather reflected country-specific patterns.
Besides these considerations, the impact of transforming dietary data before exploratory patterns analyses – for example by different forms of energy-adjustment of food groups – on pattern solutions has not been sufficiently evaluated yet. In one study( Reference Balder, Virtanen and Brants 13 ), the authors concluded that these considerations did not materially change the number of factor solutions, but resulted in patterns stronger reflecting food substitution mainly for those dietary patterns, which had high contributions of energy-dense food groups. Clearly, more research is needed to also clarify this question and enable definite recommendations how to control for total energy intake.
With regard to the pan-European context, no study has been conducted yet on deriving dietary patterns by RRR. However, this presents quite a challenge, as not only information on food groups needs to be available across several countries but information is also required on specific biomarkers or nutrients, which can be linked to the respective health outcome of interest. Furthermore, results have to be interpreted with caution, because the two steps of deriving this disease-specific dietary pattern and relating it to the disease can lead to overoptimistic results if investigated within the same study population. Therefore, it is highly recommended to evaluate the results in an external study population to test for generalisability( Reference Weikert and Schulze 9 ), as it was done in several existing studies for type 2 diabetes( Reference Kroeger, Schulze and Romaguera 30 – Reference Imamura, Lichtenstein and Dallal 32 ).
As it was already concluded in our previous systematic review, the application of exploratory methods results in population-specific dietary patterns, which were highly heterogeneous across populations( Reference Jannasch, Kroger and Schulze 4 ). Also in this review, the identified dietary patterns largely differed in their composition and labelling by the authors. To our knowledge, exploratory pattern approaches have not been tested with regard to validity and reliability in the pan-European context so far. However, we identified several validation studies not limited to pan-European studies with an additional search. Summarising from this set of studies, those dietary patterns that were derived by PCA/factor analysis had a rather modest validity when compared with the respective reference instruments. This could be constituted by methodological differences between dietary assessment methods. Although an FFQ better captures episodically eaten foods owing to a longer reported time span, a dietary record usually reports a smaller range of food groups, probably providing excess zero consumption and therefore an underestimation of the usual consumption of certain food groups. However, this is largely depending on the frequency of application and hence on the comprised time span( Reference Ambrosini, O’Sullivan and de Klerk 23 , Reference Okubo, Murakami and Sasaki 29 , Reference Crozier, Inskip and Godfrey 33 ). Consequently, partly different dietary pattern structures, hence lower correlation coefficients, could occur. However, attenuating the validity is not the only concern. If the investigation of the relative validity of dietary patterns was solely restricted to food groups that were assessed in both the study and reference dietary assessment instruments, then it is important to consider that this could potentially result in an overoptimistic validity( Reference Okubo, Murakami and Sasaki 29 ). Regarding the criteria to retain a certain number of principal components/factors, no standard could be deduced, because the identified studies largely differed in their application of respective criteria. We identified only one study that investigated the relative validity of RRR patterns from an FFQ against a dietary record in adolescents and observed a modest agreement( Reference Appannah, Pot and O’Sullivan 24 ).
Strength of this SLR was the comprehensive search in three distinct databases and an additional reference screening to identify all existing publications, which offered information on dietary patterns in the pan-European context. Nevertheless, it could not be ruled out that we did not identify all relevant approaches. A further strength was the measurement of the quality of the included studies, although no commonly used checklist (e.g. SIGN checklist) was applied. However, we captured several aspects of quality assessment by determining five questions, which were formulated to identify high-quality studies for the specific aim of this SLR.
Conclusion
To conclude, the literature search identified six studies that applied exploratory statistical approaches to derive dietary patterns in the pan-European context. PCA/factor analysis was the predominant approach and the eigenvalue>1 and scree plot were the most commonly applied criteria to decide upon the number of principal components/factors to retain. Nevertheless, a more detailed description and justification for the applied method (PCA v. factor analysis) and criteria, particularly the interpretability criterion, is demanded to ensure a better comparability of the actual applied methods. Clear gaps were identified for cluster analysis that was applied in two studies, where criteria vigorously differed, although both studies reported to use Ward’s minimum variance method. Approaches such as RRR have not yet been applied in pan-European studies. Concluding from an additional search of validation studies, moderately correlated dietary patterns were identified, which did not alter in the number and composition of dietary patterns when PCA/factor analysis was applied on intake data from different dietary assessment instruments. Nevertheless, it is highly recommended to investigate the validity of dietary patterns across countries to ensure a certain generalisability of an identified pattern structure beyond the population it was derived in.
Acknowledgements
The preparation of this paper was supported by the DEterminants of DIet and Physical ACtivity (DEDIPAC) knowledge hub. This work is supported by the Joint Programming Initiative ‘Healthy Diet for a Healthy Life’. The funding agency supporting this work is Federal Ministry of Education and Research, Germany.
F. J. planned and conducted the review, and drafted and revised the paper. F. R. contributed to the conduction of the review and revised the paper. L. F. A. revised the paper. M. B. S. contributed to the planning, and drafted and revised the paper.
The authors declare that there are no conflicts of interest.
Supplementary material
For supplementary material/s referred to in this article, please visit https://doi.org/10.1017/S0007114518001800


 Open access