


Many studies have shown that the liver and the intestine play a prominent role in the first-pass metabolism of dietary amino acids (AA)(Reference Stoll, Burrin and Henry1–Reference Bos, Stoll and Fouillet3). Indeed, the intestine extracts and utilises a significant share of dietary AA(Reference Yu, Wagner and Tredget4, Reference Matthews, Marano and Campbell5), while the liver metabolises 50 % of absorbed AA in a first-pass process(Reference Elwyn, Parikh and Shoemaker6, Reference Abumrad and Miller7). Hence, these two organs appear to be anatomically and metabolically associated with the regulation of dietary AA fluxes in order not just to cover their respective needs but, above all, to regulate the peripheral availability of AA in the postprandial phase. However, while the modulatory role of the liver in AA catabolism through ureagenesis is well established (see Cynober(Reference Cynober, Lennarz and Lane8) for a recent review), less is known about the contribution of the intestine in this regulation of N homeostasis.
Arginine is a powerful activator of ureagenesis(Reference Kawamoto, Ishida and Mori9), not only as a substrate, but also as an activator of N-acetylglutamate synthase, consequently producing N-acetylglutamate, an allosteric activator of carbamoyl phosphate synthase 1, which is considered as the limiting enzyme of the urea cycle. Portal flow of arginine is thought to be essential in the activation of hepatic AA degradation(Reference Morimoto, Brady and Atkinson10). Interestingly, Rerat et al. (Reference Rerat, Simoes-Nunes and Mendy11) showed a close positive relationship between protein supply and portal flow of arginine. After meal ingestion, arginine can either be directly released into the portal blood or converted into ornithine and urea by arginase (ARGase) in the enterocytes and then into citrulline by ornithine transcarbamylase (OTC) (Fig. 1). Citrulline passes through the liver without significant uptake(Reference Windmueller and Spaeth12), thereby without affecting ureagenesis. It can then be taken up by the kidney, where it is converted back into arginine(Reference Matsuzawa, Kobayashi and Tashiro13). Castillo et al. (Reference Castillo, Chapman and Sanchez14) showed that 80 % of circulating arginine in healthy volunteers came from de novo renal synthesis from intestinal citrulline. Importantly, glutamine, another AA which also plays a key role in ureagenesis, can also lead to the intestinal production of citrulline. Indeed, glutamine contributes significantly to citrulline synthesis via glutaminase, ornithine aminotransferase (OAT) and OTC. The importance of intestinal citrulline production is emphasised by the recent demonstration that N homeostasis can be markedly improved by citrulline administration in situations of decreased citrulline synthesis by the gut(Reference Osowska, Moinard and Neveux15–Reference Moinard and Cynober17).

Fig. 1 Intestinal ornithine (ORN) crossroad and arginine (ARG) homeostasis (from Bruhat et al. (Reference Bruhat, Jousse and Fafournoux43)). ARGase, arginase; OAT, ornithine aminotransferase; GLNase, glutaminase; OTC, ornithine transcarbamylase; CIT, citrulline; GLN, glutamine; GLU, glutamate.
Based on these data, we speculated that intestinal arginine metabolism could be regulated by variations in dietary protein supply. Wraight & Hoogenraad(Reference Wraight and Hoogenraad18) reported that OTC expression is enhanced in the intestine of rats receiving a low-protein diet, suggesting that OTC could be the limiting step of this enzymatic crossroad. However, data from the literature on this subject are scarce and often based on non-physiological variations in protein supply.
We hypothesised that protein supply directly regulates the expression of the enzymes of the intestinal arginine–ornithine–citrulline crossroad, which would be therefore an important direct regulator of N homeostasis. Our aim was to investigate whether the intestinal enzymes involved in citrulline synthesis are responsive to variations in dietary protein levels, using both in vivo and cell culture approaches. In a first set of experiments conducted in vivo in rats, we studied the short-term (ST, 16 h) and long-term (LT, 15 d) effects of physiological variations in protein supply (i.e. 10, 17 or 25 % of dietary intake) on the expression and activity of these enzymes. Second, as AA have been shown to act as direct modulators of gene expression(Reference Fafournoux, Bruhat and Jousse19), we chose to evaluate the direct action of AA on these enzymes in enterocytic cells. Thus, in this second part of the present study, we evaluated the effects of different AA concentrations on the expression of the same set of enzymes in an enterocyte cell line.
Materials and methods
Materials
Ethical approval
Animal care followed the French and European Community guidelines for the protection of animals used for experimental and other scientific purposes, and our protocol was approved by the Ile-de-France Regional Ethics Committee (no. P2.CM.009.05).
Chemicals
The cell culture experiments used AA-depleted Dulbecco's modified Eagle's minimum essential medium (DMEM; Eurobio, Les Ulis, France). Final AA levels in the culture media were obtained by adding sterile concentrated AA solutions (B6766, M7145 and G7513; Sigma-Aldrich, St Quentin Fallavier, France).
Isoflurane for inhalation anaesthesia was obtained from Baxter (Aerrane; Baxter SAS, Lessines, Belgium).
Animals
Male Sprague–Dawley rats (n 48; Charles River, L'Arbresle, France) weighing approximately 250 g and housed individually in a controlled temperature environment (21 ± 2°C) with a 12 h light–12 h dark cycle were given a diet with standard protein content (17 % (w/w) protein, 3 % (w/w) fat, 59 % carbohydrate, 21 % (w/w) water, fibre, vitamins and minerals; Dietex, St-Gratien, France) during a 7 d acclimatisation period.
Experimental design
In vivo study
At the end of the acclimatisation period, the rats were randomised into two sets of three groups (n 8) according to the feeding period, either ST or LT, and according to dietary protein content (10, 17 or 25 %) of the diet they will receive. All diets (SDS, Dietex) were isoenergetic and precisely analysed to guarantee the accuracy of the formulations.
For the ST study, the rats previously fed on the standard diet (17 % protein) were fasted for 8 h and then received 24 g of one of the three protein diets during the next 16 h. This amount of food was calculated as the mean of their ad libitum intake during the acclimatisation period. At the end of the 16 h feeding period, all rats had consumed the totality of food available, and they were anaesthetised by isoflurane inhalation (4 % isoflurane; Minerve, Esternay, France) and killed by decapitation.
For the LT study, the rats were fed the three protein diets for 15 d. They were placed in metabolism cages from day 11, and urine samples were collected during the last 2 d of the experiment. On day 14, rats were fasted for 8 h and then refed for 16 h with their respective diet, so that all animals were at a similar nutritional state. We also recorded body weight and food intake daily, and on the last 2 d of feeding, total daily urine samples were collected for N balance calculation. At the end of the 16 h feeding period, the rats were anaesthetised by isoflurane inhalation and killed by decapitation.
Mixed blood was collected into heparinised tubes immediately after killing. The blood samples were rapidly centrifuged, and plasma was deproteinised with a 30 % (w/v) sulfosalicylic acid solution for plasma AA analysis. The supernatants were stored at − 80°C until analysis. In parallel, the liver and kidney were removed and weighed by a second experimenter. The small intestine was entirely removed from the Treitz angle to the caecum, measured and divided into two pieces, the jejunum being the apical part and the ileum the distal part. Then, 10 cm of the jejunum and ileum were promptly removed from each animal by a third experimenter. Thereafter, the jejunum and ileum sections were washed with ice-cold saline solution flushed through the lumen and then inverted to collect the mucosa using glass microscope slides. The jejunal and ileal mucosa were then separated into four fractions, weighed, frozen in liquid N2 and stored at − 80°C until analysis.
In both the ST and LT studies, plasma AA and intestinal enzyme expressions and activities were measured.
Cell culture experiment
Caco-2/TC7 cells seeded at 6 × 10⁵ cells/cm2 (Reference Chantret, Rodolosse and Barbat20) were cultured on fifteen semi-permeable filters (3 μm high pore density; BD Biosciences, Meylan, France) in six-well plates in DMEM supplemented with 1 % non-essential AA (Invitrogen, Cergy-Pontoise, France) and 20 % heat-inactivated (30 min, 56°C) fetal bovine serum (AbCys, Paris, France). The use of semi-permeable filters allows discrimination between the apical and basal side of the cells. From confluence (8 d after seeding), only the basal compartment contained 20 % heat-inactivated fetal bovine serum. The medium was changed 48 h after seeding and daily thereafter. From day 15, the cells formed a polarised monolayer.
The cells were then used for the experiments and allocated into five groups (three wells per group):
(1) The medium of the basal compartment was either left the same (growth control) or replaced by AA-free DMEM (Eurobio, Les Ulis, France) and supplemented with insulin (10 μg/ml), transferrin (0·55 μg/ml) and Se (6·7 ng/ml) (Invitrogen) instead of the serum.
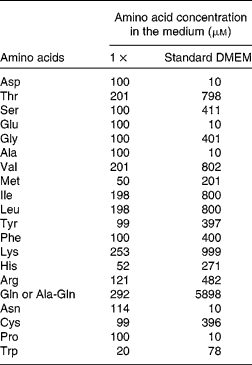
(2) The apical medium was either left the same (growth control) or replaced by DMEM supplemented with AA at 1 × , 2 × or 4 × concentration, or no AA (0 × ) (see Table 1 for details), representing the four groups of cells (0 × , 1 × , 2 × or 4 × ). The 1 × concentration is within the physiological range of plasma AA(Reference Le Bacquer, Laboisse and Darmaun21), and the 4 × concentration is the concentration found in standard DMEM.
A growth control group was included in the study to validate the cell growth in our experimental conditions. Since the results of the control cells overlapped with those from the 4 × group, we chose not to include the growth control group in the presentation of the results.
Table 1 Composition of the cell culture media*
DMEM, Dulbecco's modified Eagle's minimum essential medium.
* The concentrations for the 2 × , 3 × and 4 × media are multiple of the values given for the 1 × situation.
Cell viability was examined by measuring mitochondrial dehydrogenase activity using 3-(4,5-dimethylthiazol-2-yl)-2,5-diphenyltetrazolium bromide as the substrate (MTT assay kit; Sigma-Aldrich).
After 72 h of culture in these conditions, cells were harvested for mRNA measurements or used for viability testing.
Analytical methods
Estimated nitrogen balance
N balance was estimated as the difference between daily total N intake and daily urinary N output, and faecal N losses were not taken into account. As variations in dietary protein supply may dilute metabolic faecal N, this probably leads to some over- or underestimation of N balance according to the group considered. However, working with healthy animals and assuming normal gut trophic responses, it was considered that the major modifications in N balance would principally be a consequence of variations in AA oxidation. Nonetheless, the qualitative and semi-quantitative estimates obtained should be a valid approximation of the responses to the various treatments.
Total N intake was calculated from measured food intake, since the diets had the same protein source, and assuming that 100 g of protein contains 16 g of N. Urinary N (g/l) was quantified by thermochemiluminescence(Reference Grimble, West and Acuti22) using an Antek 9000 analyser (Antek, Houston, TX, USA).
Amino acid concentrations
AA in deproteinised plasma were separated and quantified by ion-exchange chromatography as described previously(Reference Neveux, David, Cynober and Cynober23). Results are expressed as μmol/l.
Enzyme assays
For measurements of OAT, OTC and glutaminase activities, samples were homogenised at 4°C with an Ultra-Turrax system (Ika-Labortechnik, Staufen, Germany) in a HEPES–sucrose homogenisation buffer (0·25 g/ml) containing 0·3 m-sucrose, 5 mm-HEPES, 3 mm-dithiothreitol and 0·5 % Triton 100X, at pH 7·4. In order to disrupt mitochondria, homogenates were subjected to three cycles of freezing in liquid N2 and thawing at 37°C, and then centrifuged at 600 g for 10 min. Supernatants were collected and maintained at − 80°C until analysis.
The OAT assay was performed as described previously(Reference Ventura, De Bandt and Segaud24) by measuring the formation of pyrroline-5-carboxylic acid, the product of ornithine transamination by OAT.
OTC was measured as described by Marshall & Cohen(Reference Marshall and Cohen25) by measuring the rate of citrulline formation from ornithine and carbamyl phosphate.
Glutaminase activity was determined via the formation of glutamate from glutamine, as described previously(Reference Passonneau, Lowry and Passonneau26).
ARGase activity was determined by the production of urea from arginine according to the Folley and Greenbaum method(Reference Folley and Greenbaum27).
Argininosuccinate synthetase and argininosuccinate lyase activities were measured by the consumption of citrulline and the production of arginine, respectively, as described by Ratner(Reference Ratner28).
All data on enzyme activities are expressed as mmol of product formed or degraded per h at 37°C and per mg tissue wet weight.
mRNA quantification
Total RNA was extracted from rat tissues using Trizol reagent (Invitrogen) or from Caco-2/TC7 cells using TRI reagent (Mrcgene, Cincinnati, OH, USA) according to the manufacturer's protocol. mRNA were analysed by real-time PCR. Reverse transcription was performed with 2 μg of total RNA using the Superscript™ First-Strand Synthesis System for RT-PCR (Invitrogen). mRNA quantification was performed on a SmartCycler System (Cepheid, Sunnyvale, CA, USA) with a 1:100 dilution of cDNA using the SYBRGreen Kit for SmartCycler (Eurogentec, Angers, France). Data are expressed as the ratio between target gene and internal control (18S), thus giving a relative expression. Primers for 18S were as follows: forward primer 5′-GTAACCCGTTGAACCCCATT-3′ and reverse primer 5′-CCATCCAATCGGTAG-3′. Other specific primer sequences are given in Table 2.
Table 2 Primer sequences for real-time PCR in rat tissues and human Caco2/TC7 cells

OTC, ornithine transcarbamylase; OAT, ornithine aminotransferase; ASS, argininosuccinate synthetase; ASL, argininosuccinate lyase.
Statistics
Data were analysed with R Software (Foundation for Statistical Computing, Vienna, Austria). Homogeneity of variances was examined by a Bartlett test. For the in vivo study, when appropriate (homogeneous variance), variance has been pooled, and standard error of the mean is presented in a single column. In vivo data were analysed with a one-way ANOVA, with the diet as the factor. Because the ST and LT studies correspond to two different physiological regulatory processes, data were therefore analysed separately. However, some data presented a constant variance with irregular n values (see Tables 5 and 6), which prevented the pooling of the standard error of the mean. Therefore, individual standard error of the mean and n values are indicated under the mean when appropriate. Data with heterogeneous variance (Tables 3, 5 and 6) were analysed with a non-parametric Kruskal–Wallis test, and the standard error of the mean is presented under the mean in the tables.
Moreover, linear and quadratic contrasts were measured and are presented in the tables (L, linear contrast slope (P value); Q, quadratic contrast curvature (P value)).
For cell culture experiments, the lack of linearity in the results induced an adjustment of the quadratic model. Due to variance heterogeneity, in vitro data analysis was performed on transformed data (log), but is presented as original data for a better visibility of the results. A P value of < 0·05 was considered as significant.
Results
The ST changes in the level of protein supply only led to limited changes in plasma AA except for a significant increase in branched-chain AA in the ST25 % group compared with the two other groups (P < 0·05; Table 3). Plasma urea was increased with the increase in dietary protein level (10 and 17 v. 25 %, P < 0·05; Table 4).
Table 3 Plasma amino acid concentrations (μmol/l) in rats fed a diet containing from 10 to 25 % protein for 24 h (short term) or 15 d (long term)
(Mean values with their standard errors, n 8)

L, linear contrast; Q, quadratic contrast; BCAA, branched-chain amino acids.
a,b Mean values within a row with unlike superscript letters were significantly different (P < 0·05; ANOVA).
* The level of significance was given by one-way ANOVA.
† Slope data.
‡ Curvature data.
§ Heterogeneity of variance; pooled standard error of the mean was not calculated, a Kruskal–Wallis test was performed, and individual standard errors of the mean are presented under the means.
Table 4 Protein metabolism parameters of rats fed a diet containing from 10 to 25 % protein for 24 h (short term) or 15 d (long term)
(Mean values with their standard errors, n 8)

L, linear contrast; Q, quadratic contrast.
a,b,c Mean values within a row with unlike superscript letters were significantly different (P < 0·05; ANOVA).
* The level of significance was given by one-way ANOVA.
† Slope data.
‡ Curvature data.
There were no modifications in enzyme activities or expressions in the jejunal mucosa (data not shown). ARGase activity in the ileal mucosa was higher in the ST10 % and ST25 % groups than in the ST17 % group (P < 0·05; Table 5). In addition, ARGase activity in the intestine was related to the arginine plasma level (P = 0·013). However, there were no significant modifications in the expression of the enzymes of ornithine metabolism (Table 6).
Table 5 Enzymatic activities in the ileal mucosa of rats fed a diet containing from 10 to 25 % protein for 24 h (short term) or 15 d (long term)*
(Mean values with their standard errors, n 4–8)

L, linear contrast; Q, quadratic contrast; OTC, ornithine transcarbamylase; OAT, ornithine aminotransferase; ASS, argininosuccinate synthetase; ASL, argininosuccinate lyase.
a,b Mean values within a row with unlike superscript letters were significantly different (P < 0·05; ANOVA).
* Activities are expressed as mmol of product formed or degraded at 37°C/h per mg of tissue.
† The level of significance was given by one-way ANOVA.
‡ Slope data.
§ Curvature data.
∥ Irregular n values do not allow pooled standard error of the mean calculation; therefore, individual standard errors of the mean and n values are indicated under the means.
¶ In the case of heterogeneity of variance, pooled standard error of the mean was not calculated, a Kruskal–Wallis test was performed, and individual standard errors of the mean are presented under the means.
Table 6 Gene expression (mRNA abundance) of ornithine-related metabolic enzymes in the ileal mucosa of rats fed a diet containing from 10 to 25 % protein for 24 h (short term) or 15 days (long term)
(Mean values with their standard errors (ratio between target gene and internal control (18S)), n 4–8)

L, linear contrast; Q, quadratic contrast; OTC, ornithine transcarbamylase; OAT, ornithine aminotransferase; ASS, argininosuccinate synthetase; ASL, argininosuccinate lyase.
a,b Mean values within a row with unlike superscript letters were significantly different (P < 0·05; ANOVA).
* The level of significance was given by one-way ANOVA.
† Slope data.
‡ Curvature data.
§ In the case of heterogeneity of variance, pooled standard error of the mean was not calculated, a Kruskal–Wallis test was performed, and individual standard errors of the mean are presented under the means.
∥ Irregular n values do not allow pooled standard error of the mean calculation; therefore, individual standard errors of the mean and n values are indicated under the means.
During the LT in vivo study, food intake, weight gain, body and organ (liver, kidneys and ileal mucosa) weight were similar between the experimental groups (data not shown).
After 15 d of modifications in dietary protein content, estimated N balance based on urinary losses was positive and not different between the three groups (Table 4). There were no modifications in enzyme activities or expressions in the jejunal mucosa (data not shown). In the ileal mucosa, while the level of OAT mRNA was threefold higher in the group receiving the 10 % protein diet (P = 0·05) than in the two other groups (Table 6), there was no difference in the activity of the enzymes under study (Table 5).
This modification in OAT mRNA in the 10 % group was associated with a 26 % rise in plasma citrulline levels in rats receiving the 10 % protein diet compared with the 17 % protein diet (P < 0·05; Table 3). Of note, plasma citrulline levels were also higher in rats fed the 25 % protein diet compared with those receiving the 17 % protein diet (P < 0·05; Table 3), and a similar pattern was observed for ornithine without statistical significance. Branched-chain AA plasma concentrations were higher in the rats receiving the 25 % protein diet compared with the two other groups (P < 0·05; Table 3).
In Caco-2/TC7 cells, culture in the presence of different AA concentrations did not affect cell viability (data not shown).
The increase in AA concentration in the apical media resulted in a linear decrease in the expressions of ARGase (P = 0·003) and OAT (P = 0·03) (Fig. 2).

Fig. 2 Direct effect of amino acid supply on ornithine aminotransferase (OAT) and arginase expressions. (a) OAT and (b) arginase relative expressions (mRNA abundance) were measured in Caco-2/TC7 intestinal cells exposed to different amino acid concentrations in the apical medium and normalised to an internal control 18S expression. Statistical analyses were performed on transformed data (log) but are presented as original data for a better visibility of the results, although values are approximations of the real means, with standard errors represented by vertical bars. P values of linear regression on transformed data (log) are 0·03 for OAT and 0·003 for arginase.
Discussion
We hypothesised that the intestine plays a major role in the control of N homeostasis via its ability to modulate the enzymes of arginine metabolism and the conversion into citrulline according to protein supply. Our data provided evidence of the in vivo modulation of these enzymes according to dietary protein content, which affects ARGase and OAT in a time-dependent manner. In addition, as AA availability is known to directly act on gene expression via specific response elements on some promoter regions (such as AA response element), we performed experiments in an enterocyte cell line. The present results further suggest that this regulation could be at least partly ascribed to a direct action of AA on the intestinal cells.
At the whole-body level, and as expected, N metabolism adapts to dietary protein intake, as shown by the fact that the rats achieved a positive estimated N balance at all three protein levels tested. This result is in line with data from Jourdan et al. (Reference Jourdan, Cynober and Moinard29), which show that the increase in cumulated N balance due to a high-protein diet (27 v. 17 % protein) disappears after 9 d of dietary modification. At the high-protein level, this was associated with increased AA oxidation and N utilisation in ureagenesis, as shown by the increase in plasma urea with unaltered NH4+ concentrations, and increased urinary N elimination. Conversely, in the low-protein group, estimated N balance tended to be lower, suggesting a better efficiency in dietary protein utilisation.
Interestingly, while we studied both the jejunum and ileum, all the observed enzymatic modifications in response to protein variations took place in the ileal section of the small intestine. Considering the major role of the jejunum in AA absorption, it might be thought that the jejunum would have been the more appropriate regulatory site for intestinal AA metabolism. However, the ileum and jejunum share a similar AA transport profile(Reference Dave, Schulz and Zecevic30). Moreover, the lower motility in the ileum than in the jejunum(Reference Phillips, Quigley and Kumar31) enhances nutrient contact with enterocytes. Therefore, we hypothesise that while the jejunum plays an important role in AA absorption, the ileum could play a role in the diet-prompted adaptation of AA metabolism. Furthermore, many literature reports have considered the small intestine as a whole, without distinction between the ileum and jejunum(Reference Matsuzawa, Kobayashi and Tashiro13, Reference Wraight and Hoogenraad18). In addition, in our experiments, protein in the diet was supplied as the highly digestible casein; it would be important to assess whether the present results are influenced by protein source, and whether it affects protein digestion and absorption across the different parts of the small intestine.
OTC has been suggested to be involved in the adaptation to variations in protein supply since Wraight & Hoogenraad(Reference Wraight and Hoogenraad18) reported higher OTC activity in the small intestine of rats receiving a low-protein diet (5 % of casein) than in those receiving a high-protein diet (60 % casein). However, in the present study, we did not observe any protein supply-related modification in OTC expression or activity. This discrepancy is probably related to the difference in the range of dietary protein levels tested in Wraight & Hoogenraad's study(Reference Wraight and Hoogenraad18) and in the present study, i.e. 60 v. 5 % protein in the former and 25 v. 17 v. 10 % here, since we chose to focus our attention on physiologically relevant variations in protein supply.
Conversely, we observed that ARGase activity did respond to dietary modifications, but only in the ST and not after a 15 d feeding. However, surprisingly, ARGase activity did not correlate with dietary protein content. Indeed, analysis of linear and quadratic contrasts showed a quadratic trend for ARGase activity at ST, and linear contrast attested for a biphasic phenomenon, with higher ARGase activity in both 10 and 25 % groups v. the 17 % group. We can only speculate why ARGase activity varies in the same direction in response to protein supply higher and lower than usual, but this suggests that it would correspond to two separate regulatory mechanisms. On the one hand, the increase in ARGase activity with the lower protein intake is in agreement with our working hypothesis (i.e. preserved peripheral arginine availability via increased citrulline synthesis enabling N sparing). On the other hand, the higher ARGase activity with the 25 % protein diet is in agreement with some data from the literature. Indeed, mitochondrially bound ARGase in the liver has been reported to increase after a high-protein diet or glucagon administration(Reference O'Sullivan, Brosnan and Brosnan32). This hepatic mitochondrially bound ARGase is thought to be ARGase II(Reference Nissim, Luhovyy and Horyn33, Reference Morris34), the same isoenzyme as found in the intestine. In the intestine, ARGase activity increased in colonocytes(Reference Mouille, Robert and Blachier35) isolated from rats receiving a casein-rich diet (58 %) for 7 d compared with ARGase activity in rats receiving a protein diet containing 20 % casein. An explanation for this ST increase in intestinal ARGase activity could be a non-specific stimulation of ARGase I and II activities in response to an increase in dietary protein intake. Of note, ureagenesis was increased despite this increase in intestinal ARGase, indicating that the elimination of N excess remains efficient. This regulation could therefore act as a protective mechanism designed to avoid a potentially neurotoxic accumulation of AA. Indeed, many studies(Reference O'Sullivan, Brosnan and Brosnan32, Reference Schimke36, Reference Morris, Moncman and Rand37) have shown an increase in hepatic ARGase expression and activity in rats receiving a high-protein diet. Moreover, since the increase in intestinal ARGase activity disappears after a 15 d administration of a high-protein diet, the present results indicate an adaptive regulation. Previous research conducted in our laboratory(Reference Jourdan, Cynober and Moinard29) has shown that rats receiving a high-protein diet for 15 d adapted their N balance after 4 d. Taken together, these results are strongly suggestive of a ST non-specific stimulation of intestinal ARGase activity following the administration of a high-protein diet, with the adaptation period spanning 4 d. This deserves further study.
Surprisingly, in the present study, arginine plasma levels varied in parallel with the modifications in ARGase activity and not linearly with the protein content in the diet as attested by the quadratic contrast. As only mixed blood was analysed, it is difficult to evaluate precisely where the adaptation in AA exchange occurs. As a result, plasma arginine levels were similarly increased in rats receiving the 10 and 25 % protein diets, despite a 2·5-fold increase in protein supply. If this is in agreement with the possibility that a non-negligible amount of arginine escapes hepatic metabolism at high protein supply, the increase in plasma arginine levels with the lower protein supply is rather intriguing, suggesting higher de novo arginine synthesis. Fluxes need to be measured with labelled AA in order to elucidate this question.
Nevertheless, the present results also show a specific regulation of this intestinal crossroad in the LT, as OAT mRNA expression increased after 15 d of a 10 % protein diet. However, we were not able to detect a significant modification in OAT enzymatic activity. Moreover, the high variance observed in the measurement of the mRNA abundance for some of the other enzymes may have masked subtle alterations in their responses to the altered protein content in the diet. These discrepancies may have two explanations. First, the differences may be related to transcriptional, translational or post-translational levels of regulation depending on the enzyme. Second, the measurements are performed on cell lysates and are therefore an approximation of the undergoing biological processes. Indeed, the data collected on tissue samples cannot account for the substrates' availability and/or the products' accumulation that can be observed in vivo. The determination of inter-organ AA exchanges using stable isotopes would allow a precise measurement of the proportion of arginine conversion into citrulline in the intestine at different time points.
Despite these discrepancies, the present results show that alterations in dietary protein supply indeed led to changes in plasma citrulline concentrations. As the intestine is the major producer of citrulline, these results imply a regulation of ornithine intestinal metabolism. The induction of intestinal OAT by a low-protein diet is consistent with the data from Matsuzawa et al. (Reference Matsuzawa, Kobayashi and Tashiro13), showing an activation of intestinal OAT and increased intestinal OAT immunostaining in the villous epithelium of rats receiving a 5 % casein diet from 1 to 4 weeks. Interestingly, these authors, using an in vitro multi-enzymatic model of intestinal citrulline synthesis, showed that doubling the amount of OAT resulted only in a 1·5-fold increase in citrulline synthesis, in agreement with the data from Wu's group on pig enterocytes(Reference Wu, Knabe and Flynn38).
As mentioned in the introduction, the regulation of this metabolic pathway by AA could involve either the hormonal response to feeding, which has been shown to vary with dietary protein(Reference Schimke36), or a direct effect of AA themselves acting on the intestine as regulatory components. Indeed, several studies in the past decade have shown that AA such as leucine(Reference Anthony, Yoshizawa and Anthony39, Reference Kimball and Jefferson40) can go beyond their nutritional role to act as signalling molecules. In the light of our in vivo results, we evaluated in a cell culture model whether AA availability has a direct effect on ARGase and OAT using an enterocyte cell line, exposed to variations in AA supply.
While it is difficult to extrapolate from the in vitro to the in vivo situation and to either a ST or LT effect because of the characteristics of the model used, the results of the present study on polarised Caco-2/TC7 cells show for the first time a direct inhibitory effect of luminal AA availability on both ARGase and OAT expressions in enterocyte cells. This finding suggests that the modulation of mRNA abundance by AA availability could be a component of the regulation of these enzymes in enterocytes. However, while this result may explain the in vivo increase in OAT mRNA at LT, it does not correlate with the results regarding ARGase mRNA abundance. This discrepancy between in vivo and in vitro data can cautiously be attributed to the fact that the modifications observed in vivo may be related only in part to a direct effect of AA and that other regulatory factors such as hormones may be involved in vivo. Nevertheless, it has been shown that AA deprivation could lead to the induction of the ‘AA response pathway’ with activation of transcription factor ATF4(Reference Kilberg, Pan and Chen41). ATF4 target genes include other transcription factors such as C/EBP homology protein and ATF3(Reference Pan, Chen and Thiaville42). In a model of leucine deprivation, Bruhat et al. (Reference Bruhat, Jousse and Fafournoux43) showed that C/EBP homology protein expression was induced at plasma leucine concentrations similar to those observed in the blood of protein-restricted animals. It would be interesting to determine whether the promoter region of ARGase and OAT genes contains similar response elements to AA availability.
Given that the intestine is the major citrulline producer(Reference Windmueller and Spaeth12, Reference Wakabayashi44), the present results support our working hypothesis that intestinal arginine metabolism is modulated in response to protein supply. The study presented here shows the implication of two intestinal enzymes, i.e. ARGase and OAT, as the only elements affected by variations in dietary protein at ST and LT, respectively. Indeed, the present results clearly show the existence of two physiologically different responses to variations in the protein content in the diet according to time, involving a regulation of arginine intestinal metabolism. The present study also brings new insight into the role of the intestine, not only as a critical organ for nutrient digestion and assimilation but also as a sensing, metabolically active organ playing an important role in N homeostasis by modulating both the amount and pattern of AA absorbed into the portal circulation. Interestingly, AA-mediated ARGase and OAT regulation appears to occur at the transcriptional level. Deeper insight into the molecular mechanisms underpinning this AA regulation of gene expression is essential for understanding the impact of nutrition, and particularly of protein intake, on cell functions.
Acknowledgements
G. V. collected the data, analysed the data and wrote the manuscript. All the other authors read the manuscript and contributed to the discussion. J. P. D. B., C. M. and L. C. designed the study and supervised the project. F. S. helped in collecting the data. V. C. helped in designing the experiment, collecting the data and analysing the data. V. L. contributed to the statistical analysis. We are grateful to Pr. A. Husson and D. Robic for their help and advice in preparing the enzymatic assays. The present study was supported by funds from the Ministry of Research and Technology (EA2498). No other financial or contractual agreements might cause conflicts of interest or be perceived as causing conflicts of interest. There are no financial arrangements between an author and a company whose product figures prominently in the paper. We thank Harvard Apparatus and Minerve for providing the devices used in the present study.


